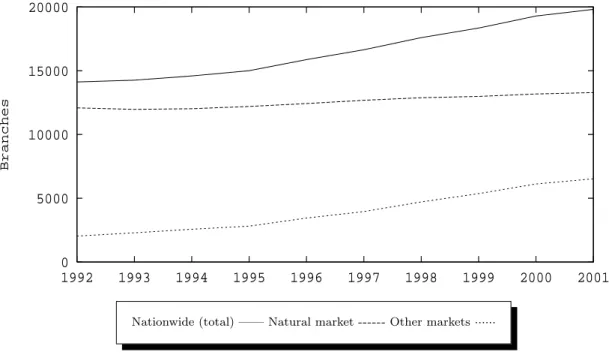
As commented above, this deregulation process in Spanish savings banks bore similarities to that of the US nationwide expansion: total variation in the number of branches across the country (natural markets and other markets).
The effects of deregulation on bank branching and geographic expansion
In a similar manner, Emmons et al. (2001) analyze the effects of geographic expansion on risk through diversification. They examine the effects of geographic expansion on cost and profit efficiency for a sample of 7,000 U.S. firms.
Data and variables
Regarding the research interests pursued here, i.e. the impact of deregulation of savings banks on their productivity, the study by Berger and DeYoung (2001) stands out. The data come from the statistical yearbooks of the Spanish Banking Association (AEB, Asociaci´on Espa˜nola de Banca) and the Spanish Confederation of Savings Banks (CECA, Confederaci´on Espa˜nola de Cajas de Ahorros).
Methodology
Measuring productivity growth for Spanish savings banks
This information is currently available on the Internet for the most recent years of the sample. 13. Recently, Grosskopf (2003) presented a general view of the Malmquist index, focusing both on its history and its decompositions, as well as suggesting lines for future research. In our specific setting, the Malmquist index attempts to determine whether a savings bank has experienced productivity growth or decline between periods t and t+ 1.
This distance function Dto is defined as the maximum inverse expansion to which the output vector int (yt) must undergo, given the input levels (xt), such that the observation is bounded at periodt. On the other hand, if Mot < 1, it indicates that productivity has fallen between periods t and t+ 1. Similarly, the term in square brackets measures technical change (TC), or shifts in the frontier between the two periods.
The above ideas were implemented using non-parametric linear programming techniques to estimate the distance functions included in the definition of productivity change. In particular, we use Data Envelopment Analysis (DEA), which falls within the broad range of techniques that measure the efficiency of a single DMU (Decision Making Unit), imposing a minimum number of assumptions on both the function to be estimated (cost, deposits or profits) and on the distribution of the efficiency indices, which is why they are usually grouped under the label of non-parametric techniques. Measuring the Effect of Geographic Expansion on Savings Bank Productivity Several studies identify the variables that explain the observed differences between efficiency and production.
Measuring the effect of geographic expansion on the productivity of savings banks Several studies identify the variables that explain the disparities observed among efficiency and produc-
- Nonparametric regression
- Conditional density estimation
In fact, in econometrics, the assumption of statistical adequacy, or correct specification of the model, has traditionally been a major concern, and a misspecification of the functional forms may imply invalid tests for the hypothesis being analyzed. A possible alternative to defining the shape of the sequence of weights is to use a kernel function that adjusts the size and shape of the weights near z. One of the most interesting alternatives is the plug-in methods; in particular, our work uses the parameter proposed by Ruppertet al. (1995), available through various statistical packages such as R.
Non-parametric regression produces a more or less smoothed curve (depending on the bandwidthh) that links productivity growth to the geographical expansion of savings banks. However, non-parametric regression does not provide information on the statistical significance of the relationship between the variables analyzed. To draw conclusions about the significance of this relationship, it may be more useful to graph the density function of savings banks' productivity growth, distinguishing between different degrees of geographic expansion of the branch network.
On the one hand, nonparametric regression does not allow one to deal with changes in modality. In our particular setting, we estimate the density function of MO, EC, and TC conditional on the level of nationwide, natural markets, and other markets' expansion (which is represented by the Z variable). Specifically, we use the modified version of Rosenblatt's (1969) estimator proposed by Hyndman et al. (1996).
Results
General trends in productivity growth: 1992–2001
Savings banks in particular have experienced annual accumulated technical progress, while the accumulated efficiency improvements are hardly achieved annually). Since 2001, there has been a clear and regular relationship between the size of savings banks and productivity gains. The productivity growth experienced by the largest savings banks over the entire period is therefore 3.65%, noticeably higher than that of the smaller savings banks (0.41%).
On the other hand, technical progress has been the primary force behind productivity growth, especially for the largest savings banks. To determine whether different patterns emerge according to the size of the branch office network (BRANCH), Table 5 shows the relationship between productivity growth (and its components) classifying savings banks into five groups according to the number of branches. Thus, productivity growth experienced over the entire period by savings banks with a network consisting of more than 402 branches was 2.78%, again much higher than growth experienced by savings banks whose network was less than.
The results for both sub-periods considered show the same pattern: larger productivity gains for savings banks with a larger network, although the patterns are not as regular as for the entire period. Indeed, in the first subperiod, the largest productivity gains occurred for savings banks whose branch network varied (on average) between 144 and 199 branches. Analysis of the sources of productivity growth reveals, once again, that efficiency was not the main cause of productivity gains for any of the branch network sizes considered, despite significant efficiency gains in the 1997-2001 period, particularly for savings banks with branch networks. over 402.

On the (nonparametric) relationship between productivity and geographic expansion Figures 3.a–11.c show the relation between productivity and geographic expansion in the three markets
On the (non-parametric) relationship between productivity and geographic expansion. Figure 3.a-11.c shows the correlation between productivity and geographical expansion in the three markets. This is shown in Figure 12, where a box plot of the geographical expansion in other markets between consecutive periods (from to + 1, in the period 1992-2001) is presented. The bottom and top lines in the "box" represent the 25th and 75th percentiles of the sample—ie. the interquartile range.
The line in the middle of the box is the sample median; if it is not centered in the box, it indicates skewness. The "whiskers" are lines that extend above and below the box, indicating the extent of the rest of the sample - unless they are outliers. If outliers did not exist, the maximum of the sample would be the top of the upper whisker, while the minimum would be the bottom of the lower whisker.
In the case of a four-year delay (Figure 11.a), the connection wanders for high values of geographical expansion; once again, this is only due to the presence of extreme observations. Specifically, considering nationwide and natural market expansion, the negative relationship described in the previous section is confirmed. However, both in terms of productivity and technical changes, there is a notable presence of multimodality, although without hiding the general trend perceived in terms of the negative correlation between two variables and geographical expansion in both markets.
Again, the role of the smoothing parameter (in this case, smoothing parameters, one for each of the variables considered in each three-dimensional graph) plays a crucial role, as it directly affects the amount of smoothing in each graph. However, for the last of the considered delays (Figures 21.a-21.c) we find a more uniform relation, but in this case the smoothing parameter matrix may encounter difficulties in revealing all possible features hidden by data.

Conclusions
On the other hand, the results are more stable, as most companies that do not expand into other markets experience small productivity gains. The results suggest that more defensive strategies pursued by firms expanding mainly within their usual markets of activity (which we have defined as natural markets) are negatively associated with productivity: the greater the branch network growth in these markets, the lower the productivity gains. . On the other hand, companies that have focused their expansionary strategies on markets where they were previously absent offer mixed results: while in some cases the relationship is clearly positive, in others it is negative.
In this way, the use of non-parametric techniques contributes decisively to the discovery of this diversity in the results. In this case, the result is not quite robust to the number of lags, as it is when we consider four lags, where the relationship gives a more positive sign (with the exception of some outliers), i.e. In this sense, we should also note that the greatest growth in productivity occurred in the period 1992-1996, while the period of the most intensive expansion of savings banks began precisely around 1996, when the mergers in which many of them were involved stopped.
Financial Services Industry Consolidation: Causes, Consequences, and Implications for the Future. Journal of Banking & Finance, 23:135–. The effects of deregulation on the performance of financial institutions: the case of Spanish savings banks. Total factor productivity growth, technological progress and change in technical efficiency: dimensions of productivity change in Yugoslavia.
The performance of the Greek banking system in the context of EMU: results from a non-parametric approach. Economic modeling. The impact of competition on the operations of foreign banks in Australia in the post-deregulation period.
F UNDACIÓN DE LAS C AJAS DE A HORROS DOCUMENTOS DE TRABAJO
Juan de Dios Jiménez Aguilera, Pedro Enrique Barrilao González 176/2003 Disminución del porcentaje de pagos en efectivo en España. 179/2003 Planes de opciones sobre acciones para directivos y consejeros y su valoración en el mercado de valores en España. 190/2004 Un enfoque de análisis de costes de la esquizofrenia en España: modelos jerárquicos bayesianos.
Antonio Estache, Beatriz Tovar de la Fé y Lourdes Trujillo 194/2004 Evolución sostenida de los fondos de inversión españoles. 197/2005 Un análisis de cointegración de la respuesta de la oferta a largo plazo de la agricultura española a la política agrícola común. 198/2005 ¿La estructura temporal de tipos de interés en el mercado español refleja una preferencia por la liquidez?
201/2005 Eficiencia técnica y asignativa fija y variable en el tiempo: una aplicación para las empresas portuarias de manipulación de mercancías. Ana Rodríguez-Álvarez, Beatriz Tovar de la Fe y Lourdes Trujillo 202/2005 Complejidad contractual en alianzas estratégicas. 203/2005 Determinantes de la evolución del empleo en las empresas adquiridas por la opa Nuria Alcalde Fradejas e Inés Pérez-Soba Aguilar.


