Agrosynergie
Groupement Européen d’Intérêt Economique AGROSYNERGIE EEIG
November 2018
Market developments and policy evaluation aspects of the plant
protein sector in the EU
Final report
EUROPEAN COMMISSION
Directorate-General for Agriculture and Rural Development Directorate C. — Strategy, Simplification and Policy Analysis Unit C.4. Evaluation and monitoring
Contact: Yves Plees
E-mail: [email protected] European Commission
B-1049 Brussels
Directorate-General for Agriculture and Rural Development
Market developments and policy evaluation aspects of the plant
protein sector in the EU
Final report
30 November 2018
LEGAL NOTICE
The information and views set out in this report are those of the author(s) and do not necessarily reflect the official opinion of the Commission. The Commission does not guarantee the accuracy of the data included in this study. Neither the Commission nor any person acting on the Commission’s behalf may be held responsible for the use which may be made of the information contained therein.
More information on the European Union is available on the Internet (http://www.europa.eu).
Luxembourg: Publications Office of the European Union, 2018 Catalogue Number: KF-03-18-447-EN-N
ISBN 978-92-79-97237-9 DOI: 10.2762/022741
© European Union, 2018
Reproduction is authorised provided the source is acknowledged.
Europe Direct is a service to help you find answers to your questions about the European Union.
Freephone number (*):
00 800 6 7 8 9 10 11
(*) The information given is free, as are most calls (though some operators, phone boxes or hotels may charge you).
This study is conducted by the European Economic Interest Group:
This study was carried out by the following experts from Oréade-Brèche: Thierry Clément, Romain Joya, Célie Bresson and Cannelle Clément.
The national experts listed below also contributed to the report:
Alessandro Serra Caracciolo (Italy) Johannes Simons (Germany) Jordi Russell (Spain)
Leonidas Nikolaou (Romania) Cannelle Clément (Austria) Wieslaw Lopaciuk (Poland)
EEIG Agrosynergie includes the following two partners:
ORÉADE-BRÈCHE SAS COGEA S.r.l.
2084 l’Occitane - 31670 Labège FRANCE Via Po 102 - 00198 Roma ITALY Tel.: + 33 5 61 73 62 62 Tel.: + 39 6 853 73 518 Fax: + 33 5 61 73 62 90 Fax: + 39 6 855 78 65 e-mail : [email protected] e-mail: [email protected]
Represented by Thierry CLEMENT Represented by Francesca ANTILICI
Date: November 2018
Agrosynergie
Groupement Européen d’Intérêt Economique
Table of Contents
1 INTRODUCTION ... 1
1.1 Objectives and scope of the study ... 1
1.2 Overarching concepts and key prerequisite needed ... 2
2 METHODOLOGY ... 5
2.1 Main terms used in the report and their definitions ... 5
2.2 Data sources for the market study and the evaluation ... 6
2.2.1 Data on policy implementation ... 6
2.2.2 Data on production, trade and exchanges ... 6
2.2.3 Literature review ... 8
2.2.4 Interviews at EU level ... 8
2.2.5 Case studies ... 8
2.3 Methodology to conduct the evaluation of the studied CAP measures ... 8
2.3.1 Summary of past support for protein crops in the EU ... 8
2.3.2 Presentation of the evaluated measures ... 10
2.3.3 Intervention logic of the main evaluated measures ... 11
2.4 Main limitations of the methodology proposed ... 13
3 EU SUPPLY, DEMAND AND EXCHANGE CONTEXT FOR PRPS ... 15
3.1 PRP supply in the EU ... 15
3.1.1 Oilseed production ... 15
3.1.2 Pulse production ... 16
3.1.3 Forage legume production ... 17
3.1.4 Relative shares of PRP production within the EU ... 18
3.1.5 Overview of PRP imports into the EU ... 18
3.1.6 Total EU supply ... 19
3.1.7 EU supply chains to sustain the EU demand for PRPs ... 20
3.2 EU demand for PRPs ... 23
3.2.1 Total EU demand for PRPs ... 23
3.2.2 Overview of PRP exports from the EU ... 24
3.3 The EU PRP trade balance ... 25
3.3.1 Oilseed balance ... 25
3.3.2 Legume harvested green balance ... 27
3.3.3 EU balance in crude protein ... 28
3.4 The case of organic and GM-free PRPs ... 29
3.4.1 Organic productions ... 29
3.4.2 GM-free products ... 31
3.5 Key elements of past trends on the supply and demand context ... 32
3.5.1 Pulse consumption for food: different trends at regional level ... 32
3.5.2 Growing demand and related tensions on soya bean global markets ... 33
3.5.3 The changing landscape of legume fodder markets ... 34
3.5.4 Impact of biofuel policies on the protein plant supply in the EU . 35 3.5.5 Diet changes and population growth drive a soaring demand for plant proteins ... 36
3.5.6 The particular case of the organic demand ... 37
3.5.7 Market context of the conventional feed market segment ... 38
4 MAIN MARKET SEGMENTS, ECONOMIC DRIVERS AND OUTLOOK ... 41
4.1 Main feed market segments for PRPs ... 42
4.1.1 Context of the feed market segments for PRPs ... 42
4.1.2 Drivers related to the use of PRPs for the conventional feed market segment ... 44
4.1.3 Drivers specifically related to the GM-Free premium market of PRPs in the feed sector ... 62
4.1.4 Drivers specifically related to the organic premium market segment of PRPs in the feed sector ... 73
4.2 Main food market segments for PRPs ... 80
4.2.1 Drivers for the market segment of pulses (whole grains) ... 82
4.2.2 Drivers for the market segment of processed plant protein products ... 87
4.2.3 Drivers for the market segment of functional protein ingredient 96 4.3 Drivers at the PRP producer level (crop farming) of both feed and food markets ... 104
4.3.1 Expected margin vs other decisive criteria ... 104
4.3.2 Variability and risk management ... 107
4.3.3 Existence of accessible and viable markets to sell the harvest .. 108
4.3.4 The specific case of producers of the organic premium markets111 5 ANSWER TO THE EVALUATION QUESTIONS ... 115
5.1 EQ 1 - Main economic drivers of the feed market segments ... 115
5.1.1 Understanding of the question ... 115
5.1.2 Method and limitations ... 116
5.1.3 Judgement criterion 1: there are (or not) market segments in the PRP feed sector with different economic drivers ... 116
5.1.4 Judgement criterion 2: the main economic agents along the different feed value chains of PRP have (or not) different economic drivers ... 117
5.1.5 Judgement criterion 3: these drivers influence (or not) the quantity, quality, producer price and geographical distribution for the main PRP feed market segments in the EU ... 117
5.1.6 Judgement criterion 4: Other drivers have (or not) an influence on PRP production ... 118
5.1.7 Conclusion of EQ 1 ... 118
5.2 EQ 2 - Main economic drivers of the food market segments ... 119
5.2.1 Understanding of the question ... 119
5.2.2 Method and limitations ... 119
5.2.3 Judgement criterion 1: there are (or not) market segments in the PRP food sector with different economic drivers ... 119
5.2.4 Judgement criterion 2: the main operators along the different PRP food value chains have (or not) different economic drivers 120 5.2.5 Judgement criterion 3: these drivers influence (or not) the quantity, quality, producer price and geographical distribution for the main PRP food market segments in the EU ... 121
5.2.6 Judgement criterion 4: Other drivers have (or not) an influence on PRP production ... 121
5.2.7 Conclusion of EQ 2 ... 122
5.3 EQ 3 – On coherence of CAP instruments with the supply sources ... 122
5.3.1 Understanding the question ... 122
5.3.2 Method and limitations ... 123 5.3.3 Judgement criterion 1: The implementation of VCS,
Diversification and EFAs resulted (or not) in changes in the cultivation area of pulses, oil seeds and legumes for forage, compared to the previous period ... 123 5.3.4 Judgement criterion 2: The implementation of VCS,
Diversification and EFAs resulted (or not) in significant changes in the production and geographical origin of pulses, oil seeds and legumes for forage, compared to the previous period ... 126 5.3.5 Judgement criterion 3: Other factors (including other CAP
measures) have had an effect on the area and/or production of pulses, oil seeds and legumes for forage, compared to the previous period ... 128 5.3.6 Conclusion of EQ 3 ... 130 5.4 EQ 4 – On the coherence of the CAP instruments with the
uses/demands ... 131 5.4.1 Understanding of the question ... 131 5.4.2 Method and limitation ... 131 5.4.3 Judgement criterion 1: There are (or not) uses and demand for
the PRP products concerned by VCS, DIV and EFAs ... 131 5.4.4 Judgement criterion 2: The EU demand for these PRP products
is higher (or not) than the EU supply and the VCS, DIV and EFAs may have had an impact on the balance. ... 131 5.4.5 Judgement criterion 3: Other factors (including other policy
measures) have had an effect on the uses/demands for pulses, oilseeds and forage legume, compared to the previous period . 133 5.4.6 Conclusion of EQ 4 ... 134 5.5 EQ 5 – On the coherence of the CAP instruments with internal and
external trade ... 134 5.5.1 Understanding of the question ... 134 5.5.2 Method and limitation ... 135 5.5.3 Judgement criterion 1: There is (or not) internal and external
trade for the PRP products supplied directly from crops (like pulses or fodder crops) concerned by VCS, DIV and EFAs ... 135 5.5.4 Judgement criterion 2: The main PRP crop/plant products
supplied directly from crops (like pulses or fodder crops) linked to VCS, Diversification and EFAs have (or not) a significant effect on internal and external trade and are coherent with economic drivers affecting it ... 135 5.5.5 Judgement criterion 3: Other factors (including other CAP
measures) have had an effect on internal and external trade of pulses and legumes for forage ... 137 5.5.6 Conclusion of EQ 4 ... 137 5.6 EQ 6 – On the coherence of CAP instruments with the development of
the different market segments ... 138 5.6.1 Understanding of the question ... 138 5.6.2 Method and limitations ... 139 5.6.3 Judgement criterion 1: The implementation of VCS,
Diversification and EFAs resulted (or not) in changes in the supply and demand of the feed market for pulses, oilseeds and legumes for forage, compared to the previous period ... 139 5.6.4 Judgement criterion 2: The implementation of VCS,
Diversification and EFAs resulted (or not) in changes in the
supply and demand of the food market for pulses and oilseeds, compared to the previous period ... 139 5.6.5 Judgement criterion 3: Other factors (including other CAP
measures) have had an effect on the production of pulses, oilseeds and legumes for forage, for the feed and food sectors compared to the previous period ... 139 5.6.6 Conclusion of EQ 6 ... 140 5.7 EQ 7 – On the coherence of CAP instruments with the development of
“premium” market segments ... 141 5.7.1 Understanding of the question ... 141 5.7.2 Method and limitations ... 141 5.7.3 Judgement criterion 1: The implementation of VCS,
Diversification and EFAs resulted (or not) in changes in the GM- free market for pulses, oilseeds and legumes for forage, compared to the previous period ... 141 5.7.4 Judgement criterion 2: The implementation of VCS resulted (or
not) in changes in the supply of organic products of pulses, oilseeds, and legumes for forage compared to the previous period ... 141 5.7.5 Judgement criterion 3: Other factors (including other CAP
measures) have had an effect on the production of pulses, oilseeds and legumes for forage, of GM-free and organic products for the feed and food sectors compared to the previous period ... 141 5.7.6 Conclusion of EQ 7 ... 142 5.8 EQ 8 – On the coherence of CAP instruments with the competitiveness 142 5.8.1 Understanding of the question ... 142 5.8.2 Method and limitations ... 143 5.8.3 Judgement criterion 1: The implementation of VCS resulted (or
not) in changes in the competitiveness of pulses, oilseeds and legumes for forage, at farm level ... 144 5.8.4 Judgement criterion 2: The implementation of VCS resulted (or
not) at market level in significant changes in the competitiveness of products of the EU pulses, oilseeds and legumes for forage sectors ... 145 5.8.5 Judgement criterion 3: Other factors (including other CAP
measures) have had an effect on the competitiveness of pulses, oilseeds and legumes for forage, at farm level ... 146 5.8.6 Judgement criterion 4: Other factors (including other CAP
measures) have had an effect on the competitiveness of pulses, oilseeds and legumes for forage, at market level ... 146 5.8.7 Conclusion of EQ 8 ... 147 5.9 EQ 9 – On the relevance of CAP instruments for addressing future
market developments ... 147 5.9.1 Understanding of the question ... 147 5.9.2 Method and limitations ... 147 5.9.3 Judgement criterion 1: There are future PP markets that could
(or not) be covered by the studied crops/plants produced in the EU and a part of the future PP markets could (or not) be covered by the studied crops/plants produced in the EU ... 148 5.9.4 Judgement criterion 2: The studied measures (VCS, EFAs and
DIV) are relevant (or not) for addressing future market developments for EU plant proteins ... 148
5.9.5 Judgement criterion 3: Other factors can influence the
coverage of future needs of PP in the EU ... 148
5.9.6 Conclusion of EQ 9 ... 148
6 CONCLUSION ... 149
6.1 Objective and method of the study ... 149
6.2 The plant protein context in the EU ... 149
6.3 Main market segments for Protein-Rich Plants in the EU ... 149
6.4 Food market segments ... 152
6.5 Summary of drivers by market segment ... 154
6.6 Main drivers of farmers producing PRPs ... 154
6.7 Coherence and relevance of the studied CAP measures with these drivers ... 154
7 RECOMMENDATIONS ... 155
8 ANNEX: BIBLIOGRAPHY ... 157
List of tables
Table 1: Correspondance between Eurostat and usual legume crop/plant names ... 7
Table 2: Choice of crops/plants and uses for the EU Member states chosen as case studies ... 8
Table 3: Share of the supply of plant proteins (including dehydrated fodder but excluding grass) for the feed sector in the EU for the year 2016 ... 9
Table 4: Member state implementation choices regarding VCS and the EFA measure in 2015 ... 11
Table 5: Total estimated dehydrated fodder area in the EU-28 and in CS-Countries in 2015 (standardised at 65% moisture for comparison with above table). ... 18
Table 6: Area share of organic production of dry pulses in CS Member States in 2015 .. 29
Table 7: Area share of organic production of oilseeds in CS Member States in 2015 ... 30
Table 8: Area share of organic production of legume fodder in CS Member States in 2015 ... 31
Table 9: Adoption rate of GM crops across the main soya bean producers (% of respective area) ... 31
Table 10: Feed use and EU origin of PRPs in the EU, converted into crude protein (2015- 2016 campaign). ... 44
Table 11: Share of the production which is self-produced and on-farm used for feed in 2015 in six case study Member States ... 47
Table 12: technical maximum incorporation levels of various plant protein sources in pig and poultry feed (based on nutritional aspects) ... 55
Table 13: differences between Austria, Germany, Finland, France and Netherlands on GM-Free national standards ... 64
Table 14: GM-Free turnover and GM-Free soya bean consumption in Austria and Germany ... 65
Table 15: Comparison of the impact of value chain integration and home-grown feed on the development of a GM-Free supply. ... 65
Table 16: Premium for dairy farmers using GM-Free products ... 71
Table 17: Organic shares for retail sales values in 2016 ... 73
Table 18: European Union organic livestock ... 74
Table 19: Comparison of pulses and oilseeds organic area in the EU-15 and the EU-13 in 2014 ... 74
Table 20: Comparison of EU-15 and EU-13 organic markets in 2014 ... 74
Table 21: Difference in egg price per premium segment in Austria from packing centre 76 Table 22: Austrian price premiums between organic and conventional ... 76
Table 23: distribution of designations of origin for dry pulses in the EU ... 84
Table 24: Producer price of three different lentil designations in France ... 84
Table 25: Place of pulses in the food pyramids and national recommendations in six EU Member States and non-EU countries ... 85
Table 26: Annual aggregate turnover of ENSA members (million €) ... 88
Table 27: Number of new pulse-based food products launched in the EU between 2010 and 2014 ... 89
Table 28: Market development stages of the different plant protein ingredients according to EUVEPRO ... 103
Table 29: Gross margins for studied protein-rich crops in 4 case-study countries (2015) (€/ha). ... 104
Table 30: Comparison of labour time and cost to manage an alfalfa vs maize silage and a temporary grassland in a French context in 2016. ... 106
Table 31: Estimated preceding crop effect of preceding legume crops ... 107
Table 32: Yield increase needed to match the wheat crop value based on price levels of
starch, protein and oil ... 107
Table 33: Diversity of varieties used and age of registration for PRPs (+wheat for comparison) in France ... 108
Table 34: Price ratio between organic and conventional productions for feed at collectors’ gate in 2015 ... 111
Table 35: Gross margins corresponding to organic average yield in AgriBio Union region and the equivalent yield in conventional to obtain the same gross margin ... 112
Table 36: Main economic drivers by feed market segment ... 116
Table 37: Main economic drivers of the feed processed plant protein product market . 117 Table 38: Main economic drivers of the whole grain pulses market ... 120
Table 39: Main economic drivers of the processed plant protein product market ... 120
Table 40: Main economic drivers of the functional protein ingredient market ... 121
Table 41: Main results of EFA measure’s impacts on N-fixing crops acreage ... 125
Table 42: Most important changes in cropping patterns in the 10 case study countries of the Greening evaluation ... 128
Table 43: Assessment of the coherence between the relevant CAP measures and the economic drivers influencing the quantity and geographical origin of the different supply sources of plant proteins in the EU ... 130
Table 44: Pulse market supply and demand in million tonnes and coverage and export rates (2016-17) ... 131
Table 45: Oilseed market supply and demand in million tonnes and coverage and exports rates (2016-17) ... 132
Table 46: Dried fodders market supply and demand in million tonnes (12% moisture content) and coverage and export rates (2016-17) ... 133
Table 47: Assessment of the coherence between the relevant CAP measures and the economic drivers influencing the different uses and demands of plant proteins in the EU ... 134
Table 48: Pulse market supply and demand in million tonnes and coverage and export rates (2016-17) ... 135
Table 49: Assessment of the coherence between the relevant CAP measures and the economic drivers affecting the internal and external trade in plant proteins to ensure a viable production of plant proteins in the EU ... 138
Table 50: Assessment of the coherence between the relevant CAP measures and the economic drivers affecting the development of different market segments to ensure a viable production of plant proteins in the EU ... 140
Table 51: Assessment of the coherence between the relevant CAP measures and the economic drivers influencing PRP organic and GM-Free productions in the EU ... 142
Table 52: Assessment of the coherence between the relevant CAP measures and the economic drivers influencing the competitiveness of EU Plant proteins to ensure a viable production of plant proteins in the EU ... 147
List of figures
Figure 1: Breakdown of the EU-28 total Plant Protein supply (109 Mt) by taking all plant protein sources: (source: own calculations based on EUROSTAT, EU Commission protein balance sheet, (Huyghe et al., 2014), (Smit et al., 2008)). ... 2Figure 2: Categorisation of plant proteins ... 5
Figure 3: Intervention logic of the Greening EFA and Crop diversification measures (own work based on Regulation (EU) No 1307/2013 of the European Parliament and the Council) ... 12
Figure 4: Intervention logic of the Voluntary Coupled Support (VCS) (own work based on Regulation (EU) No 1307/2013 of the European Parliament and the Council) ... 12
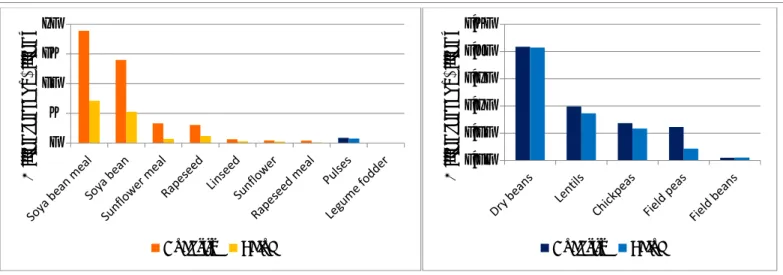
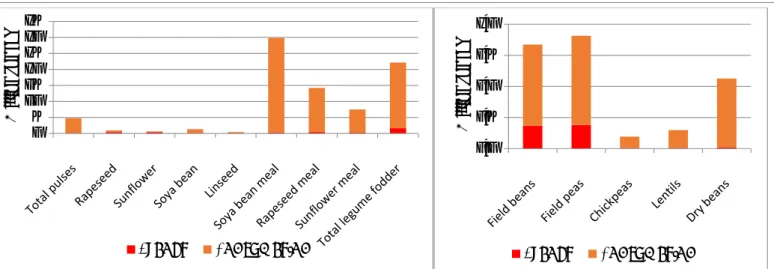
Figure 5 : Oilseed crop production in the EU and the world in 2016 (Million tonnes; FAO Stat) ... 15 Figure 6 : Average oilseed production between 2014 and 2016 by MS (Million tonnes;
Eurostat) ... 15 Figure 7 : Pulse production in the EU and the world in 2016 (Million tonnes; %; FAO Stat)
... 16 Figure 8 : Pulse PP average production between 2014 and 2016 by MS (Million tonnes;
Eurostat) ... 17 Figure 9: Total estimated legume fodder production in the EU-28 (55.6 million tonnes,
standardised at 65% moisture, in line with Eurostat standard moisture). ... 17 Figure 10 : Average annual EU PRP import between 2013 and 2015 (Million tonnes,
Billion €; Comext) ... 19 Figure 11 : Origin of oilseeds used for meal production (Million tonnes, DG AGRI,
campaign 2015-2016) ... 19 Figure 12: Supply of PRP in the EU (Million tonnes; Eurostat, Comext, FAOSTAT). ... 19 Figure 13: Main flows of materials to sustain the demand in the soya bean sector (Million tonnes, Source: own work based on several sources: Eurostat, Comext, Dg Agri, ENSA, etc. Campaign 2016-2017) ... 20 Figure 14: Main flows of material to sustain the demand in the “other oilseeds” sector
(Million tonnes, Source: own work based on several sources (Eurostat, Comext, Dg Agri, FEDIOL, etc. Campaign 2016-2017) ... 21 Figure 15: Main flows of materials to sustain the demand in the pulses sector (Million
tonnes, Campaign 2017/2018; Source: own work based on several sources (Eurostat, Comext, Dg Agri, ENSA, etc.)) ... 22 Figure 16: Legume fodder sector in the EU (Million tonnes normalized at 10% moisture,
Sources: EUROSTAT, CIDE, (Huyghe et al., 2014)) ... 23 Figure 17: Demand for PRP in the EU (Million tonnes, Eurostat, Comext, FAOSTAT). .... 24 Figure 18: Average annual EU PRP export between 2013 and 2015 (Million tonnes, Billion
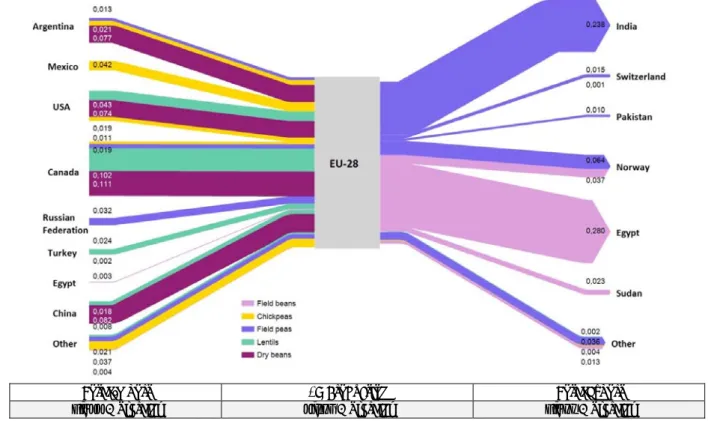
€; Comext) ... 24 Figure 19 : Soya trade between the EU and the rest of the world in 2015 (Million tonnes, Comext) ... 25 Figure 20 : Oilseed trade (without soya) between the EU and the rest of the world in
2015 (Million tonnes, Comext) ... 26 Figure 21 : Pulse trade between the EU and the rest of the world in 2015 (Million tonnes, Comext and Comtrade) ... 27 Figure 22 : Alfalfa (meal and pellets) and other forms of legume fodder (mostly bales)
trade between the EU and the rest of the world in 2015 (Million tonnes, Comext) . 28 Figure 23: PRP protein balance in the EU in 2016 (Million tonnes of crude protein, own
calculation based on DG AGRI, Terre Univia and Ciqual data) ... 28 Figure 24: Organic oilseed areas in the world (2016; FIBL) ... 30 Figure 25: World organic area and production evolutions of soya bean between 2008 and 2015 (International trade center, FIBL, IISD) ... 30 Figure 26: Average consumption of pulses in various regions and Member States in the
EU (in kg/capita/year) 1961-2013 (Source: FAO – Food balance sheet) ... 32 Figure 27: EU imports of food pulses (dry beans, chickpeas and lentils) 2000-2016
(Source: Comext) ... 33 Figure 28: China's trade, consumption and production of soya bean, share of global
volume traded and EU import price (FAOStat). ... 33 Figure 29: Brazil's trade, consumption and production of soya bean (FAOStat). ... 34 Figure 30: Link between biodiesel production capacity and rapeseed area in the EU
(EUROSAT). ... 35 Figure 31: Protein intake per capita in various world regions (FAOSTAT 2018 and own
Figure 32: Organic food market in the main organic consumers: Germany, France, Italy
and UK between 2010 and 2016 (billion Euros, FIBL) ... 37
Figure 33: Organic food market in the main organic consumers per capita Austria, Luxembourg, Sweden and Denmark between 2010 and 2016 (billion Euros, FIBL) 37 Figure 34: Total organic market in the EU between 2000 and 2016 (billion Euros, FIBL) 37 Figure 35: Penetration rate of organic segments in value in France between 2014 and 2016 (%, Agence Bio France) ... 38
Figure 36: Estimated organic retail sales per segment in France (Million €, Agence Bio France) ... 38
Figure 37: Past trends of meat and milk production ... 38
Figure 38: Meat production trends by case-study country, from 2003 to 2017. ... 39
Figure 39: Cow milk production trends by case-study country, from 2003 to 2017. ... 39
Figure 40: Main market segments using PRPs treated in this study ... 41
Figure 41: The three feed market segments studied and their main economic agents. .. 42
Figure 42: Origin of the 481 Mt of animal feedstuff consumed in the EU (FEFAC, 2017) 42 Figure 43: Overview of the main economic agents and available products to satisfy the main feed market segments ... 43
Figure 44: Simplified composition (in % of dry matter) of the main feed grains and meals used for animal feeding in the EU (source: feedipedia) ... 45
Figure 45: Amino-acid profiling of studied PRPs compared to the “ideal protein” for pork. (source: feedipedia and INRA PRODALIM). ... 46
Figure 46: Share of industrial compound feed vs on-farm feed manufacturing at EU level (own compilation from various sources: EU Commission Protein Balance Sheet, EU Commission personal communications, FEFAC 201 2017) ... 47
Figure 47: Distribution by species of the consumption of the 3 main oilseed meals in compound feed in FR in 2014/2015 (source: simulation from CEREOPA, in CS France). ... 48
Figure 48: Average protein yield per ha in the EU (source: own calculation based on EUROSTAT, N-fixing crops in green) ... 50
Figure 49: Compound feed production by market segment and CS country (source: FEFAC Statistical Book 2015) ... 52
Figure 50: Industrial compound feed material consumed in the EU in 2015 in Million tonnes (source: FEFAC Statistical Book 2015 and own calculations) ... 53
Figure 51: Feed material consumption by the compound feed industry since 1988 (source: FEFAC) ... 54
Figure 52: Incorporation rate of main feed materials by type of production in the compound feed industry in France (Source: French Ministry of Agriculture, national survey on raw materials used for compound feedstuff). ... 54
Figure 53: Example illustrating interest price vs substitution price (more relevant as a lever) for pea in 2016 in France (source: calculations from feed manufacture formulators interviewed). ... 56
Figure 54: Relative value of studied PRPs from the point of view of feed manufacturers, for granivores (pig and poultry) and ruminants (cows, sheep and goats) (source: interview with Neovia nutrition) ... 57
Figure 55: EU production and exportation of broad beans and field peas EU (source: EUROSTAT/COMEXT) ... 58
Figure 56: Projected Annual Growth of EU gross indigenous animal production (source: EU Agricultural medium-term Outlook, 2018, not yet published) ... 61
Figure 57: German GM-Free labelled products market per product segment (Million €, 2017) ... 65
Figure 58: Soya meal from the EU soya bean production (Million tonnes, EU protein balance sheet DG Agri) ... 66
Figure 59: Production of industrial compound feed per segment (poultry, cattle and pork), non-GM IP and not segregated in 14 EU MS (million tonnes, JRC, 2012) ... 67 Figure 60: Extra-EU import of soya bean products in 14 MS of EU (million tonnes, JRC, 2012) ... 68 Figure 61: GM-Free premium for the 36% protein soya meal between 2005 and 2018
(€/tonne, Feed alliance, 2018) ... 68 Figure 62: Austrian organic share of each final PRP segment in volume (CS Austria,
2017) ... 73 Figure 63: Organic consumption: Eastern and Western MS differences (billion €, Agence
Bio France, 2016) ... 75 Figure 64: Trend in the French supply and demand for organic raw material for feed
(Lubac 2014) ... 77 Figure 65: Distribution of PRP consumption between feed and food in the EU in 2015
(source: own compilation from various sources. EU Commission Protein Balance Sheet, EU Commission personal communications and USDA) ... 80 Figure 66: Pulses and soya bean consumed for food in the EU in 2017/2018 in thousand
tonnes ... 80 Figure 67: Main PRP food uses (own work) ... 81 Figure 68: Food market segments studied in the report (left) and share of the volume of pulses and soya grains used for food (in thousand tonnes and %) (right) (source:
own estimations based on various sources) ... 82 Figure 69: Pulse consumption in the EU 2011-2013 (source: own work based on FAOstat)
... 82 Figure 70: Meat substitute market size by type of products in Europe in 2015 (Source:
MarketandMarkets, 2016) ... 88 Figure 71: Whole soya bean consumption by ENSA members in 2017 and share of the EU sourcing (source: ENSA, 2018) ... 90 Figure 72: Examples of retailer brands promoting vegetarian or vegan food products
(source: Carrefour, Sainsbury’s and Kaufland) ... 93 Figure 73: Number of references available in market shelves in FR 1989-2015 and
distribution per type of uses in 2017 (GEPV, 2018) ... 98 Figure 74: Distribution of plant protein products referenced in market shelves by type of crop in France (Estève-Saillard, 2016) ... 99 Figure 75: Range of soya bean and pea protein ingredients produced to meet the
demand (EUVEPRO, 2017) ... 99 Figure 76: Pea Processing Volume of the Emsland Group 2007-2017 (1000 tonnes)
(source: Emsland group) ... 100 Figure 77: Number of new Food and Beverages tracked with vegetable protein by protein type (EU) 2007-2017 (Source: Personal communication from EUVEPRO) ... 102 Figure 78: Comparison of gross margins and significance of monetized rotational benefits for the main crops in Champagne area in France (CDER, 2018) ... 105 Figure 79: Share of PRP crops areas in arable land (Eurostat, 2016) ... 112 Figure 80: Share of organic PRP crops areas in organic arable land (Eurostat, FIBL,
Agence Bio,2016) ... 112 Figure 81: Theoretical illustration of the positioning of the 3 main feed market segments
... 118 Figure 82: theoretical illustration of the positioning of the 3 main food market segments
... 122 Figure 83: Share of EFA NFC area before weighting factors over total EFA area (%) in
2015 and 2016 (source: (Alliance Environnement, 2017)) ... 126 Figure 84: Broad and field bean areas in EE, LT and LV 2007-2016 (1000 ha) (source:
Eurostat) ... 127
Figure 86: European Biodiesel and Rapeseed Production (Source: Eurostat 2018) ... 130 Figure 87: Supply (and export) of oilseeds and their by-products in the EU (Million
tonnes; Eurostat, Comext, FAOSTAT). ... 137 Figure 88: Gross margin of irrigated soya and maize and share of VCS in Southwest
France (2017), Northern Italy (2016) and Southern Romania (2015) (Sources:
Agribio Union 2017, informatore agrario 30/2016, interviews in Romania) ... 144 Figure 89: PRP protein balance in the EU in 2016 (unit: crude protein, sources: DG AGRI, EUROSTAT) ... 149 Figure 90: Main market segments using PRPs treated in this study ... 150 Figure 91: Theoretical illustration of the five studied market segments (own work) .... 154
List of Maps
Map 1: Case studies locations ... 8 Map 2: Member States’ share of average production of PRPs between 2014 and 2016
(Eurostat) ... 18 Map 3: MS having created GM-free labelling for animal products fed by GM-Free feed in
the EU (VLOG, 2017) ... 63 Map 4: Share of the production of industrial compound feed that is GM-free, by EU MS
(European Commission, 2015) ... 67
Glossary
AA Amino Acid
CAP Common Agricultural Policy
CIDE European Dehydrators' Working Group COOL Country-of-Origin Labelling
CP Crude Protein
CS Case Study
DDGS Dried Distillers Grains with Solubles
DIV Diversification measure of the greening regulation.
DM Dry Matter
EC European Commission EFAs Ecological Focus Area
ENSA European Natural Soya and Plant Based Foods Manufacturers Association EU/EU-28 European Union
EU-27 EU Member States without Croatia (HR) EU-15 EU Member States between 1995 and 2004 EU-N13 EU Member States which joined EU after 2004 EUVEPRO European Vegetable Protein Association FADN Farm Accountancy Data Network
FAO Food and Agriculture Organization of the United Nations FEDIOL EU Vegetable Oil and Protein meal Industry Association FEFAC European Feed Manufacturers' Federation
GEPV Plant Proteins Study and Promotion Group (French) GM-Free GM-Free: Product not genetically modified
GMO Genetically modified organisms High-pro High Protein Meal
ICF Industrial Compound Feed LF Leguminous fodders Low-pro Low Protein meal LU Livestock Unit
MS Member State
NGO Non-Governmental Organization
OFF On-Farm Feed
PDO Protected Designation of Origin PGI Protected Geographical Origin PP Plant Proteins
PPP Plant Protection Product PRMs Protein-Rich Material PRPs Protein-Rich Plants or crop Reg. Regulation
RM Raw Material
RS Rapeseed
SB Soya bean
SF Sunflower
TSG Traditional Speciality Guaranteed
UAA Utilized Agricultural Area UAE United Arab Emirates USA United States of America
VCS Voluntary Coupled payments Schemes Countries taken as case studies
AT Austria
DE Germany
ES Spain
FR France
IT Italy
PL Poland
RO Romania
1 INTRODUCTION
1.1 Objectives and scope of the study
This report concerns an evaluation study of the CAP measures applicable to the EU market in plant proteins, including competitiveness effects of CAP measures applied to plant proteins. It focuses on analysing market aspects relating to the protein-rich plants in the EU and assesses in this context the coherence and relevance of the CAP measures applicable to the EU market for plant proteins.
The productions studied in both parts of this report are:
- Pulses: field beans, field peas, lupines and other dry pulses (chickpeas, lentils and dry beans1), - By-products (e.g. meals) of the following oil seeds: rapeseed, sunflower, soya bean and linseed, - Forage legumes: mainly alfalfa, clover, and sainfoin.
For all of them, their uses as feed and food (when applicable) are covered as well as their main market segments including organic and GM-free uses.
For the market aspects, the main factors influencing the EU plant protein market are analysed and include:
- the supply and demand situation for plant proteins in the EU (present and outlook);
- the various sources of plant protein supply (directly from crops like pulses and forages and indirectly from by-products, like meals from oilseed crushing);
- the different possible uses of each plant protein type (for food, feed and other uses), and their market segments;
- the main drivers of the competitiveness of plant proteins in the EU, including EU- produced and imported materials and specific drivers related to significant premium markets.
With respect to the evaluation aspects developed in this report, the main CAP measures studied are:
- two measures under the greening part of the Direct Payments regulation2, namely diversification (DIV) and Ecological Focus Areas (EFAs)
- the Voluntary Coupled Payment Schemes (VCS)3.
When relevant, other measures are taken into account, such as Rural Development measures (E.g.
agri-environmental measures), Horizontal regulations, etc. It must be noted that the evaluation part of this study is not a full-fledged evaluation as it only covers causal analysis and coherence.
The examination covers the period following the implementation of the 2013 CAP reform, notably from 1 January 2014 onwards. The geographical coverage is the EU 28.
1 Dry beans concern dried, shelled kidney beans "phaseolus vulgaris", whether or not skinned or split (excl. for sowing), Comext category number 07133390.
2 Regulation (EU) 2013/1307
3 Regulation (EU) 2013/1307
1.2 Overarching concepts and key prerequisite needed
The list of plants to be studied within the framework of this evaluation encompasses protein-rich plants and materials (>15% of crude protein). To ensure clarity and understanding throughout this report, we will use the wording “protein-rich plants” or the acronym “PRP” to mention crops within the perimeter of this study, whereas the wording “plant proteins” or “PP” will be used to mention all plant proteins derived from plants (including cereals, non-legume fodder, grazed fodders, etc.).
Although this study focuses on protein-rich plants (“PRPs”), meaning mainly oilseeds, pulses and legume fodder crops, it is important to step back and look at the share of the protein plants studied in the current evaluation within the global supply of plant proteins in the EU.
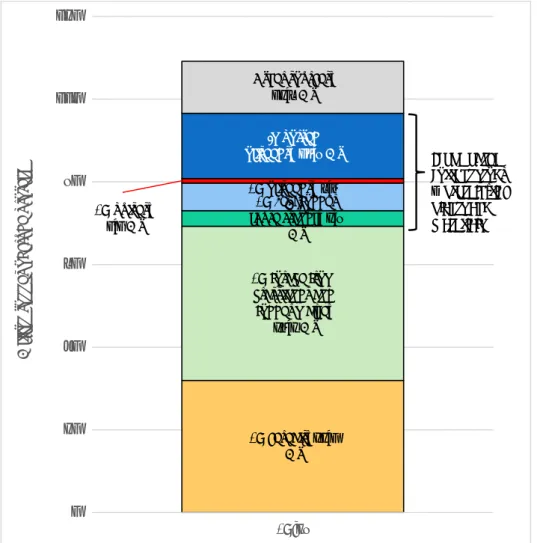
Figure 1: Breakdown of the EU-28 total Plant Protein supply (109 Mt) by taking all plant protein sources: (source:
own calculations based on EUROSTAT, EU Commission protein balance sheet, (Huyghe et al., 2014), (Smit et al., 2008)).
Figure 1 provides a first glance of protein-rich plants compared to the total plant protein supply. Given the lack of data available, this graph should be taken as a first step to provide an order of magnitude, especially for grasslands, for which little data is available4. According to this first estimate, total protein supply is estimated at 109 Mt of crude protein. Based on this estimation, protein-rich plants and materials studied in this report account for about one-fifth to one-fourth of the total EU plant protein
4 Crude protein supply estimates have been calculated by using various datasets. The EU Commission protein balance sheet provides estimates for cereals, oilseeds and various coproducts from PPs, aggregated in the category “other sources”. For EU legume fodders, only pure stands are included (no data available for associations). The estimate is also based on a combination of various European sources: EUROSTAT, national statistics and various sources from EU research projects, especially the
“multisward” project). It is difficult to estimate protein supply from grasslands as there is no official data on grasslands production and protein content. It has been roughly estimated by multiplying EUROSTAT acreage of grasslands (temporary and permanent) by an average yield of 5t dry matter/ha and 10% of crude protein. Grassland productivity mostly varies from 5 to 10t/ha Smit, H. J., Metzger, M. J. and Ewert, F. (2008) 'Spatial distribution of grassland productivity and land use in Europe', Agricultural Systems, 98(3), pp. 208-219.. Consequently, this estimate can be considered as conservative.
EU cereals; 32,0 Mt EU forage from grasslands and fodder maize;
37,3 Mt EU Leg. fodder (pure stand); 3,8
Mt EU oilseeds; 6,7 EU pulses; Mt
1,1 Mt
Imported oilseeds; 15,8 Mt
Other sources;
12,6 Mt
0 20 40 60 80 100 120
EU‐28
Million tonnes of crude protein
Scope of the current study
→protein‐rich plants and materials
(PP) supply. Providing about 37 million tonnes of crude proteins, grasslands are the first provider of PP (one-third of the supply) and cereals the second. Imported oilseeds (including imported meals and imported whole seeds crushed in the EU) are mostly from soya bean (87%), the rest being essentially sunflower and rapeseed meals. Remaining sources (mainly by-products from the food and starch industries) account for 12.6 million tonnes5.
It should also be taken into account that the wording “plant proteins” embraces a wide range of quality and protein contents according to the type of crop, processes, animals to be fed, etc. Protein-rich plants and materials remain highly relevant to balance animal feed diets given their high protein contents and their nutritional properties, especially in comparison with cereals that have low concentrations of protein, different amino-acid profiles and are more specialised in energy (cf. 4.1.1 + box 2). Moreover, contrary to legume crops, cereals and grass are not N-fixing crops, meaning that there is often a quantitative link between nitrogen fertilisers applied and protein production (see box 1). However, N-fixing crops such as pulses, soya bean and forage legumes are naturally able to fix nitrogen.
Box 1: The link between Plant proteins and nitrogen
The field of plant proteins is by its nature inherently linked to nitrogen. Nitrogen is a fundamental component of amino acids, which are the molecular building blocks of proteins. Thus, it is highly relevant to address plant proteins in the light of the nitrogen cycle. Dinitrogen (N2) in the atmosphere is very stable but other forms are very reactive, although they are essential for plant growth.
All nitrogen in animals and humans originates, in one way or another, from plants or microbes because only these can convert mineral forms of reactive nitrogen (e.g. nitrate and ammonium) into organic nitrogenous compounds such as amino acids and then proteins. The availability of these basic mineral forms of reactive nitrogen is a key factor determining the productivity of crops for food and feed, including protein levels.
The 2 main pathways for production of these mineral forms of reactive nitrogen for agriculture are:
‐ biological nitrogen fixation in crops: a biological process occurring in natural ecosystems which allows atmospheric N2 to be converted into mineral nitrogen (NH3) that can be assimilated by living organisms after decomposition. This process is carried out by specific N-fixing bacteria that are associated with the root nodules of legume plants, including pulses, some oilseeds (soya only) and legume fodder addressed in this study;
‐ synthetic fertilizers: especially through the Haber–Bosch process, which combines atmospheric N2 with hydrogen from methane to produce the main fertilisers used on the planet: ammonium nitrate, ammonium sulphate, or urea.
N fertiliser manufacture has partially and artificially replaced the initial role of legume crops to add nitrogen into agricultural systems, especially in Europe where pulses and legume fodders account for less than 6 % of arable lands (Schneider and Huyghe, 2015). Nitrogen being vital for crop growth and production, this observation underlines the fact that the EU strongly relies on synthetic fertilisers for its nitrogen supply, at the cost of N- fixing legume crops. It also stresses the fact that the EU mostly imports nitrogen derived from a technically free synthesis (biological fixation), especially soya from South America, to feed its livestock, generating huge nitrogen surplus in areas with high livestock density (generating some of the aforementioned adverse effects).
Conversely, the EU exports nitrogen obtained from a costly fertiliser manufacture, notably through the export of cereals produced far from livestock areas, where nitrogen surplus occurs in agricultural soils.
5 The category “other sources” includes small categories of the EU protein supply that are not covered by the main categories of the graph, namely: imported cereals + imported oilseeds + imported pulses + the “others” category of the EU protein balance sheet (Palmkern meal , Other oilseed meals, Corn Germ meal, Corn Gluten Meal, Corn Gluten Feed, Distiller's Dried Grains with Solubles, Wet Distillers Grain, Wheat bran, Wheat gluten feed, Citrus pulp, Beet pulp pellets, Molasses, Processed Proteins, Former Foodstuff).
2 METHODOLOGY
2.1 Main terms used in the report and their definitions
The main terms used in this report are detailed in Figure 2, which aims at clarifying which material falls under which class.
Figure 2: Categorisation of plant proteins
Other important terms for the understanding of this report are listed hereinafter:
Crude protein: calculated after measuring the nitrogen content of a food. Because each amino acid (the building block used to make protein) contains nitrogen, looking at the total nitrogen content of a food gives some insight into its protein content. However, because not all of the nitrogen in food is found in protein, using crude protein as a measurement might slightly inflate measurement of protein content. In animal feeds, crude protein is calculated as mineral nitrogen x 6.25 (the assumption is that proteins of typical animal feeds contain 16% nitrogen on average).
Legume fodder/forage legumes: forages derived from the legume family such as alfalfa (or lucerne), clover, vetches, sainfoin, etc.). Legume fodders can be cut or grazed like grass (rarely). If cut, they can be sun-dried or preserved under various forms (hay, haylage, silage, dehydrated). All processes can be conducted on the farm except dehydration, which is carried out in dehydration plants by using various sources of energy (coal, lignite, wood, biogas, etc.) 6.
Meal (Oilseed-): An oilseed meal is the by-product of the extraction of oilseed oil (rape, sunflower, soya bean, linseed). Several processes exist, resulting in different products. The meal is usually classified for marketing by its crude protein content. There are often two main categories of soya meal, the “high-protein” or “High-pro” meal, made of dehulled seeds, and the “conventional" soya meal or
“low-pro”. For example, for soya, the “high-protein” soya meal contains 47-49% protein and 3% crude fibre, obtained from dehulled seeds, and the “conventional" soya meal contains 43-44% protein. In
6 In areas with wet or unstable climatic conditions, dehydration enables preserving the nutritional quality of the fodder, especially because it preserves the leaves, the part of the plant containing most of the protein content.
Plant proteins (PPs)
Protein‐Rich Plants (PRPs)
Oilseeds
Pulses
Legume fodders
Protein‐Rich Materials (PRMs) (derived from PRP
processing)
Oilseed meals
Protein flours (50 % < CP < 65 %) Protein concentrate
CP>70%
Protein isolates CP>90%
Others (textured proteins, albumins,
etc.) Other plant proteins
(beyond the scope of the study: cereal gluten, grasslands, graminaceous plants,
cereals, etc.)
solvent-extracted soya meals, the oil content is typically lower than 2% while it exceeds 3% in mechanically extracted meals.
N-fixing Crops: plants that contribute to nitrogen (N) fixation include the legume family – Fabaceae – with taxa such as soya beans, alfalfa, pea, beans, lupine, peanuts, etc. Such plants contain symbiotic bacteria called Rhizobia within nodules in their root systems, producing nitrogen compounds that help the plant grow without need for extra-N fertilisation. N-fixing plants addressed in the current study are: all pulses, legume fodders, and soya.
Other terms crucial for the understanding of the study are:
Plant Proteins (PPs): all protein found in plants.
Protein concentrate/isolate: Protein concentrates and isolates are made by separating the protein fraction of seeds (mostly soya and pea) or more rarely of leaves (alfalfa) from the fibre, oil and starch fractions.
Protein-Rich Plants (PRPs) and Protein-Rich Materials (PRMs): plants and their related co- products, products with more than 15% of crude proteins.
Pulses: refers to the edible seeds of various crops (such as peas, beans, or lentils) of the legume family.
For the market study the main concepts used are:
A spot market is a market for currencies or commodities in which they are sold and given to the buyer immediately, rather than being sold forward (i.e. to be taken on a future date).
A futures market is an auction market in which participants buy and sell commodity and futures contracts for delivery on a specified future date.
A campaign contract (also called production contract) are contracts regulating an exchange of an agricultural production between a supplier and a buyer (e.g. a farmer and a collector) for a given quantity, at a given quality and for a delivery on a particular date in the future. The contract can also specify the price.
2.2 Data sources for the market study and the evaluation The main following data sources are used for this evaluation study.
2.2.1 Data on policy implementation
The MS implementation choices regarding the greening measures (EFAs and crop diversification) are analysed based on their annual declaration to the European Commission for the period 2015-2017.
The case studies in seven Member States provide complementary information with regard to the main drivers of PP production, processing and trade and the observed effects of the evaluated measures as well as their potential effects in the future.
2.2.2 Data on production, trade and exchanges Eurostat
In Eurostat, disaggregated data is only available for four N-fixing crops: soya bean, broad and field beans, field peas and sweet lupines. However, since legume fodder and fresh pulses also represent a large share of N-fixing crop area, they are analysed even though no disaggregated variables are available at this stage. There is no disaggregated data on chickpeas and lentils, which are grouped in
“Other dry pulses”.
Alfalfa disaggregated data exists on Eurostat but there are too many missing data points to enable analysis, thus legume fodder is studied aggregated in the category “Legume plants harvested green”.
Concerning oilseeds, disaggregated data is available on rapeseed, sunflower and linseed.
Eurostat data is used to understand production volumes and yields (through the area data) of the crops/plants studied in each MS and within the EU.
Table 1: Correspondance between Eurostat and usual legume crop/plant names
Name on Eurostat Common name Latin name
Dry pulses
Field pea Pea Pisum
Broad and field bean Faba bean (horse bean for some imported
products) Vicia faba
Sweet lupine Lupin Lupinus
Chickpea Chick pea Cicer
Fresh pulses Fresh peas Pea Pisum
Chick pea Cicer
Fresh bean Bean Phaseolus and vigna spp
Rapeseed Rapeseed / Colza Brassica napus
Sunflower Sunflower Helianthus anuus
Linseed Linseed Linum usitatissimum
Soya bean Soya Glycine
Legume plants harvested green Legume fodder: Alfalfa (lucerne), clover,
sainfoin, vetch Medicago sativa, trifolium, onobrychis, vesca
Source: own work
Comext
Comext disaggregated data is available for soya bean, soya meal, sunflower seed and sunflower meal, linseed, field peas, dry beans7, lupine, alfalfa (meal and pellets) and other forms of legume fodder (mostly bales)8. Concerning rapeseed and rapeseed meal, as these categories were empty, we added up the high and low erucic rapeseed categories9, as these were complete. Data was lacking concerning field beans, chickpeas and soya bean (before 2012). Comext has been used to show trades between the EU and the rest of the World and between Member States on the studied crops/plants.
FAO Stat
FAO Stat disaggregated data is available for soya beans, field beans, dry peas, lupines, chickpeas, lentils, rapeseed, sunflower and linseed. There is no data on legume fodders. FAO Stat is used to study production volumes and yields of the crops studied in the World to be compared to the EU-28.
Comtrade
In Comtrade, disaggregated data is available for soya bean, field beans10, peas, chickpeas, lentils, rapeseed, sunflower seed, linseed and alfalfa. There is no data on lupine seeds. Legume fodder other than alfalfa are grouped together in “Swedes, mangolds, fodder roots, hay, clover, sainfoin, forage kale, lupines, vetches & similar forage products, whether or not in the form of pellets”. We decided that this category was too broad to represent trades of legume crops harvested green other than alfalfa, therefore we only study alfalfa trades. Comtrade has been used to show trades between the EU and the rest of the World and between European member states on the studied crops/plants, when data was not usable from Comext. This mainly concerns field beans, chickpeas and soya bean (before 2012).
Resourcetrade.earth
In rare cases, data wasn’t available on Comtrade but in this dataset (e.g. intra-European exchanges).
This website uses mainly Comtrade data, but completed with Chatham House Resource Trade Database.
7 “Dried, shelled kidney beans "phaseolus vulgaris", whether or not skinned or split (excl. for sowing)” (07133390).
8 “Hay, alfalfa, clover, sainfoin, forage kale, lupines, vetches and similar forage products (excl. Swedes, mangolds and other fodder roots and alfalfa meal)” (12149090).
9 Rapeseed category corresponds to the sum of “Low erucic rape or colza seeds ‘yielding a fixed oil which has an erucic acid content of < 2% and yielding a solid component of glucosinolates of < 30 micromoles/g’, whether or not broken (excl. for sowing)” (12051090) and “High erucic rape or colza seeds ‘yielding a fixed oil which has an erucic acid content of >= 2% and yielding a solid component of glucosinolates of >= 30 micromoles/g’, whether or not broken” (12059000). Rapeseed meal category corresponds to the sum of “Oilcake and other solid residues, whether or not ground or in the form of pellets, resulting from the extraction of low erucic acid rape or colza seeds ‘yielding a fixed oil which has an erucic acid content of < 2% and yielding a solid component of glucosinolates of < 30 micromoles/g’" (23064100) and “Oilcake and other solid residues, whether or not ground or in the form of pellets, resulting from the extraction of high erucic acid rape or colza seeds ‘yielding a fixed oil which has an erucic acid content of >= 2% and yielding a solid component of glucosinolates of >= 30 micromoles/g’"
(23064900).
10 Actually broad and horse beans in Comtrade
2.2.3 Literature review
The complete list of the literature review (references) is given at the end of the report.
2.2.4 Interviews at EU level
Interviews have been held at EU level, with organisations representing European farmers and operators in the sectors. The ones interviewed are:
‐ CIDE: European Association of Forage Processors,
‐ COCERAL: European association representing the trade in cereals, rice, feedstuffs, oilseeds, olive oil, oils and fats and agro-supply,
‐ COPA-COGECA: committee of farmers and their cooperatives in the European Union,
‐ ENSA: soya bean industry and plant-based food producers,
‐ EUVEPRO: European Vegetable Protein Association,
‐ EVPA: European Vegetable Protein Association,
‐ FEDIOL: EU vegetable oil and protein meal industry association,
‐ FEFAC: European Feed Manufacturer’s Federation.
In most cases, the organisations invited economic operators (e.g. experts from private companies) to contribute to the discussion, especially traders, importers, processors and feed manufacturers.
2.2.5 Case studies
In order to study PRP production in detail, supply, demand, trade and their main drivers, the ToRs specified to carry out case studies (CS) in selected Member States are mainly chosen on the basis of their production and markets of the studied plants/crops. These CS include data collection, bibliography and interviews of officials, operators of the sectors and other relevant stakeholders such as researchers, technical institutes, unions, etc. From 10 to 25 semi-directive interviews have been conducted for each case study.
The final choice for these case studies is shown in Table 2 and Map 1, the Austrian CS being specifically focused on the GM-Free and organic markets.
Table 2: Choice of crops/plants and uses for the EU Member states chosen as case studies
Crops/plants AU DE ES FR IT PL RO
Broad and field beans X X X
Field peas X X X
Other dry pulses & sweet
lupine X X X
Rapeseed X X X
Sunflower X X X
Soya X X X X
Legume plants HG X X X X X
Total 2 5 3 7 3 2 2
Feed uses X X X X X X X
Food uses X X X X
Map 1: Case studies locations
2.3 Methodology to conduct the evaluation of the studied CAP measures
2.3.1 Summary of past support for protein crops in the EU
Since the Second World War, the importance of grain and fodder legumes on arable lands has dropped, from around 15% of arable land to 6% in the EU. This is due to a series of reasons including the
“intensification of livestock farming (gradually relying on massive imports of soya bean), competition
with other crops that were more profitable, European political support for cereal productions and an increasingly unfavourable climate and pest pressure”11. This strong decrease in production implies that a significant share of the EU PRP supply is now covered by imports. In addition, the use of grains and processed feed (from import and from the EU) has highly increased in the livestock sector whereas the use of grass has significantly decreased, reducing the use of low protein value plants. With regard to oilseeds, the past trends are significantly different. Starting from a very limited area, they reached a significant portion of the arable land area until the MacSharry reform in 1992 setting up area-based payments.
In the context of the GATT Dillon Round in 1962, the European Commission dropped its import tariffs on oilseeds, oilseed products and non-grain feed ingredients, allowing the U.S. and other exporters to enter the European market duty free. This agreement had several consequences on EU agricultural sector:
- as soya bean imports were competitive (compared to substitutes), imported soya meal has developed as a major source of protein for animal feed and has favoured European animal productions and industry.
- because of the large demand for soya bean, Argentina and Brazil have developed their
production and became the main soya bean suppliers for the EU (taking advantage of the duty- free trade with the EU).
Thirty years later, in the context of the GATT Uruguay Round negotiations in 1992 (paving the way for the Uruguay Round Agreement), the EU and the U.S. negotiated a Memorandum of Understanding on Oilseeds (often referred to as the 'Blair House Agreement'). This agreement sets limits on EU support for oilseed production:
- the supported area was capped at 5.482 million hectares12.
- the quantity of co-products, expressed in soya meal equivalent, made available through oilseeds for non-food purposes on subsidised set-aside land, was capped at 1 million tonnes.
The agreement probably favoured soya bean imports. However, since the CAP health check in 2008 abolished the specific payment for energy crops and the set-aside regime, the agreement is generally considered (on the EU side) as no longer having an effect. However, even though it is not considered as restrictive in the framework of the current CAP, the Blair House agreement is still in force.
Table 3 shows the level of dependency of the EU in terms of protein for the animal sector, particularly on imported soya meals and grain.
Table 3: Share of the supply of plant proteins (including dehydrated fodder but excluding grass) for the feed sector in the EU for the year 2016
Protein source
EU total products feed use
(Mt)
Products feed use EU origin
(Mt)
EU total protein feed use
(Mt)
Protein feed use EU origin
(Mt)
% Feed Use of EU Origin (I) / (H)
% protein use in the feed sector
Crop grains 177.6 159.2 18.30 16.60 91% 41%
Co‐products from arable land 84.1 44.6 25.57 9.77 38% 57%
Other sources 2.3 2.2 0.92 0.86 94% 2%
TOTAL 264.0 206.0 44.8 27.2 61% 100%
Source: DG Agri based on Eurostat and Comext
A range of measures including protection of the market (price support), coupled and decoupled direct subsidies, and agri-environmental schemes have been used to support protein crop production in the past. Between 1958 and 1992, various price support schemes were available for soya bean, pea, field bean and lupin. In 1989, area payments were introduced for chickpea, lentil and vetches. In the reform of 1992, price support was decoupled and replaced with area payments. These payments varied according to crop type, with soya bean receiving less than other protein crops. In the 2003 reform, all area payments were included in the Single Payment Scheme. The “protein premium”, which was a top- up payment within the single payment scheme, was used until 2012 on a restricted area basis in 17
11 Voisin et al. 2013
12 The agreement allows for modification of this maximum supported area, further to enlargement of the Union. While the original maximum base area was set at 5.128 million hectares, it was increased to cover the EU15 further to the 1995 enlargement. However, no amendment of the agreement was negotiated to reflect subsequent enlargements.
Member states, including some of the main protein crop-growing countries. In addition, Lithuania, Poland, and Slovenia used specific measures available to the new Member States to support protein crops.
2.3.2 Presentation of the evaluated measures
Several measures of the CAP have an influence on the development of crops or plant cultivation.
Among them the most significant ones are:
- the diversification and Ecological instruments (EFAs) of the greening part of direct payments - the voluntary coupled payments,
Some others may also have an effect, such as some measures or instruments of the CMO, the AECMs13 of the second pillar, the nitrate directive, but their potential effect is limited so they will be taken into account mostly qualitatively.
It is noteworthy that organic farms are not concerned by these greening requirements as it is considered that they already fulfil the environmental conditions.
2.3.2.1 Greening measure: the EFA and crop diversification measures EFAs
The EFA Measure requirement14 is to have at least 5% of the arable land of farms larger than 15 hectares (excluding permanent grassland) managed as an EFA (for instance field margins, fallow land, landscape features, buffer strips, afforested area, etc.). N-fixing crops (which include several of the crops/plants under study, but not all15) are one option that could be offered to farmers to comply with the EFA measure. In 2015, all Member States except Denmark allowed N-fixing crops as an EFA. For the year 2018 onwards16, the use of plant protection products is prohibited on all areas of EFA N-fixing crops from establishment until after harvest of the N-fixing crop.
Crop Diversification
Under the crop diversification measures, most EU farmers17 are required to grow at least two or three crops according to their farm size18.
The crops and plants under study are rarely grown as the main crop in specialised farms and therefore would be an option for the farms to diversify their cropping patterns.
A given area of N-fixing crops declared as EFA also counts for the crop diversification measure. In other words, growing N-fixing crops can be an option for farmers (e.g. in mono-cropping farms) to comply with both measures. Furthermore, since 2018, the crop diversification requirement has not applied to farms with more than 75% of arable land used for the production of legume crops19.
2.3.2.2 Voluntary coupled payments
Since 2015, Member States have provided Voluntary Coupled Support (VCS) to a list of sectors and productions (which may include several of the crops/plants under study), to the extent necessary to create an incentive to maintain current levels of production in sectors or regions where specific types of farming or specific agricultural sectors that are particularly important for economic, social or environmental reasons undergo certain difficulties20. Coupled support can take the form of an annual payment and is granted within defined quantitative limits in accordance with Article 52(6) of Regulation No 1307/2013. In this context, for each measure, member States shall determine a quantitative limit (QL). The limit reflects the production levels in the targeted region or sector of at least one year in the
13 Agri-Environment-climate measures
14 Regulation (EU) 2013/1307
15 Sunflower and rapeseed are not included
16 According to Regulation (EU) 2017/1155 of the European Parliament and of the Council of 15 February 2017
17 In 2016, 75% of arable land in the EU (excluding France, for which data is unavailable) was subject to the crop diversification measure, with 63% subject to the three crop rule and 12% subject to the two crop rule.
18 Where the arable area is 10-30 ha (and not entirely cultivated with crops under water for a significant part of the year) at least two different crops must be grown and where the arable area > 30 ha at least three crops must be grown.
19 According to Regulation (EU) 2017/2393 of the European Parliament and of the Council of 13 December 2017
20 Regulation (EU) No 1307/2013 of the European Parliament and the Council