Had they both been included in the index, China would have ranked between Slovakia (26th) and Japan (27th), while India would have ranked last, behind Korea (33rd). Closing the gender pay gap could result in gains of more than $2 trillion, while improving women's labor force participation could result in gains of $7.5 trillion, more than the gains for the OECD combined. Chile and Hungary both saw their absolute performance decline compared to last year due to an increase in the gender pay gap.
Since 2000, Luxembourg and Poland have significantly improved the index, as a result of a significant reduction in the gender pay gap and a large reduction in the female unemployment rate. However, the UK's ranking rose by just one place due to significant improvements in employment opportunities for women elsewhere in the OECD. This is due to the increased participation of women in the workplace and the reduction of the wage gap.
China and India can make significant gains by promoting gender equality and female labor force participation. The OECD continues to make slow but steady improvements in female economic empowerment over the past year, driven primarily by a decline in the gender pay gap and the female unemployment rate.
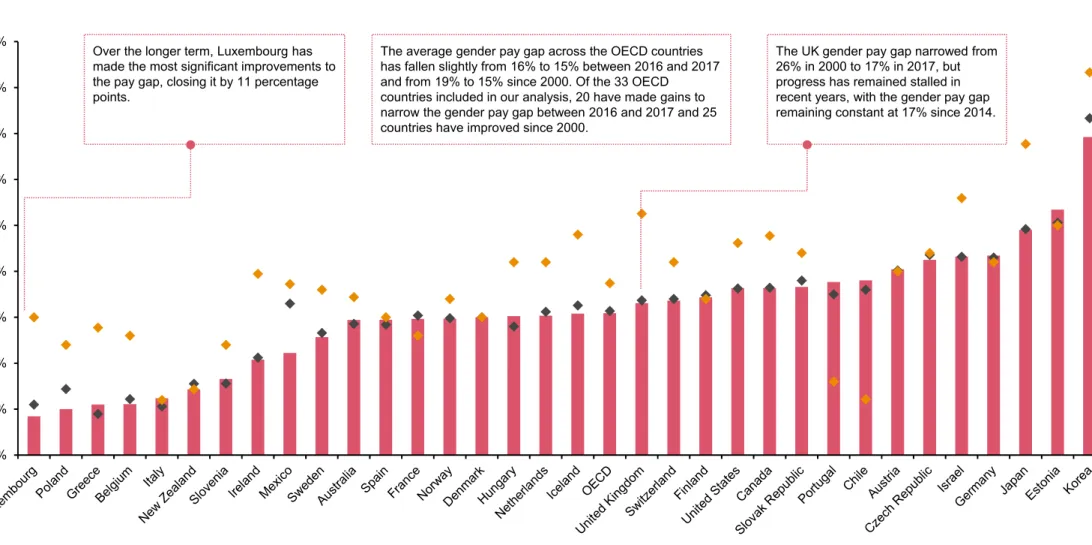
PwC Women in Work Index, 2017 vs. 2016
Biggest movers in the PwC Women in Work Index ranking between 2000 and 2017
United States
Increasing the number of women in the workforce could increase OECD GDP by more than US$6 trillion.
Our analysis provides estimates of the broad order of magnitude of potential gains for each country from increasing female employment rates to match
Gains from increasing the female employment rate across the OECD to match Sweden’s
Closing the gender pay gap could boost women's wages in the OECD by more than US$2 trillion, a 22% increase.
Gains from closing the pay gap across the OECD
We consider the potential gains from closing the pay gap between men and women across the OECD
UK performance 2016-2017
Long term trends: UK performance since 2000
UK Index performance compared to the OECD average
Gender pay gap reporting
Shared parental leave
Women in Finance Charter
Hampton-Alexander Review
We assess how different UK regions would have performed by estimating the Women in Work Index for each of these regions, applying the same
All regions improved women's economic empowerment in absolute terms compared to 2016, with Scotland, the South West and Wales taking the podium. Long-term trends in the index show that economic growth tends to be associated with improvements in the index. There appears to be a small positive correlation between regional gross value added (GVA) growth and changes in the inter index score.
There appears to be a small positive correlation between the growth in regional gross value added (GVA) and changes in the Index score between
Relationship between long-term regional economic growth and changes in Index performance, 2010-2017
Biggest movers in the PwC Women in Work Index ranking between 2010 and 2017
6 – North West: Since 2000, there has been steady progress across all indicators, most notably the gender pay gap, which has fallen by 12 percentage points. This impressive improvement took the North West from one of the largest gender pay gaps in the UK to one of the smallest. The region now has the lowest gender pay gap and the lowest female unemployment rate.
3 – Wales: Since 2010, female labor force participation has increased by 5 percentage points and female full-time employment has increased by 2 percentage points, both improvements above the average for UK regions. 5 – South East: Progress towards closing the gender pay gap in the South East was slower to take off than elsewhere in the UK with a limited reduction seen between 2000 and 2010. However, between 2010 and 2017 the gender pay gap fell by 5 percentage points, the largest reduction of any region during this period.
11 – East Midlands: The East Midlands has made modest improvements across almost all indicators since 2000, but its gains have been outpaced by improvements in other regions since 2010, meaning the region now lags behind all regions except the West Midlands. The region has also achieved an above-average reduction in the gender pay gap since 2010. 7 East: Since 2010, the region has achieved an above-average improvement in full-time employment for women.
Since 2010, the female employment rate has increased by 6 percentage points, which may have been the result of its relatively strong economic growth and the creation of job opportunities. The gender pay gap has seen the greatest progress and has fallen by 9 percentage points in this period. 8 – Northeast: The Northeast has seen the largest reduction in the gap in male and female labor force participation since 2000, falling from 11% to 8%.
This is partly because the region has experienced one of the largest increases in female labor force participation during this period.
China
Gender pay gap
Female unemployment rate
Female full-time employment rate
Females added to the global workforce since 2000
Female labour force participation rate
The world’s second largest economy, China has experienced cumulative GDP growth of over 42% over the five years from 2012-2017 , which has
Over this period, China has continued to have one of the highest female labour force participation rates (69%) and female full-time employment rates
There have been gains for women in educational attainment with both UN and Chinese official statistics showing that there are now more Chinese
If included in our Index, how would China perform?
How much are the gains to China from improving female employment?
How much are the gains to China from closing the gender pay gap?
Women in China "hold half the sky" with remarkable successes in the large number of female entrepreneurs and billionaires, but challenges remain. There are still obstacles preventing women from taking full advantage of China's economic expansion, but Chinese women have also enjoyed it.
There remain obstacles that prevent women from taking full advantage of China’s economic expansion but Chinese women have also enjoyed
China’s challenge in improving gender equality in the workplace lies in reviewing policies and focusing on strengthening working women’s rights
India has made good progress in women's economic empowerment since 2000, but still has a long way to go to reach OECD levels, suggesting that substantial gains could be made by closing the gender gap in India's labor market.
If included in our Index, how would India perform?
How much are the gains to India from improving female employment?
How much are the gains to India from closing the gender pay gap?
Over the same period, the female working age population grew by 9%, which has resulted in an increase in the absolute number of women entering the
Women’s educational attainment is also on an upward trajectory, with 89%
Despite significant gains in educational attainment and growth in economic opportunity, significant barriers remain for women in India.
Despite the significant gains in educational achievements and the growth in economic opportunity, there remain significant barriers to women in India
Several initiatives by the government and the private sector are underway to bring more women into the workforce and promote economic opportunity
Set realistic objectives and a plan to achieve them
Drive accountability from the top
Align diversity with your business strategy
Use data: what gets measured gets done
By building a picture of how women move through an organization over time, we can project trends forward to predict the representation of women in an organization. In a picture of how women move through the organization over time, trends can be projected forward to predict representation. of women in the organization in the future. Tests can then be used to understand how improvements in specific areas (for example, graduate recruitment or senior job retention) will affect this picture, enabling organizations to understand the 'return on investment' of various interventions and set appropriate targets.
Recruitment
Retention
Progression
Data, technology and analytics can help inform and drive diversity and inclusion
Getting into the labour market > Staying in the labour market > Moving up the career ladder
OECD data refer to the difference in median earnings for all full-time workers, while Eurostat compares average earnings. Female labor force participation remained unchanged at 69% on average across the OECD from 2016 to 2017. The gap in the labor force participation rate between men and women has remained constant on average across the OECD between 2016 and 2017, with Luxembourg experiencing the largest.
In the longer term, the participation gap has fallen from 17% to 11% on average across OECD countries and has narrowed in all countries except Poland. The average unemployment among women in the OECD in 2016 was the same as when it fell after the crisis from the previous higher levels. The proportion of women in full-time employment has remained constant between 2016 and 2017 across the OECD.
Since 2000, female full-time employment has fallen from 76% to 75% on average, with countries such as Chile, Italy and Austria experiencing a large increase in the proportion of women working part-time. In the UK, full-time employment for women has risen from 59% to 63% since 2000, but the UK continues to lag behind the OECD average on this indicator by 12 percentage points. All data provided by the OECD with the exception of data on the wage gap which is obtained from Eurostat for all countries except the following where data is obtained from the OECD: Australia, Canada, Chile, Greece, Ireland, Israel, Japan, Korea, Mexico, New Zealand, Great Britain and the United States.
Methodological differences account for the differences between the data on the gender pay gap reported by the OECD and Eurostat. The OECD wage gap measures the difference in average earnings for all male and female full-time workers across all sectors, while Eurostat's headline wage gap (used primarily in our analysis) measures the difference in earnings hourly average for all male and female employees for all sectors except agriculture and public administration. Note: Throughout this report, we follow conventions in the literature and refer to the gap between male and female pay as the "gender pay gap."
Equality in labor force participation reflects equal opportunity in seeking and accessing employment in the workplace. Being unemployed can have longer-term consequences in the form of skills erosion, declining pension contributions and increased dependence on benefits. However, this factor is given a lower weight in the Index, because some women prefer a part-time job because it fits flexibly with their care responsibilities.
We break down GDP in the following way
GDP boost = GDP/FTE
Simplifying assumptions
Total earnings
Average male earnings 1
Male workers
Average female earnings 1
Female workers where
Average male earnings
Average female earnings
Sweden’s FFTE is higher
Gender Pay Gap Women and Men in India (2017), Government of India and Gender Pay Gap Report (2016), World Economic Forum and. Calculated using urban and rural hourly wages (weighted by proportions of urban and rural employment). Tang and Scott, 2017) based on 2013 China Household Income Projects (CHIPs) data for rural and urban workers. Women and Men in India (2017), Government of India and Employment and Unemployment Situation in India Government of India and World Bank.
We used the same methodology as the main index to construct the UK regional index. Female Unemployment Rate Annual Population Survey, Office of National Statistics Labor Force Survey, Office of National Statistics (2000). Descriptive Evidence and a Review of Potential Policies, Harvard Kennedy School Faculty Research Working Paper Series RWP18-004.
Does Gender Inequality Reduce Growth and Development?, World Bank Policy Research Report Working Paper No. 7, The World Bank, Washington, DC. This publication has been prepared for general guidance only on matters of interest and does not constitute professional advice. You should not act on the information contained in this publication without obtaining specific professional advice.
No representation or warranty (express or implied) is made as to the accuracy or completeness of the information in this publication and, to the extent permitted by law, PricewaterhouseCoopers LLP, its members, employees and agents do not accept or assume any responsibility, liability or duty of care for the possible consequences of your or anyone else's action or failure to act in accordance with the information in this publication or for any decision based on it. PwC refers to a UK member firm and may sometimes refer to the PwC network. Our UK economics practice offers a wide range of services covering: market reform across a range of industry sectors (including energy, water, media and telecommunications, financial services, health and government services); competition policy, disputes and other investigations; analysis of economic, social and environmental impacts;
Our Women in Work Index is one of a number of related PwC labor market indices.
Jing Teow Senior Economist
Tara Shrestha Carney Economist
Jon Terry
Saloni Goel Economist
Alex Cooper Economist
Katy Bennett


