Este documento de trabajo cuantifica el comportamiento de la productividad laboral en España durante los últimos veinte años, analizando con especial atención el papel desempeñado por las tecnologías de la información y la comunicación (TIC). Utiliza las series de capital –publicadas recientemente por la Fundación BBVA– y su desglose sectorial, centrándose en las 26 ramas pertenecientes al sector privado no agrícola de la economía. Utilizando el método de contabilidad del crecimiento, se concluye que la economía española presenta notables ineficiencias, identificadas por la contribución negativa de la productividad total de los factores (PTF) al crecimiento de la productividad durante el período 1985-2004.
La decisión de la Fundación BBVA de publicar este documento de trabajo no implica responsabilidad alguna ni por su contenido ni por la inclusión de documentos o información complementaria proporcionada por los autores. No se permite la reproducción total o parcial de esta publicación, incluido el diseño de la portada, ni su incorporación a un sistema informático, ni su transmisión por cualquier forma o medio, ya sea electrónico, mecánico, reprográfico, fotoquímico, óptico. , grabación o de otro modo sin el consentimiento previo por escrito del titular de los derechos de autor. La serie Documentos de Trabajo, así como información sobre otras publicaciones de la Fundación BBVA, se pueden consultar en: http://www.fbbva.es.
Introduction
Data
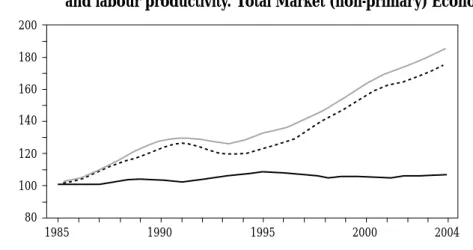
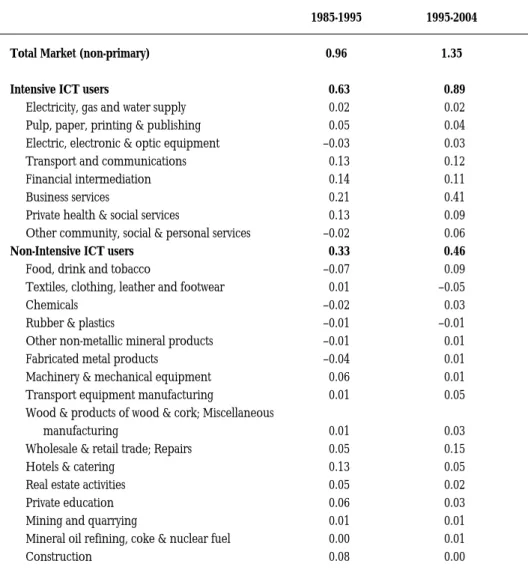
The first thing that stands out is the remarkable influence of the primary and non-market sectors on the performance of productivity in Spain. While the total gross value added showed a negative value of -0.29%, the contribution of the ICT-intensive cluster was positive (0.52), mainly due to transport and communication (0.20), financial intermediation (0.19 ) and electricity, gas and water supply (0.14). . In contrast, contributions from two of the sectors in this cluster (Business Services and Other Community, Social and Personal Services) were negative.
Finally, it is interesting to note that the positive contribution to the productivity of the ICT-intensive cluster is exactly compensated by the reduction (-0.52) shown by the Construction Industry. If we were to eliminate their negative contribution, labor productivity growth would be 0.67%, instead of the actual negative rate of -0.29% over the period 1995-2004. It is interesting to note that over the years 1995-2004 the contribution to the labor qualification index of the ICT-intensive cluster is almost twice as large as that of the non-intensive group (0.89 vs. 0.46 ).
The main contributors to the improvement of the labor qualification index belonged to the ICT-intensive ICT group, which outstanding Business Services (0.41); We consider these results of great relevance for the analysis of the ICT contribution to Spanish growth, which we now turn to in the next section. TFP gains should be observed mainly in the ICT-producing sector, as this is the sector where most of the real technological progress takes place.
It was the consequence of both, the worsening of the negative TFP contribution and a serious decrease in non-ICT capital. This is the result of a deepening of the recovery of non-ICT capital and the reduction of the inefficiencies captured by the TFP concept, which, although still making a negative contribution, was significantly reduced. The upswing is due to the positive behavior of the ICT-intensive cluster, which experienced labor productivity growth of 1.43%.
In contrast, the Non ICT Intensive cluster experienced a negative TFP growth rate (1.28%), along with moderate increases in the remaining sources of growth. Probably the most remarkable result of the Spanish experience in recent years is the negative contribution of TFP to economic growth. Higher ICT costs (the cost of accessing the Internet in Spain is double that of the US).
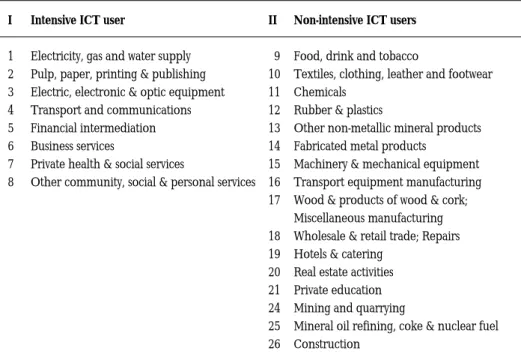
The macro-level results are derived from the aggregation of the twenty-six branches belonging to the market economy – excluding the primary sectors – and the two categories in which they are grouped according to their intensity in the use of ICT resources. Due to the lack of data, we have not been able to analyze the direct impact of the ICT manufacturing sector.
Aggregate Behaviour and Industries Dynamics
The Sources of Growth
Capital accumulation
The rate of accumulation of non-residential capital in Spain was quite strong during the period 1995-2004, with an average annual growth rate of 5.64%, almost one point higher than in the previous decade (4.85%). The growth rates of ICT capital almost doubled those of total capital, reaching 9.7% in both sub-periods. Non-ICT capital accumulation was more modest and stronger in the period 1995-2004 than in the previous period.
As expected, the accumulation of ICT capital has been concentrated in ICT-intensive industries, particularly in business services and financial intermediation. In the subperiod 1995-2004, more than 68% of the total ICT capital growth came from the ICT-intensive cluster.
Labour qualification
As a result of this remarkable change, the percentage of Spanish workers with at least a secondary education level more than doubled, rising from 38.7% in 1985 to 81.02% in 2004. We have constructed an index job skill synthetic index based on employment growth rates at each of the seven education levels, weighted by their relative wages 5. The index improves if highly educated workers gain weight in total employment, improving the composition of the labor force toward workers with higher qualifications.
This is the result of two complementary elements: a higher rate of employment creation and a simultaneous improvement in education, especially at the college level. These figures are in stark contrast to the contribution of each group to total employment growth, 1.25 ICT Intensive group vs.

Growth Accounting. 1995-2004
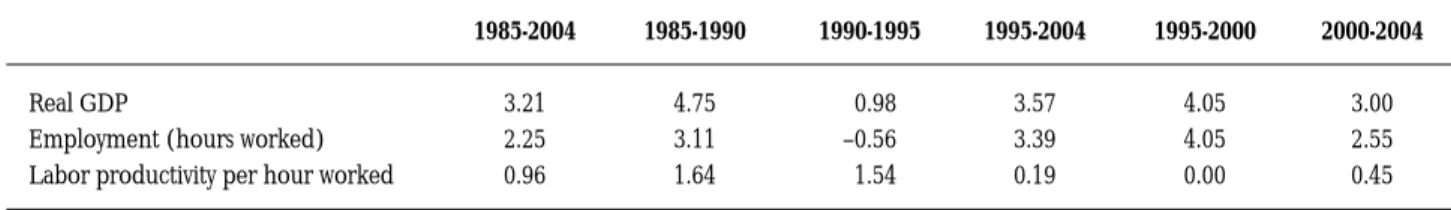
In the middle part it shows the decomposition of labor productivity as given by equation (5.7). This was mainly due to the strong impulse of job creation (3.03%), accompanied by improvements in its qualification (1.03%), as well as in increases in capital endowment (1.34%). This result can be interpreted in two ways: i) as a confirmation of the inability of Spain to take full advantage of the great improvements in workers' training and educational levels and ii) as evidence that - at least apparently - the quality of capital goods has not been used up by the productive system, which appears as an inefficiency factor.
Labor productivity again presented a negative growth rate (-0.29%) as a consequence of the negative behavior of TFP, while improvements in the capital/labor ratio (0.39) and in labor qualification (1.03) were positive. The contribution of ICT capital deepening to productivity growth (0.26) is twice that of non-ICT capital (0.13). When distinguishing between the two sub-periods, it is worth noting that the negative sign of labor productivity growth throughout the period originates in the first sub-period, 1995-2000.
In the Non ICT Intensive group, all branches presented negative TFP contributions with only one exception, fabricated metal products. This last industry, together with Financial Intermediation, were the only branches that showed negative contributions to the labor quality index; 3. Total capital deepening was particularly intensive in two industries belonging to the ICT Intensive group, Electricity, Gas and Water Supply, and Electrical, Electronic and Optical Equipment; and negative has been only in two branches belonging to the non-ICT intensive group, Fabricated Metal Products and Real Estate Activities.
Finally, financial intermediation was by far the sector that showed the largest contribution of the deepening of ICT capital to labor productivity growth. Relatively small share of ICT investments in total investments (this ratio was lower in Spain than in the US in 2000). Very poor technical education and training (in 2003, more than 70% of the Spanish population stated that they could not use technological tools/equipment and more than 60% computers. For the EU, the corresponding percentages were 50% and 40% respectively); 5.
Low use of ICT in schools (in 2002 only 70% of Spanish schools used the Internet for educational purposes, while in the EU the percentage was 80%, and in Finland, Sweden and Denmark 100%).

Conclusions
A late start – as illustrated by the evidence given in the previous section – is perhaps one of the main reasons for not yet finding clear evidence of productivity growth driven by ICT technologies. "Productivity Slowdown, Measurement Issues, and the Computing Power Explosion," Brookings Papers on Economic Activity, Vol. VANARK(eds.) (2003): Productivity and competitiveness of the EU: an industry perspective, European Commission. 2004): “Multifactor productivity measurement when rates of return are exogenous”, paper presented at the SSHRC International Conference on Index Number Theory and the Measurement of Prices and Productivity, Vancouver, June 30-July 3.
TIMMER(2004): “Computers and the Big Divide: Productivity Growth in the European Union and the United States” in M. A lecturer in economic analysis at the same university and senior researcher at the Instituto Valenciano de Investigaciones Económicas (Ivie), her specialized fields are growth economics and the analysis of technological change and public capital and regional economics. She visited numerous research centers and published nineteen books and more than thirty articles in Spanish and international specialist journals.
He is a professor of economic analysis at the University of Valencia and also a senior researcher at the Instituto Valenciano de Investigaciones Económicas (Ivie). He visited many research centers and published four books and more than forty articles in Spanish and international professional journals. An earlier and more detailed version of this paper was published as Chapters 7 and 8 of Las Nuevas Tecnologías y el Crecimiento Económico en España (New Technologies and Economic Growth in Spain), edited by the BBVA Foundation, whose support is gratefully acknowledged.
Agradecemos a Francisco Pérez y Paul Schreyer, así como a los participantes en el taller de la OCDE sobre medición de la productividad celebrado en Madrid (octubre de 2005), por sus útiles comentarios. DT 01/02 Desempleo y trampa educativa: un análisis de las relaciones entre los efectos desincentivadores de las prestaciones del Estado de Bienestar y la educación. DT 04/02 La reforma del IRPF y los determinantes de la oferta de trabajo en la familia española.
DT 05/03 Retraso, eficiencia y costes: Cómo ayudar a que la imagen de la justicia se corresponda mejor con la realidad. DT 07/05 El nuevo modelo monetario keynesiano: ¿muestra movimiento entre producción e inflación en EE.UU. DT 01/06 El efecto de la inmigración en las oportunidades de empleo de los trabajadores nacionales: evidencia para España.