The neutrinoless double beta decay experiment
M. Sorel (IFIC - CSIC & U. Valencia)
XLII International Meeting on Fundamental Physics Benasque (Spain), January 2013
1
a next
Outstanding questions about neutrinos
Identity Mass scale Mass ordering
Mixing Species
Dirac or Majorana fermion?
What is the neutrino mass value?
Normal or inverted?
Is CP symmetry violated in the neutrino sector?
Are there light sterile neutrinos?
Neutrinoless double beta decay
3
Double beta decay
n1
n2
e-
e- ν̅
ν̅
ββ2ν
n1 n2
e- e-
ββ0ν
ν ν• Rare (Z,A)→(Z+2,A) nuclear transition, with emission of two electrons
• Two basic decay modes
Two neutrino mode
•
Observed in several nuclei•
Neutrinoless mode
•
Not observed yet in Nature•
Neutrinoless double beta decay and the neutrino questions
5
Lepton number violating process implying massive Majorana neutrinos
Identity Mass scale
Mass ordering Mixing
Species
dL uL
W
W
e−L
e−L
dL uL
ν
(eV)
light
m
10-4 10-3 10-2 10-1 1
(eV) ``m
10-3
10-2
10-1
1
Inverted ordering
Normal ordering ν1
ν2
ν3
ν1
ν2
ν3
Majorana ν mass:
mββ ≡ ⎜∑i mi Uei2⎜ (Rate)ββ0ν ∝ mββ2
State with e mass mi
μτ
|Uei|2
Measure mββ
constrain mlight
e- e-
The ββ0ν landscape around 2008
•
Field “rejuvenated” by neutrino mass discovery!•
Controversial claim for ββ0ν discovery in 76Ge (Klapdor et al.) sets current-generation goal:➩ultra-low background, 100 kg-scale experiments
•
Realization that 136Xe experiments may be as/more competitive than 76Ge and 130Te ones
100 meV mass 1026 yr half-life sensitivity
Ge
Historical progress
Publication Date
1960 1970 1980 1990 2000 2010 2020 2030
eV
10-1
1 10
102 m(!) limit
76Ge
136Xe
130Te
100Mo
NME: RQRPA, Phys.Rev.C 79, 055501 (2009)
Klapdor
2008
Ge
32
76 13052
Te
7
•
Time Projection Chamber with 100 kg of high-pressure 136Xe gas•
2008-2013: R&D phase with 1 kg-scale prototypes at home institutions•
2014-2016: 10 kg detector at LSC•
2016-2020: full 100 kg detector at LSC•
Goal: push discovery reach for ββ0ν down to 100 meV Majorana neutrino massesNEXT experiment
at the LSC
Laboratorio Subterráneo de CanfrancLSC a next
APPROVED AND FULLY FUNDED
COMPLETED
APPROVED AND SUBSTANTIALLY FUNDED
The NEXT Collaboration
IFIC Valencia • Zaragoza • Politécnica Valencia • Santiago de Compostela • Autónoma Madrid • Girona
LBNL • Iowa State • Texas A&M Coimbra • Aveiro JINR A. Nariño
NEXT detection concept
9
NEXT detection concept
ENERGY PLANE (PMTs) TRACKING PLANE (SiPMs)
CATHODE ANODE
scintillation (S1)
e-
e- e- e- e-
e-
electroluminescence (S2)
xenon gas
TPB coated surfaces
ionization
NEXT detection concept
10
Use a xenon gas TPC (10-15 bar) Idea #1:
ENERGY PLANE (PMTs) TRACKING PLANE (SiPMs)
CATHODE ANODE
scintillation (S1)
e-
e- e- e- e-
e-
electroluminescence (S2)
xenon gas
TPB coated surfaces
ionization
NEXT detection concept
Idea #2:
Use electroluminescence (EL) as a
linear amplification stage for ionization Use a xenon gas TPC (10-15 bar)
Idea #1:
ENERGY PLANE (PMTs) TRACKING PLANE (SiPMs)
CATHODE ANODE
scintillation (S1)
e-
e- e- e- e-
e-
electroluminescence (S2)
xenon gas
TPB coated surfaces
ionization
NEXT detection concept
10
Idea #2:
Use electroluminescence (EL) as a
linear amplification stage for ionization Idea #3:
EL used for separated energy and tracking measurements
Use a xenon gas TPC (10-15 bar) Idea #1:
ENERGY PLANE (PMTs) TRACKING PLANE (SiPMs)
CATHODE ANODE
scintillation (S1)
e-
e- e- e- e-
e-
electroluminescence (S2)
xenon gas
TPB coated surfaces
ionization
NEXT detection concept
Idea #2:
Use electroluminescence (EL) as a
linear amplification stage for ionization Idea #3:
EL used for separated energy and tracking measurements
Idea #4:
Energy sensors detect also primary scintillation for t0 determination
Use a xenon gas TPC (10-15 bar) Idea #1:
ENERGY PLANE (PMTs) TRACKING PLANE (SiPMs)
CATHODE ANODE
scintillation (S1)
e-
e- e- e- e-
e-
electroluminescence (S2)
xenon gas
TPB coated surfaces
ionization
NEXT detection concept
10
Idea #2:
Use electroluminescence (EL) as a
linear amplification stage for ionization Idea #3:
EL used for separated energy and tracking measurements
Idea #4:
Energy sensors detect also primary scintillation for t0 determination
170 ➞430 nm light with TPB waveshifter Idea #5:
Use a xenon gas TPC (10-15 bar) Idea #1:
ENERGY PLANE (PMTs) TRACKING PLANE (SiPMs)
CATHODE ANODE
scintillation (S1)
e-
e- e- e- e-
e-
electroluminescence (S2)
xenon gas
TPB coated surfaces
ionization
NEXT detection concept
Idea #2:
Use electroluminescence (EL) as a
linear amplification stage for ionization Idea #3:
EL used for separated energy and tracking measurements
Idea #4:
Energy sensors detect also primary scintillation for t0 determination
Use a xenon gas TPC (10-15 bar) Idea #1:
Concept fully validated with prototypes Strengths:
ENERGY PLANE (PMTs) TRACKING PLANE (SiPMs)
CATHODE ANODE
scintillation (S1)
e-
e- e- e- e-
e-
electroluminescence (S2)
xenon gas
TPB coated surfaces
ionization
11
1 kg
R&D
(2008-2013)
NEXT R&D goals
ENERGY PLANE (PMTs) TRACKING PLANE (SiPMs)
CATHODE ANODE
scintillation (S1) e- e- e-
e- e-
e-
electroluminescence (S2)
Energy plane Tracking plane
Reflector panels
Field cage
•
Realize innovative detector concept at 1 kg-scale•
Choose technological solutions•
Quantify detector performancePressure vessel
EL grids
NEXT R&D: detector
performance achievements
13 Energy (keV)
0 100 200 300 400 500 600
Entries/bin
0 500 1000 1500 2000 2500 3000 3500
a next
•
1.8% FWHM energy resolution for 511 keV electrons over large fiducial volume•
Extrapolates to 0.8% FWHM at Qββenergy of 136Xe decay
•
Requires mapping energy response in plane perpendicular to drift fieldX (mm)
-80 -60 -40 -20 0 20 40 60 80
Y (mm)
-80 -60 -40 -20 0 20 40 60
80 Charge (pe/PMT)
9000 9200 9400 9600 9800 10000 10200 10400
511 keV gammas in NEXT-DEMO [NEXT Coll., JINST 8 (2013) P09011]
X-ray escape Compton
X-ray
Photoelectric
a next
SiPM information only SiPM plus PMT information
•
Higher energy deposition clearly visible at electron track end-point662 keV electron in NEXT-DEMO [NEXT Coll., JINST 8 (2013) P09011]
NEXT R&D: detector
performance achievements
15
10 kg
1 kg
R&D ββ2ν
(2008-2013) (2014-2016)
NEXT-NEW 10 kg detector at LSC: main features
Pressure vessel:
stainless steel, 30 bar max pressure Time Projection Chamber:
10 kg active region, 50 cm drift length
Energy plane:
12 PMTs, 30% coverage Tracking plane:
1,800 SiPMs, 1 cm pitch
17
•
Is radiopure•
Is operated underground•
Uses enriched xenon (136Xe)•
Comfortably contains O(MeV) electrons➪ new opportunities!
First NEXT detector that:
NEXT-NEW 10 kg detector at LSC: goals
18
•
Is radiopure•
Is operated underground•
Uses enriched xenon (136Xe)•
Comfortably contains O(MeV) electrons➪ new opportunities!
First NEXT detector that:
NEXT-NEW 10 kg detector at LSC: goals
x (mm) -80 -60 -40 -20 0 20 40 60 80
y (mm)
-80 -60 -40 -20 0 20 40 60 80
Energy (MeV)
0 0.02 0.04 0.06 0.08 0.1
ββ simulated event in NEXT 0.12
31
Counts / 20 keV
20 40 60 80 100 120 140
160 (a)
Energy (keV)
1000 1500 2000 2500 3000 3500
Norm. Residuals -4
-2 0 2
4 (b)
Standoff Distance (mm)
0 50 100 150 200
Counts / 10 mm 200
400 600
FIG. 27. (Color online) Projected MS energy spectra (a) and corresponding MS standoff distance distribution (inset) for the final fit results. Residuals are shown in (b). PDF compo- nents are as in fig. 26.
21 yr) 10
×
1/2 ( T β β ν 2
1 1.5 2 2.5 3
EXO-200 (this work) KamLAND-Zen (2012) EXO-200 (2011)
FIG. 28. A comparison of this result with EXO-200 (2011) [3], and KamLAND-Zen (2012) [37].
pected backgrounds from β-decays under the 2νββ spec- trum. Increasing the energy threshold would change the relative contribution of any potential background, which would manifest as a change in the fit number of 2νββ events. The results of this study are shown in fig. 29, demonstrating that the 2νββ measured rate is stable un- der even large changes of threshold.
Energy threshold (keV) 600 800 1000 1200 1400 1600 1800 2000
counts / Effν2ββ
30000 32000 34000 36000 38000 40000 42000
FIG. 29. (Color online) The fit count rate divided by efficiency of 2νββ versus energy threshold. The main result is the (red, online) triangle at 700 keV.
X. CONCLUSIONS
We have reported on an improved measurement of the 2νββ decay of 136Xe using 127.6 days of live-time col- lected between Sept 2011 and April 2012. The result- ing half-life T2νββ1/2 = 2.165 ± 0.016(stat) ± 0.059(sys) · 1021 years is measured with a total relative uncertainty of 2.83% and is dominated by systematic uncertainties.
This half-life corresponds to a nuclear matrix element of M2ν = 0.0218 ± 0.0003 MeV−1, the smallest among the isotopes measured to date. For comparison, in table IX we have tabulated the most precise half-life measurement of all nine nuclei for which 2νββ decay has been directly observed. The corresponding matrix elements M2ν are included in this table as well. We note that 136Xe has both the longest 2νββ half-life of any such decay, and, as reported in this article, the most precise measurement.
We have described in some detail the data analysis methods used for this measurement. These methods are similar to those employed to search for the 0νββ decay that, if observed, would indicate the discovery of new physics beyond the Standard Model. While the level of precision achieved here is not required for the 0νββ decay search, it demonstrates the quality of the EXO-200 data and the power of a fully active, high resolution tracking detector with very low background.
Since April 2012 EXO-200 has accumulated an expo- sure several times larger than that described here. We expect to report the results of a new search for 0νββ based on this larger dataset in the near future.
ACKNOWLEDGMENTS
EXO-200 is supported by DOE and NSF in the United States, NSERC in Canada, SNF in Switzerland, NRF in Korea, RFBR (12-02-12145) in Russia and DFG Clus- ter of Excellence “Universe” in Germany. EXO-200 data NEXT (2015)?
EXO Coll., arXiv:1306.6106
•
ββ2ν half-life measurement•
Understand ββ topology•
Understand ββ0ν backgrounds Goals:NEXT-NEW status
•
All detector components designed•
Some components already delivered and being tested•
Detector integration and commissioning at IFIC during 2014•
Detector operating at LSC starting on Feb, 2015Pressure vessel
Tracking plane board
20
100 kg
10 kg
1 kg
R&D ββ2ν ββ0ν (100 meV)
(2008-2013) (2014-2016) (2016-2020)
21 4
counts /20keV
10-2
10-1
1 10 102
103
MS
energy (keV)
1000 1500 2000 2500 3000 3500
counts /20keV
10-2
10-1
1 10 102
103
SS
FIG. 4: MS (top) and SS (bottom) energy spectra. The best fit line (solid blue) is shown. The background com- ponents are 2νββ (grey region), 40K (dotted orange), 60Co (dotted dark blue), 222Rn in the cryostat-lead air-gap (long- dashed green), 238U in the TPC vessel (dotted black), 232Th in the TPC vessel (dotted magenta), 214Bi on the cathode (long-dashed cyan), 222Rn outside of the field cage (dotted dark cyan),222Rn in active xenon (long-dashed brown),135Xe (long-dashed blue) and54Mn (dotted brown). The last bin on the right includes overflows (none in the SS spectrum).
counts /20keV
0 5 10 15 20 25 30
35 MS
energy (keV)
2000 2200 2400 2600 2800 3000 3200
counts /20keV
0 2 4 6 8
SS
FIG. 5: Energy spectra in the136XeQββ region for MS (top) and SS (bottom) events. The 1 (2)σ regions around Qββ are shown by solid (dashed) vertical lines. The 0νββ PDF from the fit is not visible. The fit results have the same meaning as in Figure 4.
loss of efficiency for γ- and β-like events. Cosmic-ray in- duced backgrounds are removed using three time-based cuts. Events preceded by a veto hit within 25 ms are re- moved (0.58% dead time). Events occurring within 60 s after a muon track in the TPC are also eliminated (5.0%
dead time). Finally, any two events that occur within 1 s of each other are removed (3.3% dead time). The combi- nation of all three cuts incurs a total dead time of 8.6%.
The last cut, combined with the requirement that only one scintillation event per frame is observed, removes β- α decay coincidences due to the time correlated decay of the 222Rn daughters 214Bi and 214Po. Alpha spectro- scopic analysis finds 360±65 µBq of222Rn in theenrLXe, that is constant in time.
The SS and MS low background spectra are shown in Figure 4. Primarily due to bremsstrahlung, a fraction of ββ events are MS. The MC simulation predicts that 82.5% of 0νββ events are SS. Using a maximum like- lihood estimator, the SS and MS spectra are simultane- ously fit with PDFs of the 2νββ and 0νββ of 136Xe along with PDFs of various backgrounds. Background models were developed for various components of the detector.
Results of the material screen campaign, conducted dur- ing construction, provide the normalization for the mod- els. The contributions of the various background com- ponents to the 0νββ and 2νββ signal regions were esti- mated using a previous generation of the detector simula- tion [8]. For the reported exposure, components found to contribute < 0.2 counts (0νββ) and < 50 counts (2νββ), respectively, were not included in the fit. For the current exposure, the background model treats the activity of the
222Rn in the air-gap between the cryostat and the lead shielding as a surrogate for all 238U-like activities exter- nal to the cryostat, because of their degenerate spectral shapes and/or small contributions. A possible energy off- set and the resolution of theγ-like spectra are parameters in the fit and are constrained by the results of the source calibrations. The fraction of events that are classified as SS for each of the γ-like PDFs is constrained within
±8.5% of the value predicted by MC. This uncertainty is set by the largest such deviation measured with the source calibration spectra. The SS fractions for β- and ββ-like events are also constrained in the fit to within
±8.5% of the MC predicted value. As a cross-check, the constraint on the 2νββ SS fraction is released in a sep- arate fit of the low background data. The SS fraction is found to agree within 5.8% of the value predicted by the MC simulation.
The ββ energy scale is a free parameter in the fit, so that it is constrained by the 2νββ spectrum. The fit re- ports a scale factor of 0.995 ±0.004. The uncertainty is inflated to ±0.006 as a result of an independent study of the possible energy scale differences between γ- and ββ- like energy deposits. The 2νββ PDF is produced using the Fermi function calculation given in [16]. Tests using a slightly different spectral form [17] were performed and
3
Visible Energy (MeV)
1 2 3 4
Events/0.05MeV
10-1
1 10 102
103
104
105 (a) DS-1 + DS-2 238U Series
Th Series
232 210Bi
85Kr
208Bi
88Y
110mAg External BG Spallation Data
Total
!
!
"
136Xe 2 Total
U.L.)
!
!
"
(0
!
!
"
136Xe 0
(90% C.L. U.L.)
Visible Energy (MeV)
2.2 2.4 2.6 2.8 3
Events/0.05MeV
-5 0 5 10 15 20 25 30 35 40 (b)
208Bi
88Y
110mAg Data
Total Total
U.L.)
!
!
"
(0
!
!
"
136Xe 0
(90% C.L. U.L.)
FIG. 1: (a) Energy spectrum of selected candidate events together with the best-fit backgrounds and2νββ decays, and the 90% C.L.
upper limit for0νββdecays, for the combined data from DS-1 and DS-2; the fit range is0.5 < E <4.8 MeV. (b) Closeup of (a) for 2.2< E <3.0 MeVafter subtracting known background contribu- tions.
their activity appears to increase proportionally with the area of the film welding lines. This indicates that the dominant IB backgrounds may have been introduced during the welding process from dust containing both natural U and Fukushima fallout contaminants. The activity of the214Bi on the IB drives the spherical fiducial radius in the analysis.
In the combined DS-1 and DS-2 data set, a peak can also be observed in the IB backgrounds located in the0νββ window on top of the 214Bi contribution, similar in en- ergy to the peak found within the fiducial volume. To ex-
spectively, where the uncertainties include the uncertainty in the IB position.
The energy spectra of selected candidate events for DS-1 and DS-2 are shown in Fig. 1. The ββ decay rates are estimated from a likelihood fit to the binned energy spec- trum between 0.5 and 4.8 MeV for each data set. The back- ground rates described above are floated but constrained by their estimated values, as are the detector energy response model parameters. As discussed in Ref. [2], contributions from110mAg (β−decay,τ = 360day,Q= 3.01MeV),88Y (EC decay, τ = 154day, Q= 3.62MeV), 208Bi (EC de- cay, τ = 5.31×10⁵yr, Q= 2.88MeV), and 60Co (β− de- cay,τ = 7.61yr,Q= 2.82MeV) are considered as potential background sources in the0νββ region of interest. The in- creased exposure time of this data set allows for improved constraints on the identity of the background due to the differ- ent lifetimes of the considered isotopes. Fig. 2 shows the event rate time variation in the energy range2.2< E < 3.0 MeV, which exhibits a strong preference for the lifetime of110mAg, if the filtration is assumed to have no effect. Allowing for the
110mAg levels between DS-1 and DS-2 to float, the estimated removal efficiency of110mAg is(1±19)%, indicating that the Xe-LS filtration was not effective in reducing the background.
In the fit to extract the 0νββ limit we include all candidate sources in the Xe-LS, considering the possibility of composite contributions and allowing for independent background rates before and after the filtration.
The best-fit event rate of 136Xe 2νββ decays is 82.9± 1.1(stat) ± 3.4(syst)(ton·day)−1for DS-1, and 80.2 ± 1.8(stat)±3.3(syst)(ton·day)−1for DS-2. These results are consistent within the uncertainties, and both data sets indicate a uniform distribution of the Xe throughout the Xe-LS. They are also consistent with EXO-200 [3] and that obtained with a smaller exposure [4], which requires the FV cutR <1.2 mto avoid the large134Cs backgrounds on the IB, more appropri-
Event/Day/Ton
0.1 0.2
0.3 DS-1 DS-2
= 2.22
#2 110mAg,
= 8.06
#2
Bi,
208
= 10.16
#2
Y,
88
2025 2030 2035 2040 2045 2050 2055 2060
counts/keV
0 1 2
3 GERDA 13-07
energy [keV]
1900 1950 2000 2050 2100 2150 2200
counts/(2 keV)
0 2 4 6 8
Bi 2204 keV214
1930 keV 2190 keV2039 keV !!Q
background interpolation
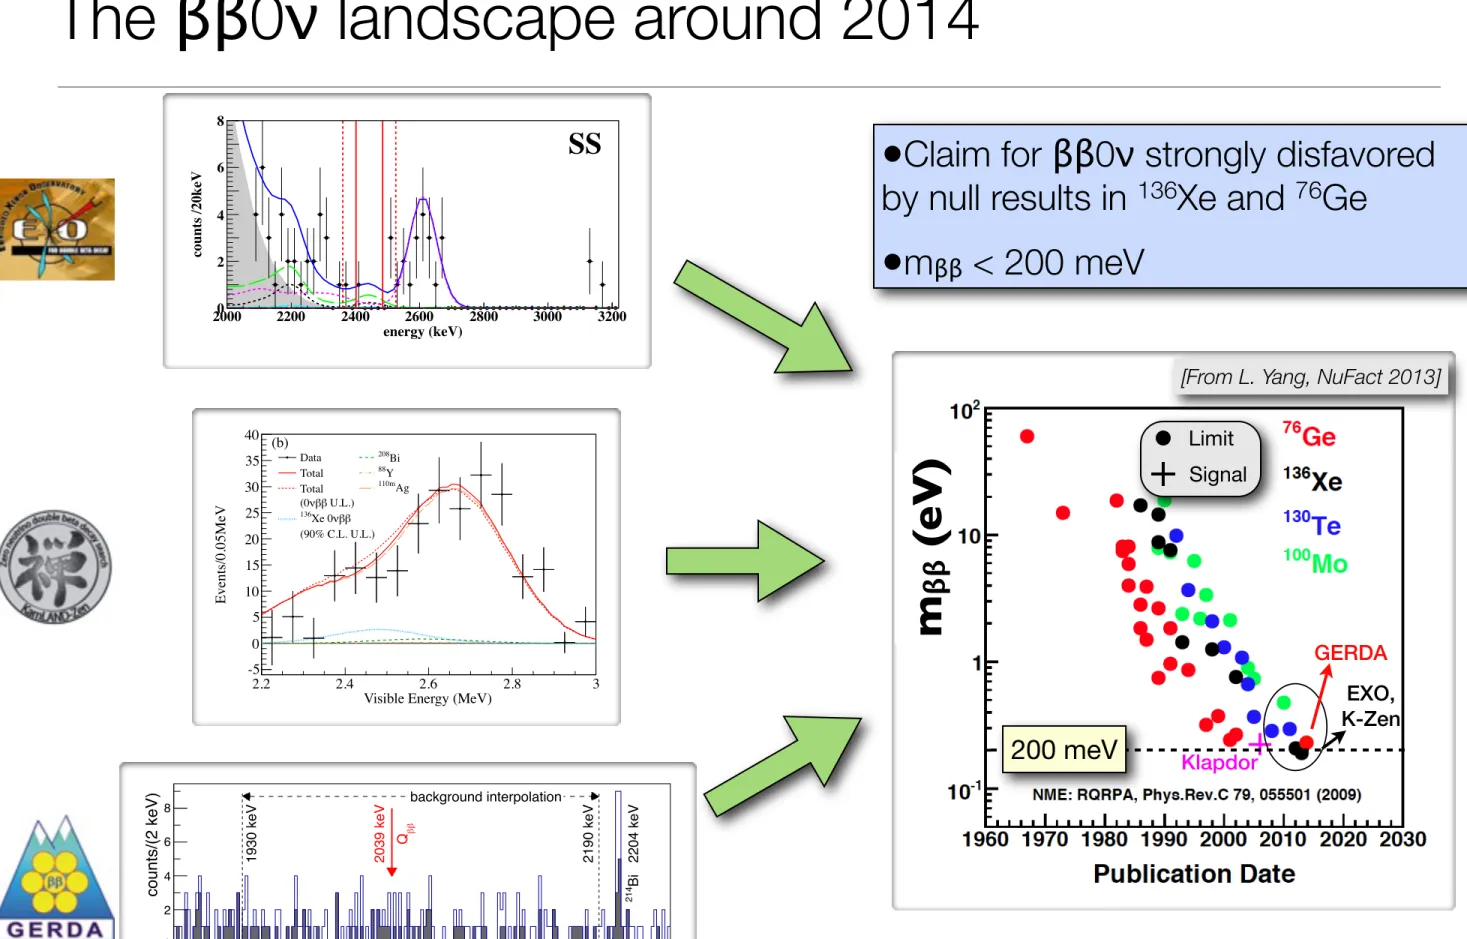
The ββ0ν landscape around 2014
•
Claim for ββ0ν strongly disfavored by null results in 136Xe and 76Ge•
mββ < 200 meVAdapted from C. Hall - Lepton Photon, June 2013 6
GERDA EXO, K-Zen Klapdor
m
ββ(eV)
[From L. Yang, NuFact 2013]
Limit Signal
200 meV
NEXT 100 kg detector at LSC: main features
22
Pressure vessel:
stainless steel,15 bar max pressure
Inner shield:
copper, 12 cm thick Time Projection Chamber:
100 kg active region, 130 cm drift length
Outer shield:
lead, 20 cm thick Energy plane:
60 PMTs, 30% coverage
Tracking plane:
7,000 SiPMs, 1 cm pitch
NEXT 100 kg detector at LSC:
projected performance
Background model:
•
Activities from material screening - joint NEXT+LSC effort•
Signal efficiency and background rejection factors from simulationsBackgrounds at Qββ=2.458 MeV: gammas from 208Tl and 214Bi:
Component Estimated backgrounds [10-4 cts/(kg⋅keV⋅yr)]
Pressure vessel 0.2
Field cage 0.4
Energy plane 3.1
Qββ
Total
214Bi
208Tl
Entries / (bin⋅sec) MC
NEXT 100 kg detector at LSC:
projected performance
24
Background model:
•
Activities from material screening - joint NEXT+LSC effort•
Signal efficiency and background rejection factors from simulations•
100 meV sensitivity after 5 years2012 JINST 7 T06001
100 200 300 400 500 600 700 800 900 1000
40 60 80 100 120 140 160 180
100 kg 150 kg
m ββ(meV)
exposure (kg year)
Figure 22. Sensitivity (at 90% CL) of NEXT-100 to the effective neutrino Majorana mass mββ, computed following the method described in [10]. The solid, blue line corresponds to the baseline scenario where 100 kg of enriched xenon are used, whereas the dashed, red line shows the sensitivity of the detector with 150 kg of source mass.
array of MPPCs) and calorimetry (an array of PMTs). Such a design provides both optimal energy resolution and event topological information for background rejection.
The expected background rate is 8×10⁻⁴ counts/(keV·kg·y); this results in a sensitivity (see figure 22), after 5 years of data-taking, of about 5.9×1025 years or, in terms of mββ, better than 100 meV.
NEXT-100 is approved for operation in the Laboratorio Subterr´aneo de Canfranc (LSC), in Spain. The installation of shielding and ancillary systems will start in the second half of 2012. The assembly and commissioning of the detector is planned for early 2014.
Acknowledgments
The NEXT Collaboration acknowledges support from the following agencies and institutions: the Spanish Ministerio de Econom´ıa y Competitividad under grants CONSOLIDER-Ingenio 2010 CSD2008-0037 (CUP), FPA2009-13697-C04-04 and RYC-2008-03169; the Portuguese Founda- tion for Science and Technology under grant PTDC/FIS/112272/2009 (“High Pressure Xenon Doped Mixtures for NEXT Collaboration”); the European Commission under the European Re- search Council Starting Grant ERC-2009-StG-240054 (T-REX) of the IDEAS program of the 7th EU Framework Program; and the Director, Office of Science, Office of Basic Energy Sciences,
– 30 –
NEXT Coll., JINST 7 (2012) T06001
100 kg 1 ton?
10 kg
1 kg
R&D ββ2ν ββ0ν (100 meV) ββ0ν (15 meV)
(2008-2013) (2014-2016) (2016-2020) (2020+)
Short-term prospects to measure neutrinoless double beta decay
26
Possible, but unlikely, that current-
generation experiments will discover ββ0ν
(eV)
light
m
10-4 10-3 10-2 10-1 1
(eV) ``m
10-3
10-2
10-1
1 ββ0ν limit
(EXO, KamLAND-Zen, GERDA)
Adapted from C. Hall - Lepton Photon, June 2013 6
GERDA EXO, K-Zen Klapdor
m
ββ(eV)
[From L. Yang, NuFact 2013]
∑m i <0.23-0.66 eV
100 meV sensitivity
Inverted ordering
Normal ordering
Limit Signal
Cosmology limit (Planck)
Goal for next-generation (2020+) experiments:
15 meV Majorana neutrino mass sensitivity
(eV)
light
m
10-4 10-3 10-2 10-1 1
(eV) ``m
10-3
10-2
10-1
1 ββ0ν limit
(EXO, KamLAND-Zen, GERDA)
Adapted from C. Hall - Lepton Photon, June 2013 6
GERDA EXO, K-Zen Klapdor
m
ββ(eV)
[From L. Yang, NuFact 2013]
Inverted ordering
Normal ordering
Limit Signal
15 meV sensitivity
Cosmology limit (Planck)
Toward a xenon gas time projection chamber at the ton-scale
28
Isotope Q-value (MeV)
Phase space G0ν (yr-1 eV-2)
Matrix element
|M0ν|
Isotopic abundance (%)
Indicative cost (normalized to 76Ge)
Current experiments
76Ge 2.04 3.0×10⁻²⁶ ≈4.1 7.8 1 GERDA,
Majorana
130Te 2.53 2.1×10⁻²⁵ ≈3.6 33.8 0.2 CUORE, SNO+
136Xe 2.46 2.3×10⁻²⁵ ≈2.8 8.9 0.1 EXO, KamLAND-
Zen, NEXT
1/T
1/20ν= G
0ν⋅ ⎜ M
0ν⎜
2⋅ m
ββ2The higher, the better The lower, the better
atomic, nuclear, particle physics
Two-three ton-scale ββ0ν experiments very likely to be built (2020+), but... which technology?
Toward a xenon gas time projection chamber at the ton-scale
Two-three ton-scale ββ0ν experiments very likely to be built (2020+), but... which technology?
ν
ν
ν
[From O. Cremonesi, M. Pavan, arXiv:1310.4692]
Exposure [ββ moles ⋅ yr]
Xenon experiments
Finite backgr
ound
Zero backgr
ound
Background requirements
30
years)
⋅ Exposure (ton
10-1 1 10
(meV) ββm
10 102
Inverted ordering,
mlight∼0
10 bgr counts/(ton
⋅yr)
1
0.1 bgr fr
ee NEXT
Goal:
15 meV
•
Ton-scale detector is necessary but not sufficient requirement to reach 15 meV•
First need to build and operate NEXT to fully understand backgrounds!•
Will likely also need 1-2 orders of magnitude background reduction compared to NEXT!(Rate)
ββ0ν∝ m
ββ2≡ ⎜ ∑
im
iU
ei2⎜
2Summary
• Neutrinoless double beta decay: unique tool to answer fundamental questions
• Xenon-based experiments providing best ββ0ν constraints to date
• NEXT high-pressure xenon gas TPC concept may outperform EXO and KamLAND-Zen thanks to excellent energy resolution and tracking
• NEXT timeline and goals:
100 kg1 ton?
10 kg
1 kg

![Figure 22. Sensitivity (at 90% CL) of NEXT-100 to the effective neutrino Majorana mass m ββ , computed following the method described in [10]](https://thumb-us.123doks.com/thumbv2/123dok_es/12380550.0/31.1536.1126.1524.233.474/figure-sensitivity-effective-neutrino-majorana-computed-following-described.webp)
