Objectives and Methodology
Project objectives
We apply the previously defined theoretical concepts to a real example (product knowledge, time measurement, operating balance and plant distribution).
Methodology used
Theoretical framework. Study of the organization of production
Organization and management of production systems
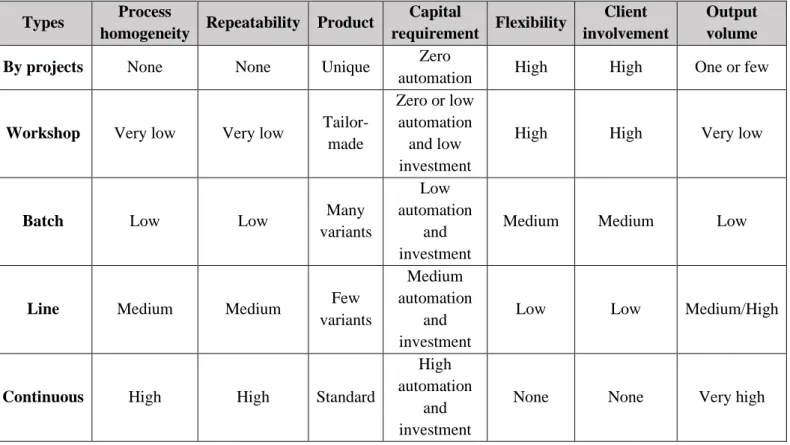
- Productive system types
The degree of participation of the customer or suppliers in the production, which is especially important in the case of services. In this way, most of the productive systems can be classified according to this chart:.

Design of the productive process
- Methods analysis
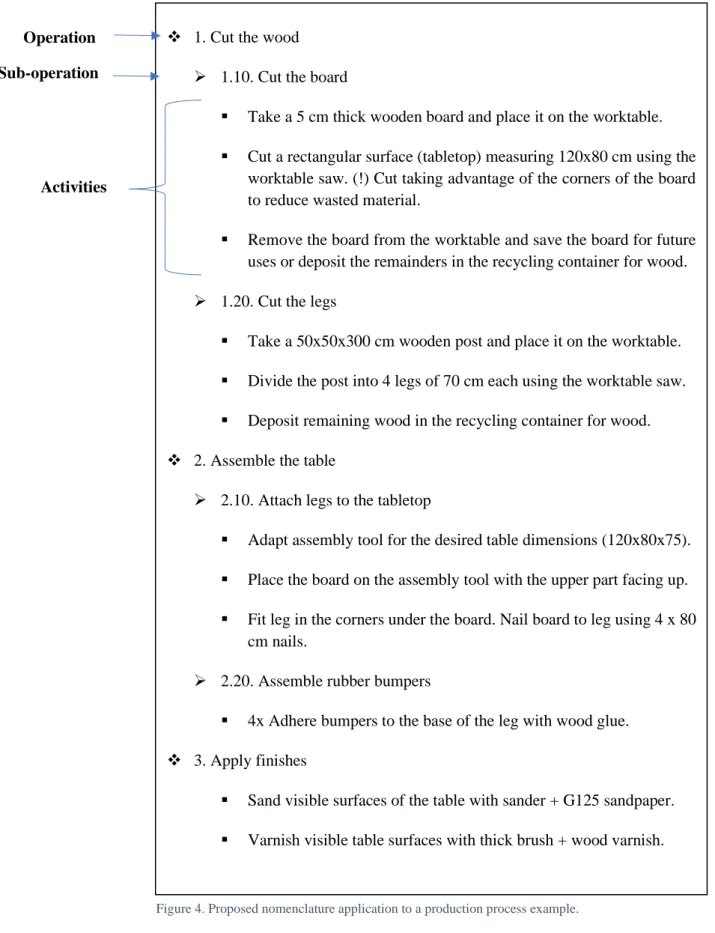
- Operations description
Method analysis is a recurring task that must be performed with production development. As seen in the wooden table example (Figure 3), the actions will be broken down into sub-operations which will also be grouped into operations.
Time study
- Time study stages
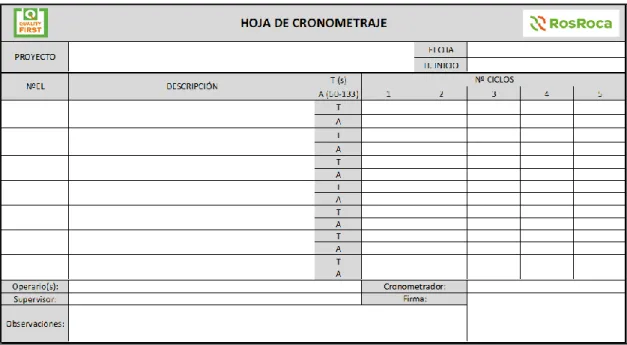
- Timing
- Timing units
- Activity factor
- Number of observations
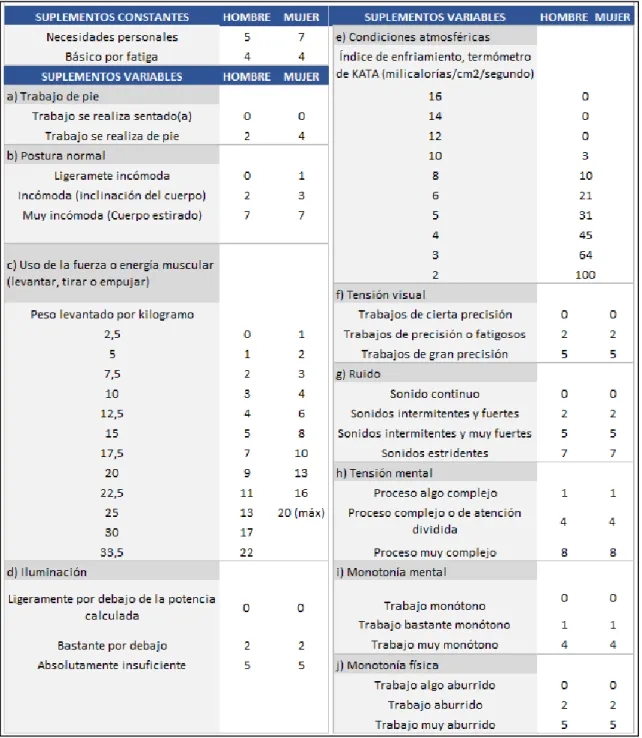
- Supplementary times
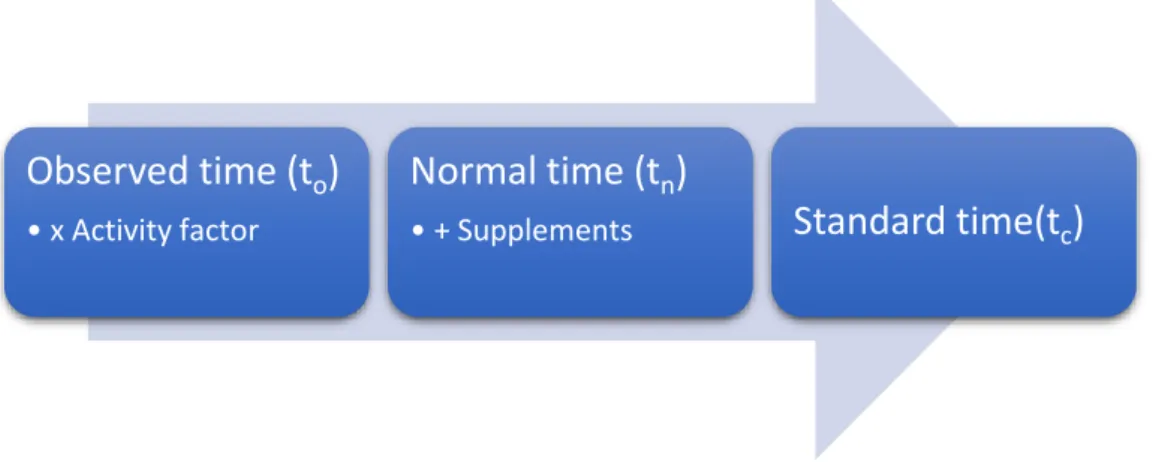
- Standard time
- MTM method
All data related to the circumstances in which the work is carried out, the methods and activity in carrying out the action to be set in time must be recorded. Additional times include all other times that are equally necessary for the execution of the task. It applies to unavoidable cases of leaving work to go drink, wash or go to the toilet.
As can be observed from the table, most of the recovery coefficients can be avoided by improving working conditions. Until now, the study of times based on the observation and control of the work done has been proposed.
Assembly line balancing
- Determination of line capacity
- Operations assignment to workstations
If we subtract the estimated theoretical time for the production of the product from this real time, previously calculated from the sum of the standard times of its operations, we get the total idle time or non-productive time (Tw):. The goal of line balancing is to reduce this idle time as much as possible so that the stations are balanced and adapt as much as possible to the desired cycle time. The sum of the execution times of the operations assigned to the station must not exceed the cycle time, otherwise the result would deviate from the desired production capacity.
For each operation, the times of the different operations are then added and the one with the highest total is selected. Following one of the rules for convenience, the unproductive time remaining after the initial operation order is checked and an attempt is made to cover the idle time with one of the remaining operations that meets the aforementioned requirements without exceeding the cycle time .

Sizing and plant distribution
- Production distribution styles
- Necessary surface calculation
The number of machines of each type will depend on the desired production, in such a way as to achieve the most possible continuous flow and avoid excessive stocks. It is also possible to combine the functional and online distribution types; this type of distribution is called mixed. Design of the productive process 1) Establish breakdown of processes, their dependencies and required materials, as well as .. number of operators and dedicated operating hours.
With the total area required per station, and after defining the number of stations required for production, the total area dedicated to the assembly area can be calculated as a product of these two factors. Finally, in collaboration with the logistics department, it will be necessary to define the space for materials, fasteners and auxiliary materials in general, with associated security storage, if necessary, and an area for storage of the finished product, if it cannot be released directly.

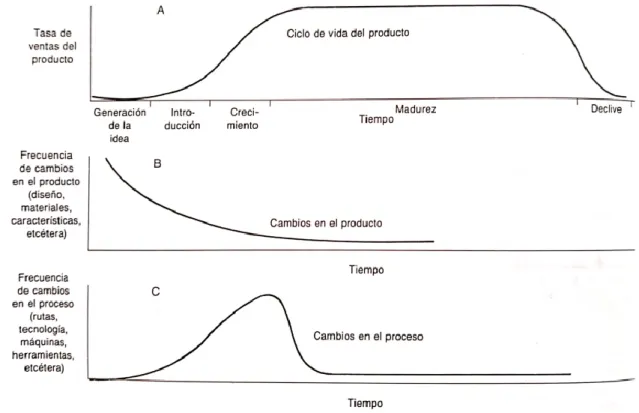
Modern concepts of industrial planning
Seek to optimize each step of the process, as well as the production itself. 5S is a methodology developed by Toyota to achieve sustainable improvements in the level of organization, order and cleanliness, in addition to increasing staff motivation. Seiri (order): Subordinate and classify elements of the work environment, discarding those that are not needed or are outdated or in poor condition.
It usually involves a change in the attitude of the employee and also of the company, but although the application in both elements focuses on different aspects, they share the same goals and do not lose their connection. They are all concepts, techniques or philosophies that must be taken into account in the application of the industrial planning guidelines set out in this project, both in the analysis of methods and the distribution of operations, and in the balancing of lines or the distribution of spaces.

Practical framework. Industrialization concepts application
Product introduction
It is possible to distinguish mainly between rear, top or side loading containers, as in the case of the ICON. The new model, in addition to a design renewal, offers several improvements in performance; Minimal road invasion, customization of front masks, a 5-position pedal and a more ergonomic handle, among others. All this as a result of the variation in most of the components except the bucket, the container body, which has been retained from the previous model.
It is difficult to describe the assembly of a product without explicitly referring to its components. Therefore, to facilitate reading and understanding the explanations below, a list of the main components that make up the ICON is presented, taking into account the order in which they can be assembled:. The color will depend on the type of residue or configuration chosen by the customer.
Productive system description
- Productive activity location
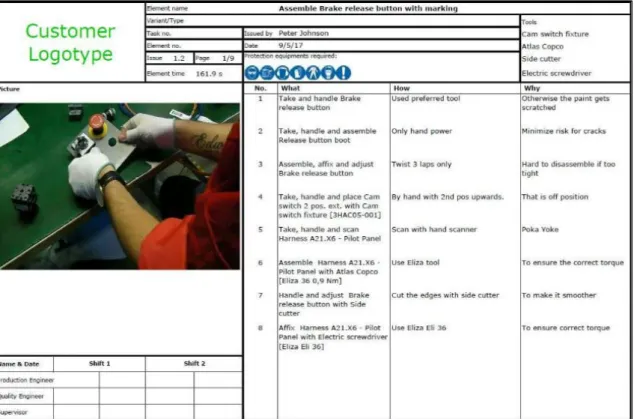
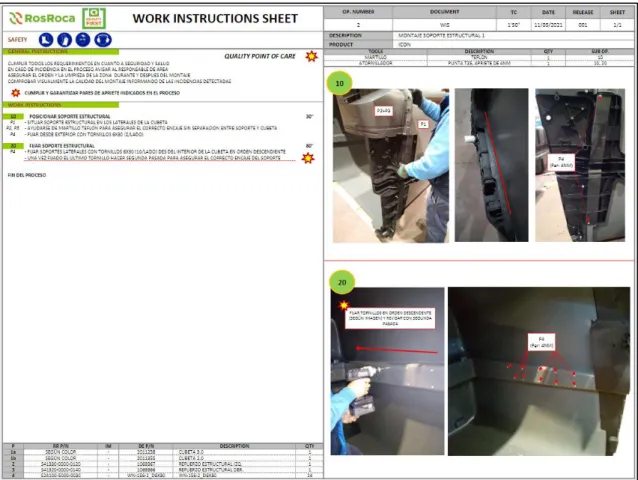
Operations definition
As can be seen, and as mentioned in the format description, the WIS contains assembly instructions accompanied by images, references of the components used, tools required and estimated running time, as well as outstanding notes of critical points or to t the tightening torque was observed. As for the documentation, to determine the operations, a cloud server was used to find the files corresponding to all one of them. For each operation, the WIS worksheet is collected in Excel format, together with its translation (to be implemented in the future), the PDFs corresponding to the different realized versions of the assembly instructions, a folder where the plans are collected included in the assembly. , and another folder with a summary of images and videos taken during the analysis of the operation in question.

Time measurement
- Number of observations calculation
- Supplementary times estimation
- Standard time calculation
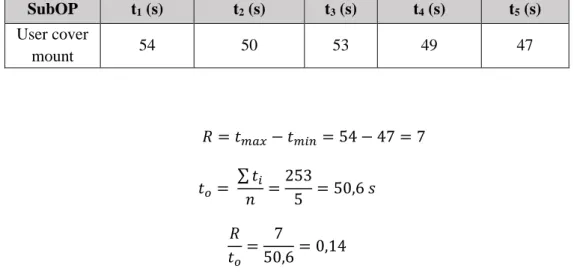
Nevertheless, and continuing with the practical example of user coverage, this operation will be performed several times. There is not much documentation on the ideal estimate of the number of samples taken, so it cannot be defined whether the time used is the observed or the normal time obtained after applying the activity factor. For the allocation of additional time, and in the absence of experience in human resources and personnel management, the main person responsible for the production of the department has been asked to determine it, according to the indications in the theoretical part (Figure 11 ).
The final step to determine the actual times to be approved for operations is to determine the standard time. The total authorized time of the operation (TC) will be the sum of the standard times of the sub-operations that make it up.
Assembly line balancing
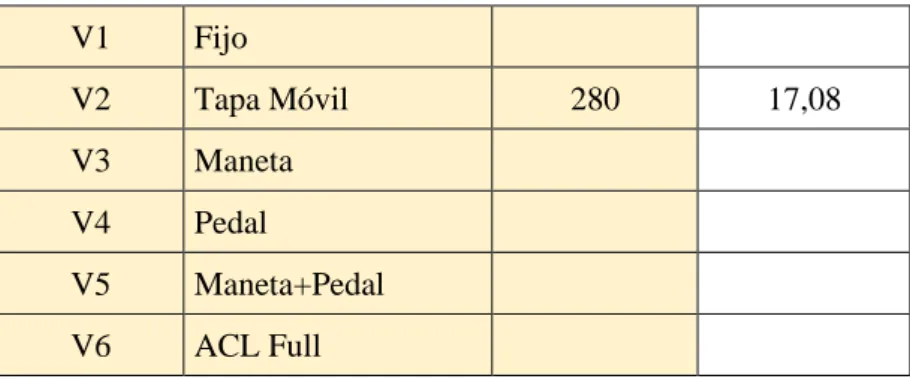
In addition, it is observed that in cases where the units are the largest, the type of version of the containers is always recycling, the lids of which are usually fixed in such a way that users cannot open them and have to dispose of the garbage through the dedicated slots. Nevertheless, and to test the functionality of the created spreadsheets, the calculations will be performed with the mobile address version, as it contains more complex operations, but at the same time is more controlled (times are more accurate). The first of the sheets will be devoted to a brief description of the use of the file, together with an explanation of the contents of the various sheets, such as indexing.
54 After defining the basic parameters of the project (units, working time and adding a certain degree of unpredictability), we get for a certain cycle time (the time of assembly of 1 unit) of execution with a mobile cover 17.08, the takt time (the time from which everyone must advance in the line and consequently 1 unit will be completed) 4.63 minutes, which assumes the distribution of operations to at least 4 stations. It should also be noted that given the accuracy expected to be obtained by estimating the times used, seconds will be used directly rather than the other specific units shown in section 2.3.3 (Time Units).
Sizing and plant distribution
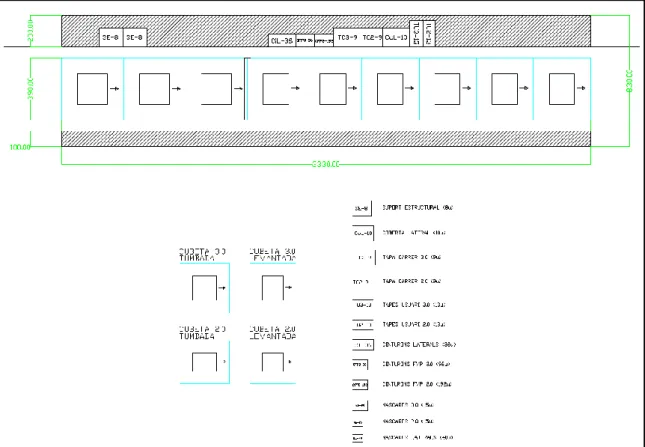
The total assembly area must consist of the assembly line and room for direct supply of the assembly line, both hardware and large plastic parts and other components. For an estimate of the space dedicated to the delivery of components, the equivalent of the surface occupied by their packaging has been represented and located. For a safety stock that covers the production of 2 days (about 500 containers), and with an additional stock of 500 more buckets, since they come from a foreign supplier and the margin of maneuver is less than with the rest of the components, Only space is obtained recorded for parts stock of approx. 530 m2.
In addition to the stock room and the assembly room, the room for receiving the material. 60 (loading docks) and the output of the final product must also be taken into account, pending their definition by the logistics department.
Tools design
Mobile Overhead Crane: To avoid operators having to lift the containers manually, considering the wear and tear this could cause in high volume production, the Mobile Overhead Crane system was designed. The design consists of a motorized lift and a removable and mobile structure to which it will be attached. For two formats (2.0 . 63 and 3.0) a kind of lifting bracket with two widths was also designed with loops and attachments for gripping the side screws of the structural support.
The container must be raised 2 times; one to go from lying down to standing up at the corresponding stage, and another when finished to be able to easily remove it from the car where it will be uploaded. Unfortunately, at the end of the project, none of the tools could be tested yet.

Conclusions
Future improvements
Through the project, the aim was to create a tool to facilitate the organization of the production processes of the product. As a result, it was decided to create a design of the entire assembly line, where the product with the appropriate components depends on the stage it is in. The highlight of this idea was the ability to model the line. to the virtual reality simulation we will study.
This could be used both for marketing the product and the brand, as well as for training new employees. Last but not least, work will continue to optimize both the methodological process and the production of the product itself, after being able to test the results obtained through this thesis.
Bibliography