For this reason, when this happens, we are obliged to first align the data into a common data model. In addition, each source has its own way of storing data (MongoDB, MySQL, InfluxDB, Neo4J, CSV files), regardless of the data model. For this reason, harmonizing data provided from different sources increases data interoperability, which creates a solid structure for understanding data, independent of the technology providers use to store their data.
Project’s Background
For example, let's assume that a company would like to consume different types of data provided by several sources, such as electricity and gas consumption, and the goal would be to perform a comprehensive analysis and compare other sources. Furthermore, the main differences between them are that SQL uses relational databases, is a structured query language, can be vertically scalable, and can represent data as a table consisting of rows and columns. Although NoSQL is a non-relational database whose data is unstructured, it can be scaled horizontally and have many ways to represent data, such as key-value pairs, documents, graphs or wide column stores.
Objective & Purposes
Comparison between RDF and LPG
RDF can model the triplet as a graph consisting of nodes and edges, named by Uniform Resource Identifier (URI), where it can be published on the web and used by others. It can carry properties directly within its nodes and relationships, where the internal structure is carried out by nodes and relationships defined by key-value pairs. Although in RDF the nodes can carry properties by adding new nodes and connections, edges cannot carry such information without complex solutions.
Labelled Property Graphs
Resource Description Framework
- Ontology
- Linked Data
- RDF-star
- RDF Mapping Language
Linked data is structured data that is related to other data and has the ability to ask semantic questions. HTTP URIs should be used to allow these things to be viewed, interpreted and then "dereferenced". Furthermore, Tim Berners-Lee suggests a 5-star scheme to guarantee the quality of open data on the web.
SPARQL
Syntax
RML is represented as a superset of the W3C standardized mapping language, with the aim of expanding its applicability and broadening its scope by adding support for data in other structured formats. An RML mapping is not tailored to an individual database schema, but can be defined for data in other structured formats such as CSV, TSV, XML, and JSON. It provides a generic way to determine the easily portable mappings to cover references to other data structures.
Extract, transform and load
JSON-LD
Syntax
The syntax is designed not to disrupt already deployed systems running on JSON, but to provide a smooth upgrade path from JSON to JSON-LD. Because the form of such data varies greatly, JSON-LD has mechanisms to transform documents into a deterministic structure that simplifies their processing.
Apache Jena
Examples of Databases
- GraphDB
- ArangoDB
- Neo4j
- Stardog
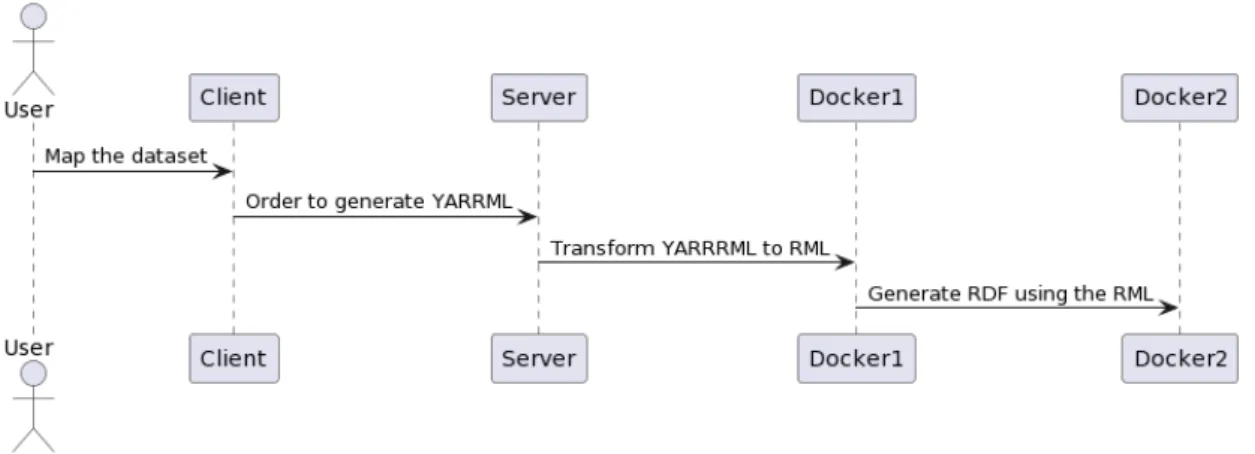
In this section, I will explain the design of the proposed solution to map the data to a harmonized model. It will be a human-readable configuration that contains all the necessary steps to map the data; the format to structure this file is YARRRML. Then we process the obtained output to map the data and generate an RDF file.
Architecture
Presentation Layer
It enables navigation between views of various components in an application, enables changing the browser URL, and keeps the user interface in sync with the current URL.
Domain Logic Layer
Data Sources Layer
Data Model
To successfully develop our project, we want to decide how we can allocate our resources. For this reason, the final result can be determined by thinking about the best methodology that we can follow during the development. This methodology uses short iterations, which allows us to implement speed, consistent review and adaptability if the project requires unforeseen changes.
According to the project, I decided to follow the trend of using Agile because the traditional methodologies such as Waterfall do not have the adaptability that the project requires as the priorities of the requirements may change during development. Furthermore, using a waterfall methodology generates a large number of requirements, most of which do not add value to the project. The requirements will not be static; they may vary during the development of the application depending on their priority.
Planning
- Research
- Ontology Implementation
- Implementation
- Revision Documentation
During this period, I thought about the best way to do the project properly and the concepts I could use during development. Currently, the standard is R2RML, although it is not very useful and easy to understand. It is a human-readable textual representation for declarative rules for generating linked data based on R2RML.
Also, it is a subset of YAML, a widely used data serialization language, designed to be more human-friendly. According to the implementation of the ontology, I decided to use an earlier, understandable and straightforward data model to make the development and design of solutions more actionable than problems. But, of course, this part is never finished because it can be improved over time, while it is outside the scope of the project.
This part 7 is the heart of the project; it makes sense because it needs more effort, resources and expresses the product. The deployment process is required to make the app available to users and to receive feedback. And the documentation collects all the experience gained during the project, such as issues, solutions, results and conclusions.
Finally, after writing the first versions of the documentation, it requires different points of view to review and improve it.

Budget
Iteration 1: First contact
- Requirements
- Design
- Implementation
- Results
I also created an .env file to store private information such as secret keys, database connections, and environment variables. On the other hand, I installed Ant Design as the core of our UI and designed the routing part of the application using the library react router. The results of this iteration are sparse as most of the time was spent researching and learning the technologies used.
Iteration 2: User Management
- Requirements
- Design
- Implementation
- Results
The first step in this iteration was to design a data model that represents the data as users. For this reason I use librarypydantic which allows us to validate the data and create instances based on the model. It will help us avoid incorrect data in our database and check the data correctly.
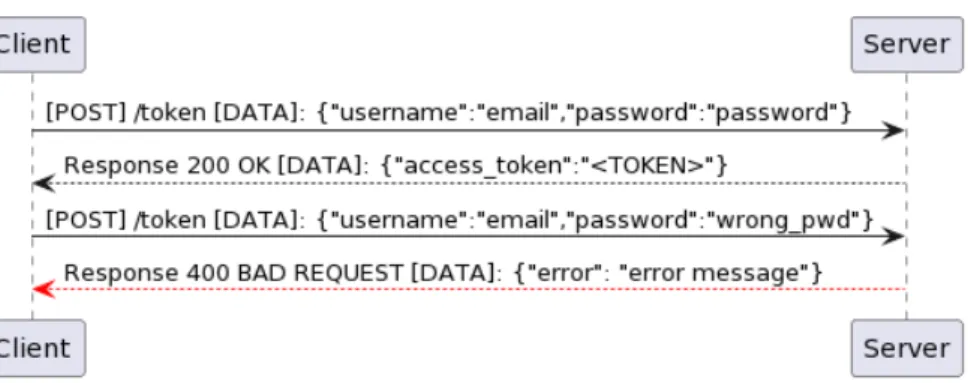
For example, pydantic helps us check if the username used to create a new user is an email. Additionally, for all endpoints except user creation, I check if the user is authenticated and their role. This authentication is intended to secure the application and prevent users from changing information without consent.
Accordingly, in the presentation layer, I design a navigation bar that allows us to authenticate as a user. However, there are various solutions for storing authentication data, such as session, context, or persistent Redux. As a result of this iteration, I build a web where users can authenticate, retrieve their profile information, and change their profile information using a visual interface.
The presentation layer uses the logic layer to collect data from the database, and the user can interact with it.

Iteration 3: Ontology
Requirements
Design
Implementation
Results
Iteration 4: Mapping Classes
- Requirements
- Design
- Implementation
- Results
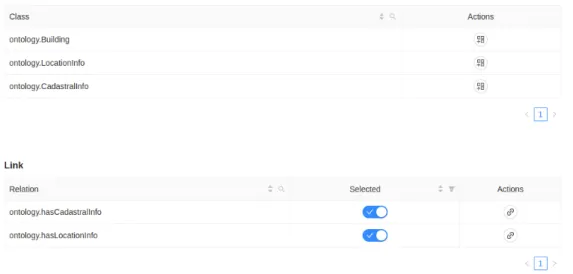
After defining the data model, I started working on theRESTendpoints and the correspondent forms on the presentation layer. Behind that I developed the method to map the data; this was the most complex functionality so far because I had to think of a precise and optimal way to store the data mapped and the workflow the user will use. Furthermore, I need to define an endpoint to initialize the mapping instance according to the ontology the user would like to map; this endpoint initializes the instances by inserting classes and the relationships they may have.
To deploy the endpoints, I created a new blueprint called /instances, which contains the endpoints related to instance mapping. I then created a new route to the frontend called /instances; this route contains all pages related to mapping our data, such as the list of our mapping instances. It suggests that the application starts to make sense at this step and follows the objectives of the project.

Iteration 5: Mapping Relations
- Requirements
- Design
- Implementation
- Results
For example, if we have the following data set, we must have a post-transformation to map the relations correctly. To display the mapped data, I developed a response component where the user can see the mapped classes and the relationships used. I used a library called dreact-flow to develop this part; is a highly flexible React component for building node-based editors and interactive diagrams.
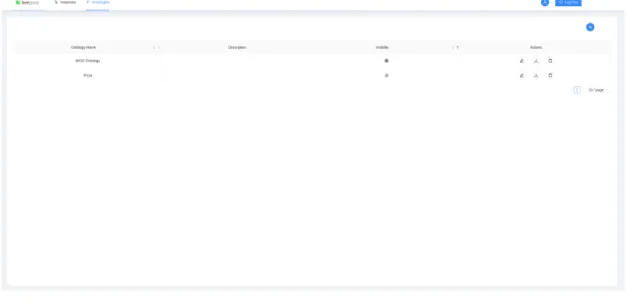
Iteration 6: Multiple Ontologies
- Requirements
- Design
- Implementation
- Results
It is interesting if you want to load multiple versions of the same ontology, for example before and after inference. The results of this iteration are the following improvements: managing and enabling the use of map data using different ontologies. In terms of software, when I talk about deployment as a process that includes all the steps and activities required to make the software available to users, for example on a server or device.
According to the previous definition, we need to implement the three layers described in the architecture section to enable the integration between the layers and get full functionality of the project. In the beginning, I decided to implement the different layers in hosting services and database providers that have free plans such as Heroku, MongoDB Atlas and Render. However, after various attempts, we found that the free plans are not enough to implement our presentation layer because they require more resources than those available in their free versions.
So finally, I'm using the assets to deploy this project: a Kubernetes Cluster and a MongoDB hosted on a private server. In addition to automating the process of building the docker images when the iteration ends, I create a Github action that automatically builds the images and pushes them to the docker registry. At the same time, it helped me understand that web development is not trivial, especially in the research field.
After completing most of the functionalities and features of the software, there are still requirements to satisfy and develop for future work or upgrades. 6] ETL: What it is and why it matters.url:https://www.sas.com/en_us/insights/data-management/what-is-etl.html. Energy efficiency measure: it refers to the measure that determines the less energy needed to provide an energy service.