Energy market - a market in which electricity is bought and sold from producers to consumers. Independent System Operator (ISO) – An organization that operates and manages infrastructure in the electricity grid.
Introduction
- Objectives and Research Questions
- Significance and Originality of the Research Contribution
- Practical Implications
- Thesis Overview
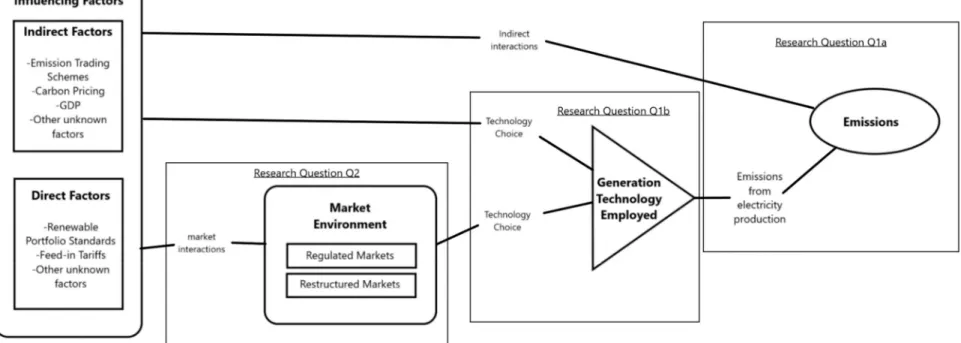
Question 1a: Which set of renewable energy policies is more effective in reducing emissions from energy production. Question 1b: Which set of renewable energy policies is more effective in increasing the adoption of renewable energy technologies.
Literature Review
Chapter Intro
- Existing Groundwork
The first article, What Drives Renewable Energy Development, examines developed energy markets to determine which metrics play a statistically significant role in renewable investment (Alagappan et al., 2011). However, this paper does not explain why market type does not affect the effectiveness of renewable energy policies such as FITs.
Regulated Markets
- Summary
- Negative Consequences of Regulated Markets
- Research Refuting the Negative Consequences of Regulated Markets
Contrary to the idea that free markets are more efficient and successful, many articles state that restructured markets do not perform at the level of regulated markets. Some research also suggests that regulated markets have a stronger ability to respond to consumer demands.
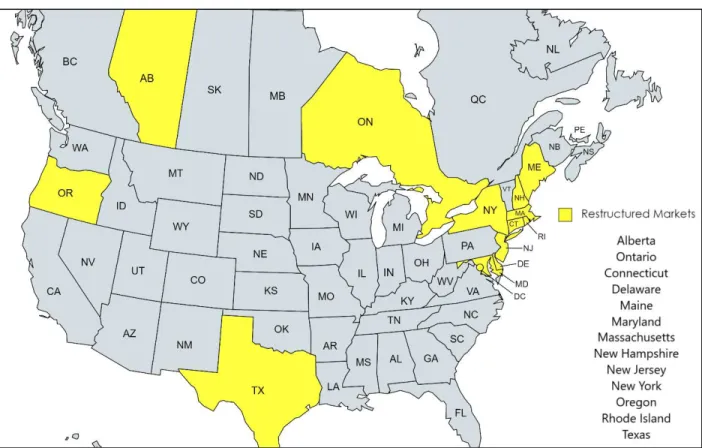
Restructured Markets
- Negative Consequences of Restructured Markets
- Research Refuting the Negative Consequences of Restructuring
Second, increased trade from regulated markets to restructured markets increases consumption in the importing region. There is a body of research showing that restructured markets can have lower investment in generation (Brown, 2018a; Dooley, 1998), fail to meet required levels of network investment (Prentis, 2014) and have innovation lower than potential (Frame et al., 2018).
Policy Mechanisms That Influence Renewable Technology Adoption
FITs come in two variations as outlined by Brown and Eckert (2018): fixed FITs and premium FITs. Fixed FITs are compensation generated a fixed fixed amount per unit, while premium FITs compensate a fixed amount on top of the current market price for electricity, or a premium on the market: a true market premium (Brown & Eckert, 2018 ; Haas et al., 2011; Wagner, 2016). FITs have historically been used due to ease of implementation and consistent results (Haas et al., 2011).
The differences between fixed and premium FITs are detailed in the article by Brown and Eckert (2018); premium FITs exacerbate existing market power exercises, while fixed FITs do not allow for a 'more valuable' renewable required by a market to prevail. For markets with high competition and low market power concerns, premium FITs allow market forces to promote more welfare improvement and desirable renewable energy. A note on premium versus fixed FITs is that both policy options are available for restructured markets, but premium FITs are not available for traditional regulated markets because there is no spot market (wholesale market) for electricity.
Methods
Data Collection
US data was obtained from the US Energy Information Administration and released to the public domain for use. Emissions data includes emissions by generation type by state and is found on the EIA website (EIA, 2020c). Net generation by state was also obtained from the EIA website, obtained from their annual generation report (EIA, 2020b).
Variables
- Dependent Variables
- Independent Variables
- Control Variables
- Data Dictionary
The data is compiled based on the combined installed capacity of the technologies used and the employed capacity of the technologies used, and was obtained from government and utility websites in the relevant regions (BC Hydro, 2016; Canadian Energy Regulator, 2016; US Department of Energy, 2016). Some analyzes used the percentage change in technology from 2005 to 2019 to examine which regions transitioned from one technology to another. As an extension of Alagappan et al. 2011) this analysis includes feed-in tariffs (FIT), renewable energy portfolio standards (RPS) and emissions trading schemes (ETS).
In addition, the thesis analyzes the impact of different combinations of these policies on the adoption of renewable energy production technology. The inclusion of these two variables is also necessary to increase the robustness of the analysis by preventing potential confounding variables from influencing the results. In each step of the analysis, the percentage of total production was used as the basis for the variables dependent on the production technology.
Data Analysis
- Data Preparation
- Regression
- Repeated Measures ANOVA
- MANOVA
- Diagram of Explored Interaction
The second model tested the relationship between GDP in each region and the generation technology used. As previously mentioned, the first analysis performed was a regression model to examine the links between emissions and generation technology and GDP and generation technology. The second model was created using Python to check the relationship between GDP and each technology used, both as actual generation and as a percentage of total generation.
An OLS regression was tested for each generation of technology with any significant results indicating that the choice of that specific generation of technology is significantly influenced by effects outside of policy decisions. After analyzing the emissions, the same procedure was carried out for each type of technology, both actual production and percentage of production, in order to determine which factors are related to the choice of production technology used in the analyzed regions. The final step of the statistical analysis was a multivariate ANOVA, which was used to examine potential associations between policies and generation technology independent of time.
Results
Descriptive Reporting
- Descriptive Statistics
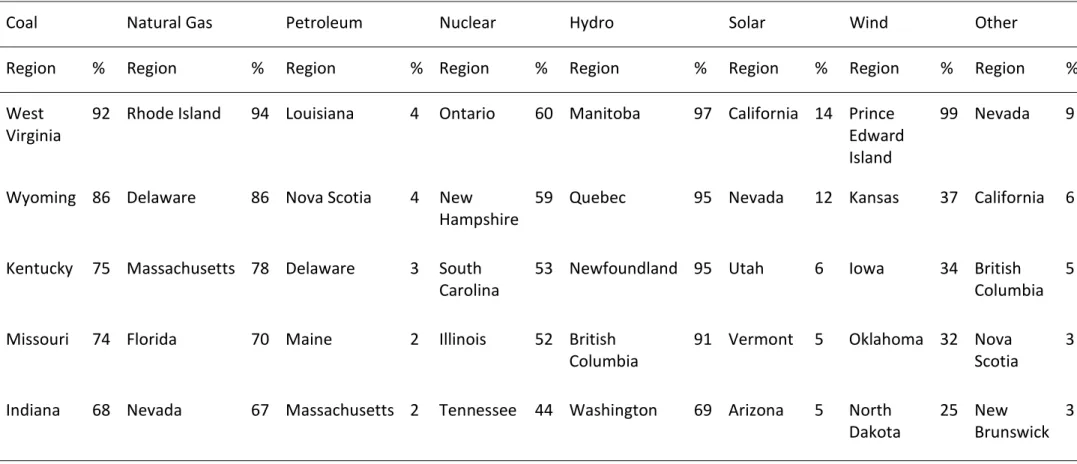
Regions with renewable portfolio standards listed with the associated subtype Region Name RPS Type Region Name RPS Type. This section summarizes the descriptive statistics of the different regions in terms of production capacity, emissions and technology used. Table 6 shows the regions with the most changes in production technology from 2005 to 2018, separated by individual technology.
Regions with the highest increase in nuclear generation were New Hampshire, Tennessee, New Brunswick, Ontario and Maryland. Regions with the highest increase in hydro generation were Vermont, Maine, Montana, New York and Ontario. This is likely because natural gas is the most direct substitute for coal generation.

Regression Models
- Emissions by Technology Use
- GDP Control
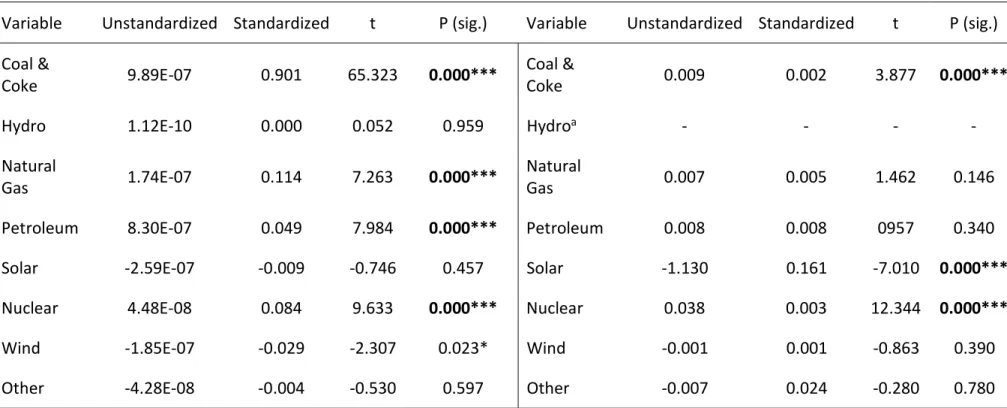
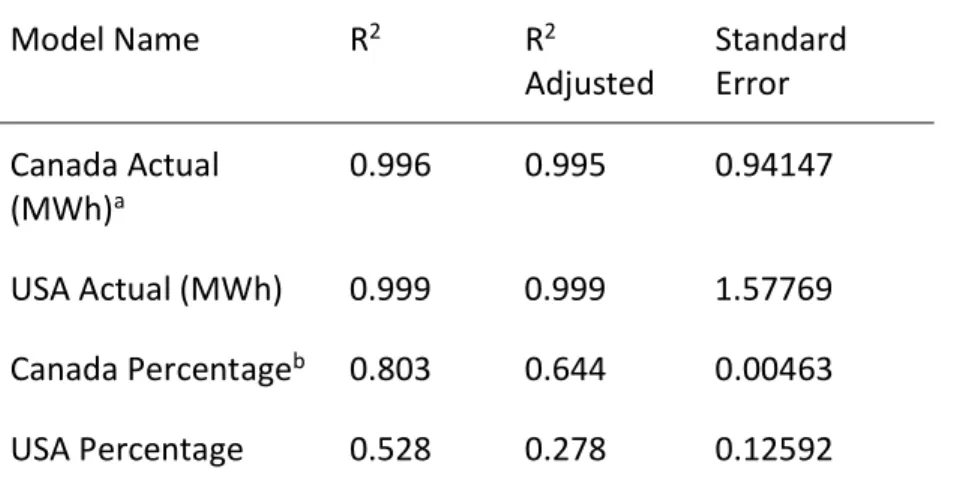
The values shown can be compared with Table 6 to illustrate how successful certain regions have been in switching generation technology. The last two models are similarly separated, in Canada and the US; however, production technology is quantified as the percentage of total production in each region that predicts emissions, where total production in each region is divided by the region's population. Why the model does not hold as strongly in the US is unclear, but can be assumed as: states are more likely to have a diverse generation portfolio, where changes in a single generation technology do not affect total emissions as strongly as a more homogeneous technology mix.
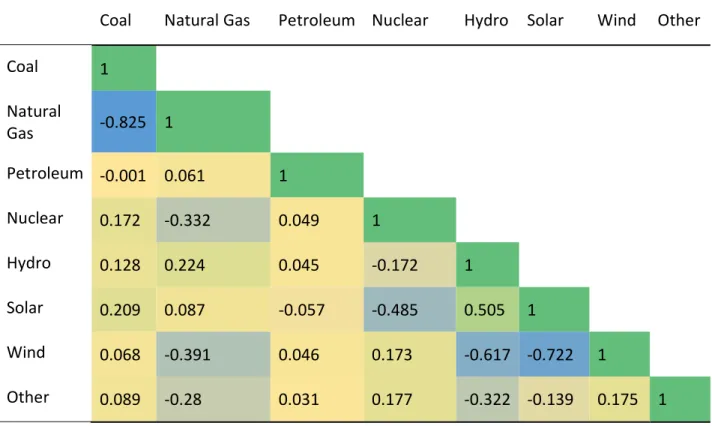
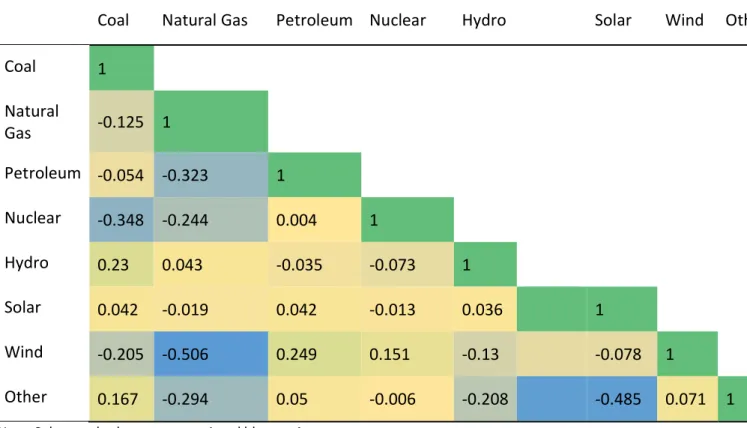
Actual generation models are on the left side of the tables and percentage of total generation are on the right side of the tables, shown below. The results of the first regression model show a conclusive relationship between fossil fuel generation and emissions from electricity production. This regression shows the results of the test between economic activity and generation technology used.
Repeated Measures ANOVA
- Emissions from 1990 to 2017
- Technology Choice from 2005 to 2019
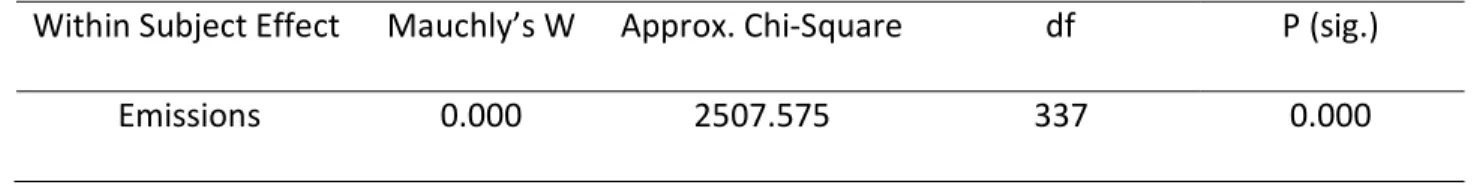
The results of the first repeated measures analysis, summarized in Table 13, show a test of sphericity to determine whether a Greenhouse-Geisser correction should be made. This probably indicates some difference in production that has shifted over time, but this needs to be confirmed by reviewing the results of Section 4.3.2 Technology Choice from 2005 to 2019 to see if the emissions are related to the use of coal or natural gas. The first result from Table 16 shows that year is a significant factor in the model, which is expected since the technology shifted from coal to natural gas technologies in the sample years.
For the control categories, land is shown as a statistically significant factor showing differences in the use of water and wind technologies. The results of Table 16 require additional context from Section 4.4.3 Technology Change from 2005 to 2019 to understand what data this repeated measures ANOVA is collecting. The results of the later section will show that the regions using an RPS measure probably did not have large changes in the next generation, and therefore the relationship found in Table 16 is probably a sampling bias.
MANOVA Analysis
- Emissions in 1990 and 2005
- Generation Technology in 2005 and 2019
- Technology Change from 2005 to 2019
This observation is further elucidated along with a discussion of other related limitations and the implication of the control variable findings in Chapter 5: Discussion and Conclusions. When FITs are combined with an ETS, it appears to be a slightly larger part of the model. Shown in the table is the statistical significance for each technology of the four factors from Table 22, ETS, FIT, ETS combined with FIT and RPS combined with FIT.
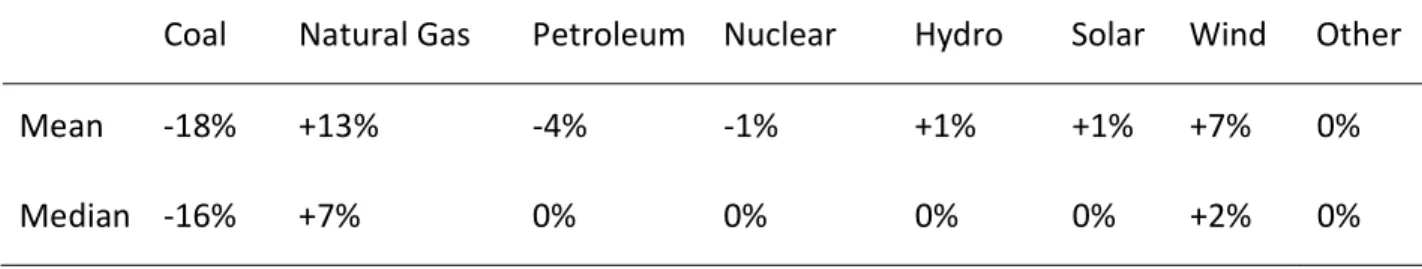
Below is Table 24, which summarizes the output of the T-test to determine the difference between regulated markets and restructured markets in changes in technology. Coal is the first technology that had different changes between the two market types, with regulated markets having an average decrease of 35% and restructured markets with an average decrease in coal of 3.5%, as shown in column 5 of the table. Natural gas is the other technology that had statistically different rates of change between the two market types.

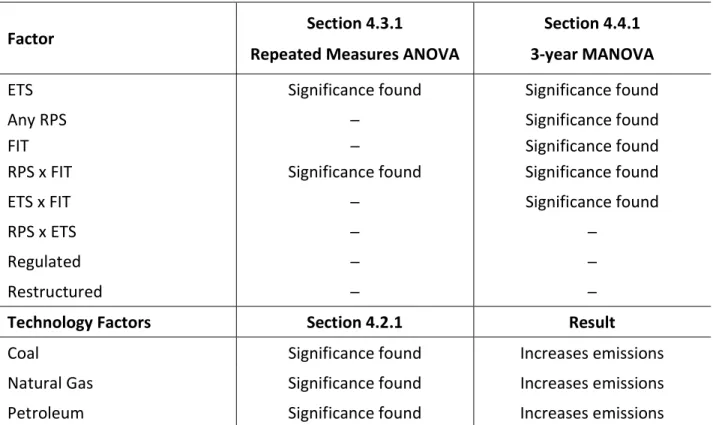
Results Summary
Note: Abbreviations are Emissions Trading Scheme (ETS), Feed-in Tariff (FIT) & Renewable Portfolio Standard (RPS). Note: Abbreviations are Emissions Trading Scheme (ETS), Feed-in Tariff (FIT) & Renewable Portfolio Standard (RPS).
Discussion and Conclusions
Discussion
- The Influence of Generation Technology and Policy on CO 2 Emissions
- The Influence of Renewable Energy Policy on Technology Choice and Technology
- Restructured Markets vs. Regulated Markets
- Limitations
- Future Research
A key pattern found in this research is that regulated regions switched from coal to natural gas and restructured regions from natural gas to other technologies. Csereklyei and Stern (2018) mention that the choice of natural gas is probably related to the low costs of fuels and the return on investment when switching from coal to natural gas. However, they are related to natural gas reduction rather than coal reduction as shown in the other sections.
The assumption that restructured regions changed technology early or before the sample time frame is supported by research conducted by Csereklyei and Stern (2018), which showed the switch from coal to natural gas by restructured regions. That is, the switch from coal to natural gas observed in Carley (2009) and Csereklyei and Stern (2018) through restructured regions is a similar change observed in Section 4.4.3. This may indicate that the transition from natural gas to renewable energy by restructured regions may be repeated by regulated regions in the near future.
Conclusion
Retrieved from https://www.npr.org/sections/live-updates- winter-storms jerry-jones-company-hits-jackpot-as-harsh- storms-send-natural-gas-prices-surging. Retrieved from https://www.epa.gov/ghgemissions/inventory-us-greenhouse-gas-emissions- and-sinks https://www.epa.gov/sites/production/files/2020-04/documents/us -ghg- inventory-2020-main text.pdf. Retrieved from https://www2.gov.bc.ca/assets/gov/farming-natural-resources-and- industry/electricity-alternative-energy/electricity/bc-hydro-.
Retrieved from https://www.climate.gov/news-features/understanding-climate/climate-change-atmospheric-carbon-dioxide. Retrieved from https://www.cnbc.com how-the-texas-power-grid-failed-and-what-could-stop-it-from-happening-again.html. Retrieved from https://www.cnn.compolitic/us-rejoins-paris-agreement-biden-administration/index.html.
Python Scripts
Python Code