Using data from 27 European countries from 1995 to 2014, we estimate the elasticity of the poverty rate among people over 65 years of age in relation to public pension expenditure per inhabitant. To do so, we first regress the poverty rate on public pension spending and its square. We then calculate the elasticity of the poverty rate among people over 65 with respect to public spending per capita for pensions.
In another study, van Vliet et al. 2012) examines the impact of the privatization of public pension schemes on the poverty rate and income inequality among people over 65 years of age. Given the non-linear relationship between xi,t etyi,t, we cannot directly obtain the elasticity of the poverty rate to public pension expenditure from the coefficient 1.
Descriptive statistics
Our second specification intends to capture the impact of different public pension schemes and, in particular, to better understand the impact of the redistribution index on the poverty rate. Second, as expected, poverty rates using the median of the poverty line are always higher than using the mean. Using mean income instead of median income to calculate the poverty line would therefore mean that a significantly larger proportion of the population is considered poor.
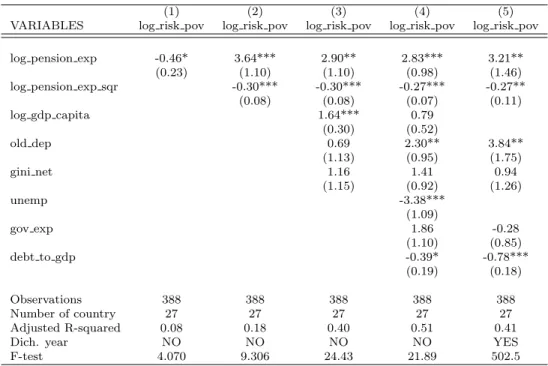
Baseline results
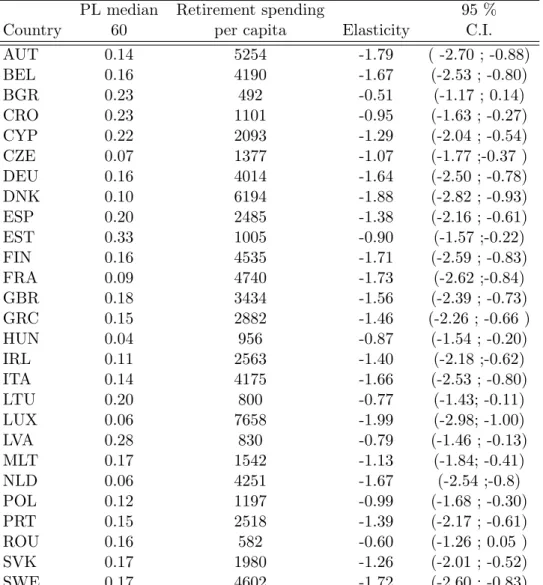
Similarly, Bulgaria has relatively low average expenditure (408e) and a relatively high average poverty rate (0.29) during the observation period. An example is the poverty rate for France, which corresponds to 0.14 over the period using the median, while the rate is 0.23 using the mean income. Similarly, poverty rates are always smaller when we lower the poverty line by 50% and 40%, which means that fewer people are considered poor, but in turn it identifies a proportion of the population that is all the more poor (i.e. the depth of poverty may be higher).
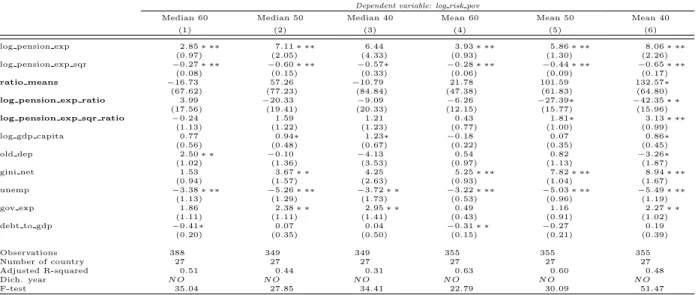
Tables 11 and 12 in Appendix C provide the mean and median values of the key control variables of our model. The other variables in these tables give an idea of the macroeconomic situation of these countries. Moreover, the introduction of the nonlinear term in column 2 significantly increases the adjusted R2, indicating the presence of a nonlinear relationship between public pension expenditure and the poverty rate.
Also, the results in column 4 show that the effects of dependency rate, unemployment rate, and debt-to-GDP ratio on the poverty rate are significant, while this is not the case for the Gini index. Second, in column 4 we find a positive effect of the dependency ratio on old-age poverty. If so, this also means that the median income should decrease, and bearing in mind that the poverty rate is calculated as the proportion of the elderly with less than 60% of the median income, the poverty rate should decrease mechanically.11 A similar explanation could be given for the positive relationship between GDP per capita and the poverty rate in column 3: as the economy grows, the average wage tends to increase, so more individuals would fall below the poverty line.
We find similar results than in regression 4, but the adjusted-R2 is lower, so in the rest of the analysis we decided to continue with the result of regression 4.
Elasticity of poverty among the elderly to pension spending
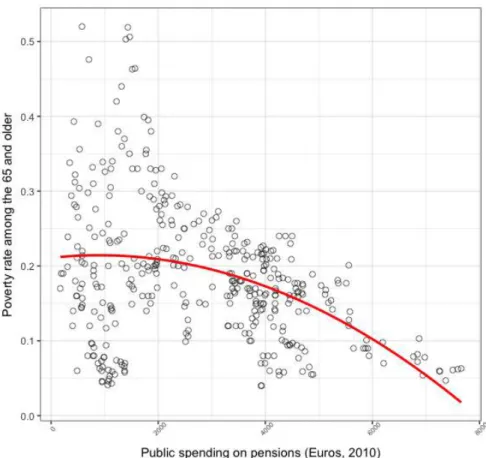
The last column in the table above shows the results when, instead of using GDP and unemployment per capita as controls, we choose annual fixed e↵ects. The elasticity of elderly poverty with respect to per capita public pension expenditure differs significantly from zero only above a per capita expenditure ratio of about 685th. Above a threshold of 1200e, the elasticity even becomes higher than 1 and at the average public pension expenditure per capita of 2819.45e it is equal to -1.45 (see Table 18 in Appendix H).13 This indicates that at this value, a 1% change in pension spending would reduce the poverty rate by 1.45%.
Another interesting feature that emerges from this graph is the non-linearity of the elasticity. This implies that an increase of 1e per per capita public pension expenditure increases (in absolute value) the elasticity of the poverty rate more when public expenditure is low than when it is higher. Concentration of resources on the countries with lower public expenditure per per capita therefore has a higher marginal effect on poverty reduction than for countries with higher.14 This is certainly something that the European policy makers should take into account.
It also shows that the elasticity of the poverty rate is negative and significantly different from zero for all the EU-27 countries. This result therefore suggests that each country can reduce the poverty rate among seniors by adopting generous pension plans. Finally, in Appendix F, we report additional calculations of the elasticity of poverty to public pension by successively removing countries (Table 14) or groups of countries (Table 15) to ensure that the average value for this elasticity (1.45) is not driven by outliers, i.e.
Finally, we check whether our results are sensitive to a modification in the definition of the poverty line and whether the different structures of pension systems across countries have an impact on the relationship between poverty and public pension spending.

Alternative specification in first di↵erences
On the other hand, countries such as Bulgaria, Romania and Lithuania, which have low expenditure levels and high poverty rates, also have the lowest elasticity in absolute value. Our baseline result of 1.45 is robust to these alternative calculations, as we always find elasticities well above 1. In the following, we first verify whether the general trends could have affected our results.
The elasticity is calculated based on the value of expenditure incurred for the public pension plan in the last year available for each country.
Endogeneity
When the square of the endogenous variable is also present, its nonlinear transformation is not necessarily endogenous and the direction of the bias, if it exists, is no longer straightforward. In solving this problem, we rely on Wooldridge (2002).15 We treat pension expenditure and the square of pension expenditure as two endogenous variables. In the second step, we use the predicted values obtained in the previous two regressions as explanatory variables in the second stage of least square estimation.
Although it is impossible to say that there is no endogeneity problem in the relationship, this does not significantly change our results, as the coefficients above show. The value of the coefficient associated with public pensions in the table above is .68 versus .46 in the baseline regression.

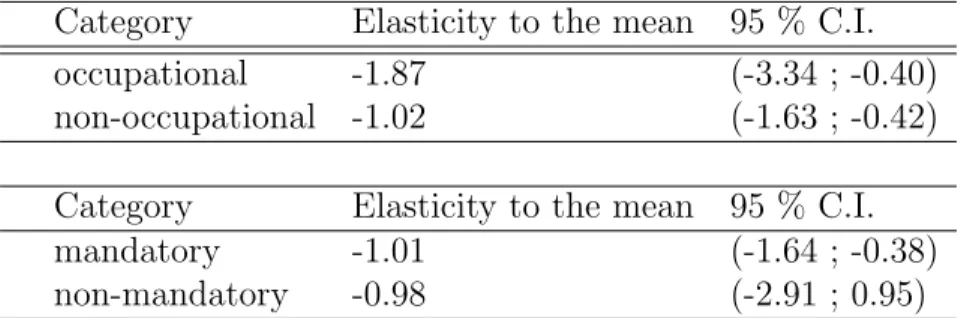
Changing the definition of the poverty line
As consumption increases, the elasticity becomes negative, increases in absolute value, and then stabilizes. It is interesting to note that the lower the poverty line used, which therefore includes fewer individuals but poorer people, seems to be the greater the elasticity. This suggests that the impact of pension expenditure on poverty is greater when a smaller and poorer part of the population is taken into account, thus confirming that public pension schemes are a particularly important lever for the poorest people.
17 Recall that the relationship between poverty and public pension expenditure per capita is not significant for a poverty line set at 40% of median income.
Including country-specific characteristics of pension systems
Only when we set the poverty line at 40% of average income (and to some extent at 50% of average income) do we find that the introduction of the redistributive index affects the poverty rate. It is therefore not surprising that the redistribution index as well as the cross-effect of asset-based expenditure on pension expenditure are significant under this alternative (more restrictive) definition of the poverty rate. Specifically, we estimate the elasticity of the old-age poverty rate to public spending on pensions per capita.
Second, the use of different definitions for the poverty rate shows that the poverty elasticity is more strongly negative when using a lower poverty line. The poverty risk is defined as the proportion of people with a corresponding disposable income (after social transfers) below the poverty line of 60 percent of the national median disposable income after social transfers. The poverty risk is defined as the proportion of persons with a corresponding disposable income (after social transfer) below the poverty line, set at 50 per cent. of median equivalent disposable income after social transfers.
The poverty risk rate is defined as the share of people with an equivalent disposable income (after social transfers) below the poverty line, set at 40 percent of median equivalent disposable income after social transfers. The poverty risk rate is defined as the share of people with equivalent disposable income (after social transfers) below the poverty line of 60 percent of the average disposable income after social transfers. The poverty risk rate is defined as the share of people with an equivalent disposable income (after social transfers) below the poverty line, set at 50 percent of the average disposable income after social transfers.
The at-risk-of-poverty rate is defined as the share of people with an equivalent disposable income (after social transfers) below the poverty line of 40 percent of the average disposable income after social transfers. The following table provides a specification (4) of the base scenario (see Table 1) when we vary the poverty line at 40, 50 and 60% of the median or average income for the calculation of the poverty rate. The elasticity was calculated based on the average value (all years and all countries) of public pension scheme expenditure, i.e.