Fabrizi F, et al. , 2018; 17 (3): 364-391
364
Association Between Hepatitis C
Virus and Chronic Kidney Disease:
A Systematic Review and Meta-Analysis
Fabrizio Fabrizi,* Francesca M. Donato,** Piergiorgio Messa***
* Division of Nephrology, Maggiore Hospital and IRCCS Foundation, Milano, Italy. ** Division of Gastroenterology, Maggiore Hospital and IRCCS Foundation, Milano, Italy. *** Division of Nephrology, Maggiore Hospital and IRCCS Foundation, Milano, Italy; University School of Medicine, Milano, Italy.
May-June, Vol. 17 No. 3, 2018: 364-391
ORIGINAL ARTICLE
INTRODUCTION
Hepatitis C virus infection is an important cause of
liv-er disease worldwide.
1Recent evidence has been
accumu-lated showing that chronic hepatitis C virus infection
plays significant activity in various organs and tissues other
than the liver.
1Increasing information exists on the
activi-ty of HCV on kidneys and a relationship between chronic
hepatitis C virus infection and chronic kidney disease has
been mentioned.
2HCV and CKD are major public health
issues all over the world; globally, in 2015, an estimated 71
million people were living with chronic HCV infection.
3A novel systematic review reported that the global mean
prevalence of CKD in general population was 13.4% in
stages 1 to 5 and 10.6% in stages 3 to 5.
4Conventional risk factors for developing chronic renal
disease do not fully explain the current frequency of
chronic kidney disease in the adult general population of
developed world. Various authors have evaluated the
im-pact of HCV on the development of chronic kidney
dis-ease in general population;
5-7our meta-analysis of clinical
observational studies (n = 9; 1,947,034 unique patients)
had demonstrated a relationship between positive
anti-HCV serologic status and increased incidence of chronic
kidney disease; the summary estimate for adjusted hazard
ratio was 1.43 (95% Confidence Interval, 1.23; 1.63,
The Official Journal of the Mexican Association of Hepatology,the Latin-American Association for Study of the Liver and the Canadian Association for the Study of the Liver
Manuscript received: Manuscript received: Manuscript received: Manuscript received:
Manuscript received: January 12, 2018. Manuscript accepted:Manuscript accepted:Manuscript accepted:Manuscript accepted:Manuscript accepted: February 20, 2018. DOI:10.5604/01.3001.0011.7382
A B S T R A C T A B S T R A C T A B S T R A C T A B S T R A C T A B S T R A C T
Introduction and aim. Introduction and aim. Introduction and aim. Introduction and aim.
Introduction and aim. The role of hepatitis C virus infection as a risk factor for the development and progression of chronic kid-ney disease in the general population remains unclear. Material and methods.Material and methods.Material and methods.Material and methods. A systematic review of the published medical lit-Material and methods. erature was performed to assess whether positive anti-HCV serologic status is associated with higher frequency of chronic kidney disease in the adult general population. We used a random-effects model to generate a summary estimate of the relative risk of chronic kidney disease (defined by lowered glomerular filtration rate or detectable proteinuria) with HCV across the published stud-ies. Meta-regression and stratified analysis were also carried out. Results.Results.Results.Results.Results. Forty studies were eligible (n = 4,072,867 patients), and separate meta-analyses were conducted according to the outcome. Pooling results of longitudinal studies (n = 15 studies, n = 2,299,134 unique patients) demonstrated an association between positive anti-HCV serologic status and increased incidence of CKD, the summary estimate for adjusted HR with HCV across the surveys, 1.54 (95% CI, 1.26; 1.87) (P < 0.001). Between-study heterogeneity was observed (Q value by Chi-squared [χ2] test 500.3, P < 0.0001). The risk of chronic kidney disease related to
HCV, in the subset of surveys from Asia was 1.45 (1.27; 1.65) (P < 0.001) (no heterogeneity). According to our meta-regression, ageing (P < 0.0001) and duration of follow-up (P < 0.0001) increased the risk of chronic kidney disease among HCV-positive sub-jects. We observed a relationship between anti-HCV positive serologic status and frequency of proteinuria, adjusted effect estimate of proteinuria with HCV among surveys was 1.633 (95% CI, 1,29; 2.05) (P < 0.001) (n = 10 studies; 315,404 unique patients). How-ever, between-studies heterogeneity was noted (P value by Q test < 0.0001). Conclusion.Conclusion.Conclusion.Conclusion.Conclusion. An association between HCV infection and increased risk of chronic kidney disease in the general population exists. The mechanisms underlying such association are cur-rently under active investigation.
Key words. Key words. Key words. Key words.
365
Association Between Hepatitis C Virus and Chronic Kidney Disease. , 2018; 17 (3): 364-391
P = 0.0001).
6However, between-studies heterogeneity
was noted (P value by Q test < 0.0001) and this precluded
more definitive results.
Several biological mechanisms have been advocated to
explain the increased risk of CKD in HCV-infected
indi-viduals. There is an association between HCV infection
and glomerular disease in native kidneys and after solid
or-gan transplant.
8Renal injury in HCV-positive patients can
also be given by endothelial dysfunction which is in turn
promoted by enhanced oxidative stress, pro-inflammatory
cytokines, insulin resistance, or non-alcoholic
steato-hep-atitis (NASH).
9-11The recent publication of additional and large studies
on this topic has led us to summarize again the scientific
evidence on the connection between chronic kidney
dis-ease and exposure to HCV infection. We have again
re-viewed the available evidence on the relationship between
HCV infection and the development of chronic kidney
disease in the adult general population by performing a
systematic review of the literature with a meta-analysis of
clinical observational studies.
MATERIAL AND METHODS
This work is in agreement with the Preferred
Report-ing Items for Systematic reviews and Meta-Analyses
state-ment (Annex 1).
12Search strategy and data extraction
English-language citations from the national Library of
Medicine’s Medline database from 1989 through
Decem-ber 1, 2017 were reviewed by two authors (F.F., and
F.M.D.). The first assay for HCV was manufactured in
1989 and data on HCV status are therefore not available for
the time before 1989. Our search was conducted by four
Medline databases engines (Embase, Grateful Med, Ovid,
and PubMed), and was limited to human studies.
The following algorithm in medical subject heading
and in free text words was applied: (“HCV’’ or “HCV
An-tibody Positive Serologic Status’’ or “Hepatitis C” or
“Hepatitis C Virus Infection”) and (“CKD’’ or “Chronic
Kidney Disease” or “End-Stage Renal Disease” or “ESRD”
or “Glomerulonephritis’’ or “Low Glomerular Filtration
Rate” or “kidney Failure’’ or “Kidney Impairment’’ or
“Kidney Insufficiency’’ or “Renal Failure’’ or “Renal
Im-pairment’’ or “Renal Insufficiency’’) and (“Interferon” or
“IFN’’ or “pegylated Interferon’’ or “peg-IFN’’ or
“Ribavi-rin”) and (‘‘DAAs’’) and (“Sustained Virological
Re-sponse’’ or “Sustained Viral ReRe-sponse’’ or ‘‘Cure’’) and
(“Hazard Ratio” or “HR”). We performed an additional
search with electronic searches of the Cochrane Library;
manual searches of selected specialty journals were done
to identify all pertinent literature. We also searched
refer-ence lists from qualitative topic reviews and published
clinical studies. It was previously demonstrated that a
Medline search alone might not be sensitive enough.
13Data on study design, study period, patient characteristics,
HCV prevalence, antiviral therapy towards HCV, and
kid-ney disease outcomes were abstracted. Authors of selected
papers were contacted to obtain missing data and only data
from individuals with known HCV status were included
in the meta-analysis. We achieved consensus for all data.
We compared studies to eliminate duplicate reports for
the same patients, which included contact with
investiga-tors when necessary. We pre-specified eligibility and
ex-clusion criteria. Our search was limited to human studies
that were published in the English literature.
Inclusion criteria
We enrolled studies if they met the following inclusion
criteria:
• They presented original data from cohort and
longitu-dinal studies;
• The outcome of interest was clearly defined as
fre-quency of chronic kidney disease, i.e., reduced
glomerular filtration rate and/or detectable proteinuria
in the adult general population according to anti-HCV
serologic status; and
• They provided adjusted risk estimates and their
confi-dence intervals. Both case-control studies and cohort
studies were considered as eligible for inclusion in the
analysis.
If data on the same population were duplicated in more
than one study, we included the most recent study in the
analysis. Information of HCV serologic status was
record-ed at the time of enrollment. We enrollrecord-ed studies were the
diagnosis of HCV infection was performed by testing for
anti-HCV antibody in serum and/or HCV RNA detection
by nucleic acid testing. Surveys based on administrative
codes (ICD-9) were also evaluated.
Ineligible studies
Fabrizi F, et al. , 2018; 17 (3): 364-391
366
Quality assessment
The quality of the 40 studies was appraised using a scale
adapted from the ‘Newcastle/Ottawa Scale (NOS)’.
14The
Newcastle-Ottawa scale is a scoring system that assesses
every aspect of an observational epidemiologic study from
a methodological point of view. When a study included
relevant information that could be associated with the
NOS, one point was added. Seven items in cross-sectional
studies and eight items in cohort and case-control studies
that could be related to the NOS were identified.
There-fore, cross-sectional studies assigned 8-10, 6-7, 4-5, or 0-3
points (stars) were evaluated as very good, good,
satisfac-tory or unsatisfacsatisfac-tory studies, respectively. Similarly,
co-hort/case-control studies with 7-9, 5-6, 4 and 0-3 points
(stars) were identified as very good, good, satisfactory or
unsatisfactory, respectively. We carried out subgroup
anal-yses based on those studies provided with very good
quali-ty. Data extraction and quality scoring were performed
independently by two reviewers (F.F. and F.M. D.) and
the results were merged by consensus. The complete
pro-tocol for quality scoring is available on-line (Annex 2A).
Outcomes measures
We made separate meta-analyses according to the
out-come. One meta-analysis included longitudinal studies
evaluating the incidence of chronic kidney disease,
anoth-er enrolled cross-sectional studies addressing the
preva-lence of chronic kidney disease. An additional
meta-analysis regarded the frequency of proteinuria (or
glomerular disease). Staging of chronic kidney disease was
categorized according to the Kidney Disease Outcomes
Quality Initiative (K/DOQI) definition, and estimated
glomerular filtration rate was calculated using the
four-variable MDRD equation.
15The primary end point was to provide adjusted
esti-mates of the risk (and 95% CIs) of incidence (or
preva-lence) of chronic kidney disease in the adult general
population according to anti-HCV serologic status.
Multi-variate analysis was carried out to evaluate the
independ-ent effect of anti-HCV positive status on the frequency of
chronic kidney disease after adjustment for potential
con-founders (covariates) (e.g., age, gender, race/ethnicity,
dia-betes mellitus, and others). Cox proportional hazard
regression analysis and logistic regression analysis were
carried out in longitudinal and cross-sectional studies,
re-spectively. An additional end-point was the adjusted
esti-mate of the risk (and 95% CIs) of frequency of proteinuria
(or glomerular disease) in the adult general population
ac-cording to anti-HCV serologic status.
Data synthesis and analysis
We weighted the study-specific log hazard ratios by the
inverse of their variance to obtain a pooled effect estimate
and its 95% confidence intervals. For each study, we used
the estimate of the effect measure that was adjusted for the
largest number of confounders. We present both
fixed-ef-fects and random-effixed-ef-fects pooled estimates but use and
re-port the latter when heterogeneity was present. We used
the random-effects approach, as described by
DerSimoni-an DerSimoni-and Laird,
16Cochrane Q-test was used for quantifying
the heterogeneity.
17The I
2statistic, which is the
percent-age of total variation across studies due to heterogeneity
rather than chance, was also calculated.
18The null
hypoth-esis of this test is the presence of homogeneity (absence of
heterogeneity). We explored the origin of heterogeneity
by restricting the analysis to subgroups of studies defined
by study characteristics such as country of origin, response
to antiviral therapy, and others. Heterogeneity was also
evaluated by meta-regression in order to look at the effect
of potential and continuous covariates on the outcome of
interest. Subgroup or stratified analyses and
meta-regres-sion were pre-specified. We performed random-effects
meta-regression using the method of moments or
maxi-mum likelihood approaches where appropriate, a single
predictor is allowed in each model (simple
meta-regres-sion). Publication bias was assessed by the Egger test for
funnel-plot asymmetry. All analyses were done with the
statistical package Comprehensive Meta-Analysis (CMA),
version 2.0 (Biostat Inc., USA, 2005). The 5% significance
level was adopted for
α
risk. Every estimate was given with
its 95% Confidence Intervals.
RESULTS
Literature review
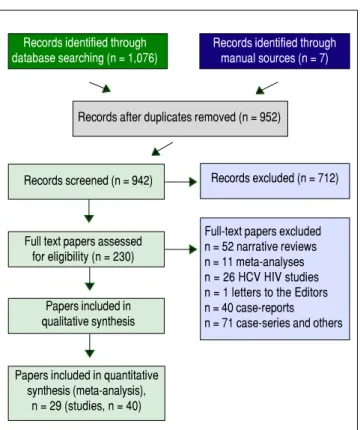
As shown in figure 1, we retrieved 4,533 articles and 230
full-text papers were assessed for eligibility. The list of
the 230 full-text papers is reported in the Annex 3. Forty
studies met our inclusion criteria and were published in
29 papers (Figure 1) and carried out in 3 continents (n =
4,072,867 patients).
19-47Thus, some studies contributed
data on more than one kidney disease outcome, but each
cohort was represented once in any meta-analysis. There
was a 100% concordance between reviewers with respect
to final inclusion and exclusion of studies reviewed based
on the predefined inclusion and exclusion criteria.
367
Association Between Hepatitis C Virus and Chronic Kidney Disease. , 2018; 17 (3): 364-391
In one report the diagnosis of HCV was recorded by
his-torical collection of hepatitis C history (individual
inter-views).
44Anti-HCV serologic status and occurrence of
CKD were detected in the remaining surveys by
laborato-ry tests.
19-23,28,29,31,32,34-43The relationship between HCV infection, as detected
by positive HCV RNA in serum, and chronic kidney
dis-ease was addressed in three reports only. Two studies
evaluated the link between positive HCV RNA status and
incidence of ESRD;
29,45one evaluated the prevalence of
CKD according to HCV RNA status.
32Patient characteristics
Supplemental tables 1-8 report some salient
demo-graphic and clinical characteristics of subjects enrolled in
the included studies. The mean age of subject cohorts
ranged from 37.6 to 61.9 ± 14 years. The gender
distribu-tion ranged from 31.2% to 95.7% male. Eighteen studies
were from the US, thirteen were from Taiwan, and three
from Europe. There were two reports from Japan, China
and Quatar, respectively. The average follow-up ranged
between 1.6 ± 0.2 to 16.8 years among longitudinal studies.
The quality scores ranged between 4 and 7 (longitudinal
studies) (Annex 2B), and 5 and 7 (cross-sectional studies)
(data not shown).
Figure 1. Figure 1. Figure 1.
Figure 1. Figure 1. Flow diagram of study selection.
Summary estimate of outcome:
Incidence of CKD (reduced eGFR)
Fifteen longitudinal studies (n = 2,299,134 unique
pa-tients; 295,773 HCV-positive and 2,003,361 HCV-negative
patients) gave information on the incidence of CKD
among HCV-positive subjects.
19-33We found a significant
association between positive anti-HCV serologic status
and increased incidence of CKD, adjusted HR with HCV
across the surveys, 1.54 (95% CI, 1.26; 1.87) (P < 0.001).
Test for homogeneity of the aHR across the fifteen studies
gave a Q value (by Chi-squared [χ
2] test) of 500.3, I
2=
97.2% (P = 0.0001); that is, the homogeneity assumption
was rejected (Table 1). The funnel plot concerning the
publication bias is reported in figure 2. The Egger test
demonstrated no publication bias (P = 0.2). Figure 3
re-ports the aHR and 95% confidence intervals for each study.
Summary estimate of outcome:
Prevalence of CKD (reduced eGFR)
Fifteen studies (n = 865,494 unique patients; 81,054
HCV-positive and 784,175 HCV-negative patients)
evalu-ated the prevalence of CKD in HCV-infected patients.
20-22,34-45We found no association between positive
anti-HCV serologic status and increased prevalence of
CKD, adjusted OR with HCV across the studies, 1.04
(95% CI, 0.91; 1.31) (P = 0.33). Tests for homogeneity of
the aOR across the fifteen studies gave a Q value (by χ
2test) of 96.2 (I
2= 85.4) (P = 0.0001); in other words, the
homogeneity assumption was rejected (Table 1). The
Egg-er test demonstrated no publication bias (P = 0.12).
Fig-ure 4 reports the aOR and 95% confidence intervals for
each study.
The adjusted effect estimate of the occurrence of CKD
among HCV RNA positive patients was 1.64 (95% CI,
1.32; 2.048) (P = 0.0001). Heterogeneity statistics, Q value
(by χ
2test) = 1.23 (P-value = 0.54).
Summary estimate of outcome:
Frequency of proteinuria
Ten studies (n = 378,769 unique patients; 63,365
HCV-positive and 315,404 HCV-negative patients) evaluated the
frequency of proteinuria according to anti-HCV positive
serologic status.
33,34,36-39,42,43,46,47We found a significant
as-sociation between positive anti-HCV serologic status and
increased frequency of proteinuria, adjusted risk of
pro-teinuria associated with HCV across the surveys, 1.633
(95% CI, 1,29; 2.05) (P < 0.001). Test for homogeneity of
the adjusted risk or proteinuria across the ten studies gave
a Q value (by χ
2test) of 37.47 (I
2= 75.9%) (P = 0.0001);
that is, the homogeneity assumption was rejected (Table 2).
Records identified through manual sources (n = 7) Records identified through
database searching (n = 1,076)
Records after duplicates removed (n = 952)
Records screened (n = 942) Records excluded (n = 712)
Full text papers assessed for eligibility (n = 230)
Papers included in qualitative synthesis
Papers included in quantitative synthesis (meta-analysis),
n = 29 (studies, n = 40)
Fabrizi F, et al.
, 2018; 17 (3): 364-391
368
Supplemental Table 1. Longitudinal studies included in the meta-analysis (outcome: incidence of chronic kidney disease) (I).
Authors Crook E Tsui J Moe S Asrani S Butt A
Reference year 2005 2007 2008 2010 2011
Country USA USA USA USA USA
Patients, n 312 474,369 7,038 88,822 43,139
Follow-up, years 1.6± 0.2/2.1 ± 0.1 3.6 3.46 2.1 ±1.05 3.1± 1.4/3 ± 1.3
Anti-HCV positive patients, n 26 (8.3%) 52,874 (11.1%) 2,243 (31.8%) 8,063 (9.1%) 18,002 (41.7%) Age, years 55.6 ± 2/60.5 ± 0.78 52 ± 9/59 ± 13 42.2 ± 11 48.7 ± 8/43.2 ± 11 51.9 ± 7/52.8 + 7 Male, n 110 (35%) 447,494 (94.3%) 3,481 (49.5%) 37,724 (42.4%) 41,974 (97.3%)
Caucasian, n 49 (15.7%) 318,854 (67%) 3,556 (50.5%) NA 24,347 (56%)
Diabetes mellitus, n 312 (100%) 120,692 (25%) 1,319 (18.7%) 9,317 (10.4%) 10,809 (25%)
Outcome ESRD ESRD CKD stages 3-5 CKD stages 3-5 CKD stages 3-5
Adjusted HR (95% CI) 3.49 (1.27; 9.57) 2.8 (2.43, 3.23) 0.89 (0.79; 1.015) 0.92 (0.79; 1.08) 1.3 (1.23; 1.37)
Supplemental Table 3. Longitudinal studies included in the meta-analysis (outcome: incidence of chronic kidney disease) (III).
Authors Molnar M Hwang J Rogal S Lai T Park H
Reference year 2015 2016 2016 2017 2017
Country USA Taiwan USA Taiwan USA
Patients, n 1,021,049 19,574 71,528 19,984 225,792
Follow-up, years 8.0 12 4.9±2/5.9 ± 2.8 16.8 1.75
Anti-HCV positive patients, n 100,518 (9.8%) 9,787 (50%) 2,589 (3.6%) 591 (2.9%) 56,448 (25%)
Age, years 54.5 ± 13 55.7 ± 12.1 51 (43; 57)/55 (51; 59) 47.3 ± 10 NA
Male, n 939,365 (92%) 10,044 (51.3%) 68,463 (95.7%) 9,804 (49.1%) 137,231 (60.7%)
Caucasian, n 705,537 (69%) NA 40,647 (56.8%) NA NA
Diabetes mellitus, n 216,933 (21.2%) 19,574 (100%) 17,593 (24%) 1,616 (8.1%) 36,739 (16.3%)
Outcome ESRD ESRD CKD stages 3-5 ESRD CKD stages 3-5
Adjusted HR (95% CI) 1.98 (1.81; 2.16) 1.47 (1.1; 1.93) 0.86 (0.79; 0.92) 2.33 (1.40; 3.89) 1.27 (1.18; 1.37) Supplemental Table 2. Longitudinal studies included in the meta-analysis (outcome: incidence of chronic kidney disease) (II).
Authors Hofmann J Su F Chen Y Chen Y Lee J
Reference year 2011 2012 2013 2014 2014
Country Sweden Taiwan Taiwan Taiwan Taiwan
Patients, n 222,536 37,746 15,910 47,150 4,185
Follow-up, years 9.3 5.58 ± 2.04 5.8/5.92 7.1/7.43 2.2 ± 1.6
Anti-HCV positive patients, n 25,412 (11.4%) 6,291 (16.6%) 3,182 (20%) 9,430 (20%) 317 (7.6%)
Age, years 37.6/NA NA NA NA 61.9 ± 14
Male, n 69.1%/NA 19,074 (50.5%) 8,095 (50.8%) 23,365 (49.5%) 2,447 (58.5%)
Caucasian, n 89.2%/NA NA NA NA NA
Diabetes mellitus, n 3.7%/NA NA 981 (6.2%) 7,792 (16.5%) 1,504 (36.2%)
Outcome CKD stages 1-5 ESRD CKD stages 1-5 CKD Stages 1-5 ESRD
369
Association Between Hepatitis C Virus and Chronic Kidney Disease.
, 2018; 17 (3): 364-391
Supplemental Table 5. Cross-sectional studies included in the meta-analysis: prevalence of chronic kidney disease (II).
Authors Asrani S. Lee J. Derbala M. Aoufi Rabih S. Lin M.
Reference year 2010 2010 2010 2012 2013
Country USA Taiwan Quatar Spain Taiwan
Patients, n 167,569 54,966 300 265 3,352
Anti-HCV 13,384 5,189 233 120 187
positive patients, n (7.9%) (9.4%) (77.7%) (72.7%) (5.6%)
Age, years 47.8 ± 8.6 / 40.4 ± 11.8 60.8 ± 11.5 46 (41; 53) 56 ± 16.6 / 55.3 ± 15.7 47.5 ± 17.4
Male, n 75,577 17,168 239 140 1,629
(45%) (31.2%) (79.7%) (53%) (48.6%)
Caucasian, n NA NA 0 NA 0
Diabetes 11,614 5,302 138 25 191
mellitus, n (6.9%) (9.6%) (46%) (9%) (5.6%)
Study design CS CS CS CS CS
Outcome Low eGFR, Low eGFR, Low eGFR, Low eGFR, CKD
< 60 < 60 < 60 < 60
mL/min mL/min mL/min mL/min
per 1.73 m2 per 1.73m2 per 1.73m2 per 1.73m2
Adjusted OR 0.90 1.3 1.12 18.3 0.65
(95% CI) (0.36; 2.27) (1.2; 1.42) (0.5; 1.5) (2.3; 143) (0.45; 0.94)
Supplemental Table 4. Cross-sectional studies included in the meta-analysis: prevalence of chronic kidney disease (I).
Authors Tsui J Tsui J Dalrymple L Ishizaka N Moe S
Reference year 2006 2007 2007 2008 2008
Country USA USA USA Japan USA
Patients, n 15,029 474,369 25,782 12,535 13,139
Anti-HCV positive patients, n 366 (2.4%) 52,874 (11.1%) 1,928 (7.5%) 72 (0,6%) 3,938 (30%)
Age, years NA 52+9/59 ± 13 53 ± 9/58 ± 14 59.2 ± 10/53.1 ± 10 41.9 ± 12.7
Male, n 7,136 (47%) 447,492 (94%) 23,462 (91%) 8,054 (64.2%) 6,434 (48.9%)
Caucasian, n 11,367 (75.6%) 318,854 (67%) 14,580 (56%) NA 6,858 (52%)
Diabetes mellitus, n 751 (5%) 120,691 (25.4%) 5,533 (21.5%) NA 2,996 (22.8%)
Study design CS CS CS CS CS
Outcome Low eGFR, < 60mL/min Low eGFR, < 60 mL/min Renal insufficiency, serum Low eGFR, < 60 mL/min Low eGFR, < 60 mL/min per 1.73 m2 per 1.73 m2 creatinine > 1.5 mg/dL per 1.73 m2 per 1.73 m2
Fabrizi F, et al.
, 2018; 17 (3): 364-391
370
Supplemental Table 6. Cross-sectional studies included in the meta-analysis: prevalence of chronic kidney disease (III).
Authors Li W. Zeng Q. Kurbanova N. Su S. Lai T.
Reference year 2014 2014 2015 2015 2017
Country Taiwan China USA Taiwan Taiwan
Patients, n 24,642 15,549 33,729 10,463 13,805
Anti-HCV positive 1,699 94 659 NA 431
patients, n (6.9%) (0.6%) (1.9%) (3.1%)
Age, years 42.9 ± 14.5 49.2 + 9.3 49.8 54 + 15.1 47.5 ± 10
Male, n 12,827 10,909 16,284 5,218 6,601
(52.1%) (67.5%) (48%) (49.8%) (47.8%)
Caucasian, n 0 NA 16,147 0 0
(47.9%)
Diabetes NA 1,508 4,143 3,182 335
mellitus, n (9.7%) (12.2%) (30.4%) (0.02%)
Study design CS CS CS CCS CS
Outcome CKD CKD CKD CKD CKD
Adjusted OR 1.24 0.74 0.88 1.22 1.91
(95% CI) (1.05; 1.48) (0.18; 3.04) (0.57; 1.37) (0.85; 1.74) (1.27; 2.88)
Supplemental Table 7. Studies included in the meta-analysis: frequency of proteinuria (or glomerular disease) (I).
Authors Liangpunsakul S. Tsui J. Huang J. Ishizaka N. Derbala M.
Reference year 2005 2006 2006 2008 2010
Country USA USA Taiwan Japan Quatar
Patients, n 13,990 15,029 9,934 12,535 300
Anti-HCV 368 366 646 72 233
positive patients, n (2.6%) (2.4%) (6.5%) (0.6%) (77.7%)
Age, years 47.6 ± 19 NA 55.2 ± 6 53.1 ± 10.6 46 (41; 53)
Male, n 7,192 7,136 4,291 8,054 239
(46.9%) (47.5%) (43.1%) 1(64.2%) (79.9%)
Caucasian, n 10,505 11,367 0 0 NA
(68.5%) (75.6%)
Diabetes 1,349 751 1,241 NA 138
mellitus, n (8.8%) (5%) (12.5%) (46%)
Study type Nested case-control CS CS CS CS
Outcome Urine albumin Spot urine Urine Urine albumin Albumin
excretion/ albumin/ protein ≥ 1+ excretion ratio Creatinine ratio, creatinine ratio, creatinine ratio, (UAER), > 30 mg/g > 2.2 mg/mmol
≥ 30 mcg/mg > 17 mcg/mg
Adjusted OR 1.99 1.38 1.648 1.59 1.4
371
Association Between Hepatitis C Virus and Chronic Kidney Disease.
, 2018; 17 (3): 364-391
Supplemental Table 8. Studies included in the meta-analysis: frequency of proteinuria (or glomerular disease) (II).
Authors Lee J. Aoufi Rabih S. Zeng Q. Kurbanova N. Park H.
Reference year 2010 2012 2014 2015 2017
Country Taiwan Spain China USA USA
Patients, n 54,966 265 15,549 33,729 222,472
Anti-HCV 5,189 120 94 659 55,618
positive (9.4%) (72.7%) (0.6%) (1.9%) (25%)
patients, n
Age, years 60.8 ± 11.5 56 + 16/ 49.2 ± 9.3 49.8 ± 18.7 NA
55.3 ± 15
Male, n 17,168 140 10,509 16,284 137,231
(31.2%) (52.8%) (67.5%) (48.2%) (60.7%)
Caucasian, n NA NA 0 16,147 NA
(47.9%)
Diabetes 5,302 25 1,508 4,143 36,739
mellitus,n (9.6%) (9%) (9.7%) (12.2%) (16.3%)
Study type CS CS CS CS Longitudinal
Outcome Urine Microalbuminuria/ Albumin Urine MPGN
protein, > 1 + creatinine, Excretion albumin
> 30 mcg/L ratio, creatinine
> 30 mg/g ratio, > 30 mg/g
Adjusted effect 1.14 2.05 1.3 1.95 2.23
estimate (1.0; 1.3) (0.98; 4.29) (0.32; 5.32) (1.11; 3.41) (1.84; 2.71)
(95% CI)
Fabrizi F, et al. , 2018; 17 (3): 364-391
372
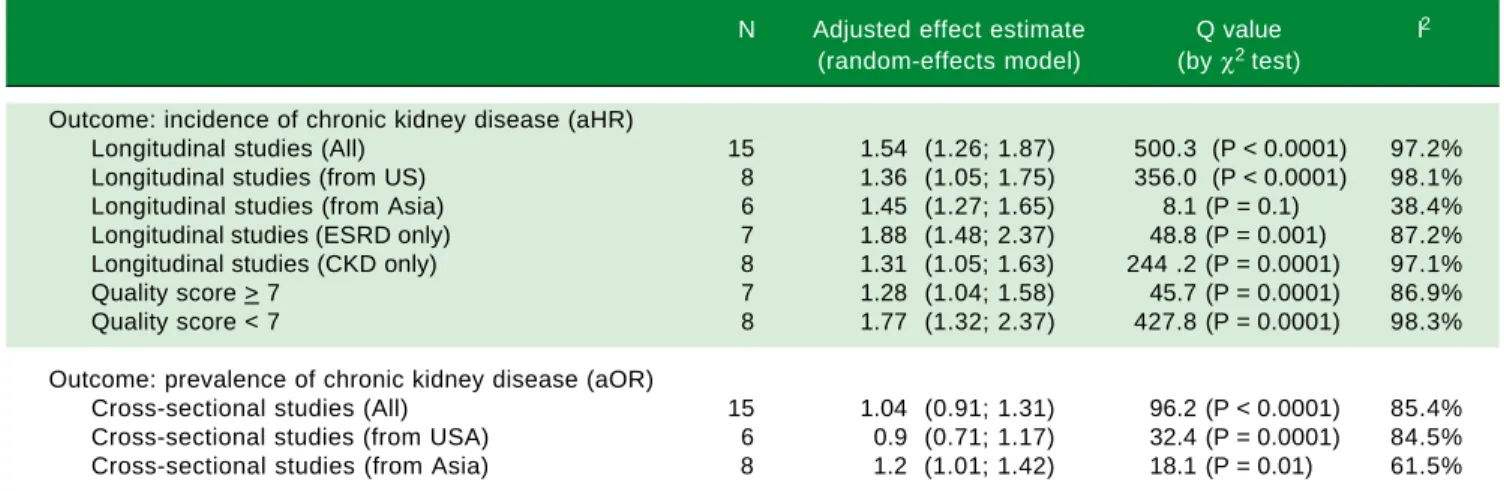
Table 1. Summary measure for adjusted effect estimate of CKD according to anti-HCV serologic status among various groups of in-terest.
N Adjusted effect estimate Q value I2
(random-effects model) (by χ2 test)
Outcome: incidence of chronic kidney disease (aHR)
Longitudinal studies (All) 15 1.54 (1.26; 1.87) 500.3 (P< 0.0001) 97.2%
Longitudinal studies (from US) 8 1.36 (1.05; 1.75) 356.0 (P< 0.0001) 98.1%
Longitudinal studies (from Asia) 6 1.45 (1.27; 1.65) 8.1 (P= 0.1) 38.4%
Longitudinal studies (ESRD only) 7 1.88 (1.48; 2.37) 48.8 (P= 0.001) 87.2%
Longitudinal studies (CKD only) 8 1.31 (1.05; 1.63) 244 .2 (P= 0.0001) 97.1%
Quality score > 7 7 1.28 (1.04; 1.58) 45.7 (P= 0.0001) 86.9%
Quality score < 7 8 1.77 (1.32; 2.37) 427.8 (P= 0.0001) 98.3%
Outcome: prevalence of chronic kidney disease (aOR)
Cross-sectional studies (All) 15 1.04 (0.91; 1.31) 96.2 (P< 0.0001) 85.4%
Cross-sectional studies (from USA) 6 0.9 (0.71; 1.17) 32.4 (P= 0.0001) 84.5%
Cross-sectional studies (from Asia) 8 1.2 (1.01; 1.42) 18.1 (P= 0.01) 61.5%
• Crook, et al.:18 HR adjusted for renal function at baseline, urine protein excretion, blood pressure, gender, race, presence
of diabetic nephropathy, age, duration of diabetes, and renin angiotensin system inhibitors at baseline.
• Tsui, et al.:19 HR adjusted for age, gender, race/ethnicity, educational status, smoking status, comorbidities.
• Moe, et al.:20 HR adjusted for age, gender, race, baseline GFR, diabetes, hypertension, AST, HIV.
• Asrani, et al.:21 HR adjusted for age, gender, baseline GFR, comorbidities (cirrhosis, diabetes, hypertension, heart failure,
peripheral vascular disease, coronary artery disease, chronic obstructive pulmonary disease, diabetes, HIV), drug abuse, alcohol abuse, depression, diuretics, inhibitors of the renin-angiotensin system.
• Butt, et al.:22 HR adjusted for age, gender, race, baseline eGFR, hypertension, smoking, chronic obstructive pulmonary
dis-ease, diabetes, dyslipidemia, anemia, alcohol abuse, drug abuse, ACEi/ARB use, decompensated liver disease.
• Hofmann, et al.:23 HR adjusted for age, gender.
• Su, et al.:24 HR adjusted for gender, age, occupation, urbanization level, CCI.
• Chen, et al.:25 HR adjusted for age, gender, diabetes, hypertension, coronary artery disease, hyperlipidemia, liver cirrhosis,
geographic region, urbanization level, enrolee category, number of healthcare visits in 1 year before study entry.
• Chen, et al.:26 HR adjusted for gender, age, diabetes, hypertension, coronary artery disease, hyperlipidemia, cirrhosis,
ge-ographic region, urbanization level, enrolee category, number of medical visits in 1 year before study entry.
• Lee, et al.:27 HR adjusted for gender, marital status, educational status, herb use, HBV infection, comorbidity (diabetes
mel-litus, hypertension, mild liver disease, severe liver disease, cardiovascular disease), body mass index, haemoglobin, plate-lets, ALT, cholesterol, uric acid, glucose, CKD stage, urine protein/creatinine ratio.
• Molnar, et al.:28 HR adjusted for age, gender, ethnicity, baseline eGFR, comorbidities (diabetes, hypertension,
cardiovascu-lar disease, congestive heart failure, cerebrovascucardiovascu-lar disease, peripheral vascucardiovascu-lar disease, lung disease, dementia, rheu-matic disease, malignancy, HIV, depression), body mass index, systolic blood pressure, diastolic blood pressure, socioeconomic parameters (income, marital status, service connection), adherence to medical interventions, medical ad-herence, number of healthcare encounters during the follow-up, number of prescribed antihypertensive medications and ACEi/ARB usage throughout follow-up.
• Hwang, et al.:29 HR adjusted for age, gender, comorbidity (hypertension, coronary artery disease, hyperlipidemia, gout,
liv-er cirrhosis, HBV).
• Rogal, et al.:30 HR adjusted for age, race, gender, body mass index, diabetes, hypertension, cirrhosis, alcohol abuse or
de-pendence, drug abuse or dede-pendence, ACEi/ARB use at baseline.
• Lai, et al.:31 HR adjusted for age, gender, diabetes, hypertension, baseline chronic kidney disease, serum cholesterol,
trig-lycerides, uric acid, urinary protein excretion.
• Park, et al.:32 HR adjusted for age, gender, cirrhosis, diabetes, comorbidities (hypertension, diabetes, dyslipidemia, alcohol
use, drug abuse, chronic obstructive pulmonary disease, heart failure, peripheral vascular disease, cerebrovascular dis-ease, coronary artery disdis-ease, hepatitis A, hepatitis B, HIV, cirrhosis, hepatocellular carcinoma), ACEi/ARB, change of co-morbidities, change of medication use.
• Tsui, et al.:19 OR adjusted for age, gender, race/ethnicity, educational status, smoking status, diabetes, arterial
hyperten-sion.
• Tsui, et al.:33 OR adjusted for age, gender, race/ethnicity, comorbidities (diabetes, hypertension, chronic obstructive
pulmo-nary disease, congestive heart failure, coropulmo-nary artery disease, HIV, substance abuse).
• Dalrymple, et al.:34 OR adjusted for age, gender, race, diabetes, hypertension.
• Ishizaka, et al.:35 OR adjusted for age, gender, systolic blood pressure, HBsAg, and fasting plasma glucose.
• Moe, et al.:20 OR adjusted for age, gender, diabetes, hypertension, AST, HIV status, laboratory values (rheumatoid factor,
cryoglobulins).
• Asrani, et al.:21 OR adjusted for age, gender, comorbidities (cirrhosis, diabetes, hypertension, coronary artery disease,
373
Association Between Hepatitis C Virus and Chronic Kidney Disease. , 2018; 17 (3): 364-391
• Lee, et al.36 OR adjusted for age, gender, educational status, BMI, albumin level, cholesterol level, uric acid level,
hyperten-sion, diabetes mellitus.
• Derbala, et al.:37 OR adjusted for age, gender.
• Aoufi Rabih, et al.:38 OR adjusted for age, gender, diabetes, hypertension, obesity, rheumatic disease.
• Lin, et al.:39 OR adjusted for age, gender, years of education, annual income, medical history (hypertension, diabetes
melli-tus, cardiovascular disease, stroke, gout, liver disease, urinary tract disease, cancer), health-related behaviors (oral and intravenous analgesic use, cigarette smoking, alcohol drinking, health supplements, Chinese herbs use, betel-nut chewing, Long Dan Xie Gan Tang).
• Li, et al.:40 OR adjusted for age, gender, alcohol drinking status, hypertension, serum creatinine, BMI, waist-to-height ra-tion, fasting glucose, cholesterol, triglycerides, uric acid.
• Zheng, et al.:41 OR adjusted for age, gender, HBV, hypertension, diabetes mellitus, BMI, albumin, high-density cholesterol
low-density cholesterol, triglycerides, total cholesterol, uric acid.
• Kurbanova, et al.:42 OR adjusted for age, gender, race, hypertension, diabetes, BMI.
• Su, et al.:43 OR adjusted for gender, age, obesity, income, HBV status, uric acid levels, anaemia, hyperlipidemia, smoking status, alcoholic status, betel nut chewing, exercise habits, groundwater use.
• Lai, et al.:44 OR adjusted for age, male, literate status, cigarette smoking, alcohol consumption, diabetes, hypertension,
heart disease, HBsAg status, uric acid levels, serum cholesterol, serum triglycerides.
1 2 3 4 5 6 7 8 9 10 11 12 13 14 15 10.0
7.50
5.00
2.50
HR
Figure 3. Figure 3. Figure 3.
Figure 3. Figure 3. aHR and 95% confidence intervals for each study (n = 15 longi-tudinal studies; n = 2,299,134 unique patients) (Outcome: incidence of CKD). aHR of CKD associated with HCV (longitudinal surveys), 1.54 (95% CI, 1,26; 1.87) (P < 0.001). Q value by χ2 test, 500.3 (P = 0.0001), I2 =
97.2%
Figure 4. Figure 4. Figure 4. Figure 4.
Figure 4. aOR and 95% confidence intervals for each study (n = 9 cross-sectional studies; n = 156,297 unique patients) (Outcome: prevalence of pro-teinuria). aOR of proteinuria associated with HCV (cross-sectional surveys), 1.51 (95% CI, 1,25; 1.82) (P < 0.001). Q value by χ2 test, 15.5 (P = 0.049),
I2 = 48.7%.
OR
7.00
5.00
3.00
1.00
1 2 3 4 5 6 7 8 9
Precision (1/Std Err)
40
30
20
10
0
-2.0 -1.5 -1.0 -0.5 0.0 0.5 1.0 1.5 2.0 Log Hazard ratio
Figure 2. Figure 2.Figure 2.
Figure 2.Figure 2. Funnel plot of precision by Log Hazard Ratio (n = 15 longitudinal studies; n = 2,299,134 unique patients) (Outcome: incidence of CKD).
The Egger test demonstrated no publication bias (P =
0.33). Figure 4 reports the aOR and 95% confidence
inter-vals for each cross-sectional study.
Stratified analysis
and meta-regression
As shown in tables 1 and 2, our stratified analysis
showed some substantial differences in pooled aHR
across various subgroups. There was a significant
associa-tion between anti-HCV positive serologic status and
prev-alence of chronic kidney disease among studies coming
from Asia, 1.2 (1.01; 1.42) (P < 0.01) (Table 1);
heteroge-neity persisted, Q value (by χ
2test) of 32.4 (P = 0.0001).
Fabrizi F, et al. , 2018; 17 (3): 364-391
374
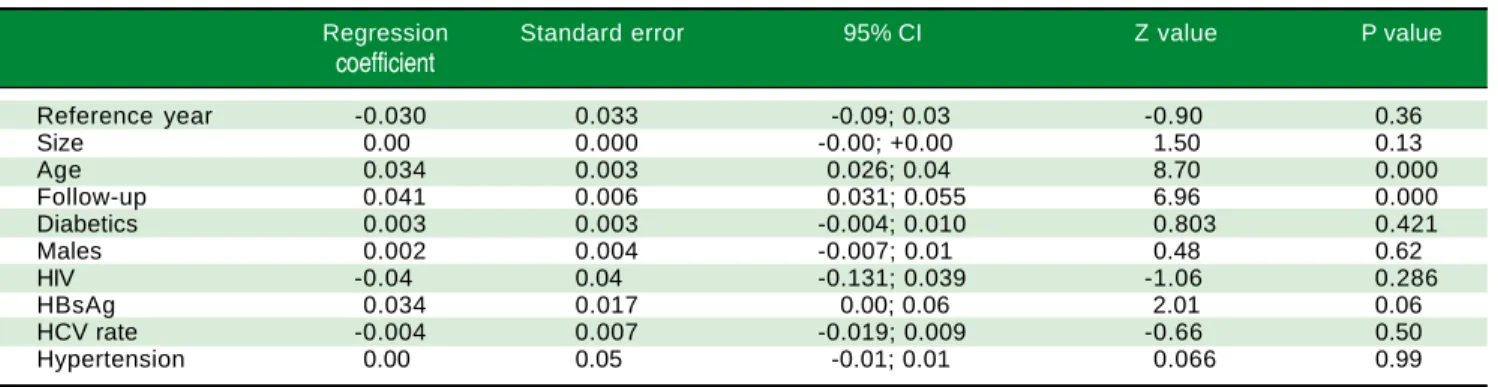
Table 3. Meta-regression: Impact of continuous variables on aHR (n = 15 studies, n = 2,299,134 unique patients) (incidence of CKD).
Regression Standard error 95% CI Z value P value
coefficient
Reference year -0.030 0.033 -0.09; 0.03 -0.90 0.36
Size 0.00 0.000 -0.00; +0.00 1.50 0.13
Age 0.034 0.003 0.026; 0.04 8.70 0.000
Follow-up 0.041 0.006 0.031; 0.055 6.96 0.000
Diabetics 0.003 0.003 -0.004; 0.010 0.803 0.421
Males 0.002 0.004 -0.007; 0.01 0.48 0.62
HIV -0.04 0.04 -0.131; 0.039 -1.06 0.286
HBsAg 0.034 0.017 0.00; 0.06 2.01 0.06
HCV rate -0.004 0.007 -0.019; 0.009 -0.66 0.50
Hypertension 0.00 0.05 -0.01; 0.01 0.066 0.99
Table 4. Meta-regression: Impact of continuous variables on adjusted effect estimate (n = 10 studies, n = 315,404 unique patients) (frequency of proteinuria).
Regression Standard 95% CI Z value P value
coefficient error
Reference year 0.02 0.02 -0.017; 0.06 1.10 0.26
Size 0.000 0.000 -0.000; 0.000 1.43 0.151
Age -0.034 0.010 -0.054; -0.013 -3.25 0.001
Diabetics -0.001 0.008 -0.018; 0.016 -0.117 0.90
Males 0.008 0.005 -0.002; 0.019 1.5 0.132
HBsAg -0.03 0.01 -0.067; -0.005 -2.27 0.022
HCV 0.0006 0.003 -0.006; 0.008 0.18 0.85
Hypertension 0.067 0.014 0.038; 0.09 4.50 0.001
Table 2. Summary measure for adjusted effect estimate (outcome: frequency of proteinuria or glomerular disease) according to anti-HCV serologic status among various groups of interest.
N Adjusted effect estimate Q value (by χ2 test) I 2
(random-effects model)
Outcome: proteinuria (frequency)
All studies 10 1.63 (1.29; 2.05) 37.4 (P = 0.000) 75.9%
US studies 4 1.95 (1.58; 2.39) 4.3 (P = 0.22) 30.6%
Asian studies 5 1.33 (1.09; 1.62) 6.1 (P = 0.18) 34.88%
Studies based on dipstick analysis 2 1.33 (0.93; 1.90) 5.35 (P = 0.02) 81%
Studies based on spot urine albumin/creatinine ratio 7 1.66 (1.36; 2.01) 3.1 (P = 0.7) 0.0
Cross-sectional studies 8 1.41 (1.18; 1.67) 10.3 (P = 0.1) 32.2%
Outcome: proteinuria (prevalence) aOR
Cross-sectional and nested case-control studies 9 1.51 (1.25; 1.82) 15.5 (P = 0.049) 48.7%
Outcome: proteimuria (prevalence) aOR
• Liangpunsakul, et al.:45 OR adjusted for age, race, hypertension, gender, body mass index.
• Tsui, et al.:33 OR adjusted for age, gender, race/ethnicity, educational status, smoking status, diabetes, hypertension.
• Huang, et al.:46 OR adjusted for diabetes, hypertension, BMI, age, triglycerides, gender, ALT, total cholesterol, triglycerides,
HBsAg status.
• Ishizaka, et al.:35 OR adjusted for age, gender, systolic blood pressure, fasting plasma glucose, ALT, HBsAg status.
• Lee, et al.:36 OR adjusted for age, gender, educational status, BMI, hemoglobin level, albumin level, cholesterol level, uric
acid level, hypertension, diabetes mellitus.
• Derbala, et al.:37 OR adjusted for diabetes, age, gender, cryoglobulinemia, creatinine.
• Aoufi Rabih, et al.:38 OR adjusted age, gender, hypertension, diabetes, obesity, rheumatic disease.
• Zeng, et al.: 41 OR adjusted for age, gender, BMI, albumin, hypertension, diabetes, total cholesterol, triglycerides,
low-den-sity lipoprotein cholesterol.
• Kurbanova, et al.: 42 OR adjusted for age, gender, race, hypertension, diabetes, BMI.
• Park, et al.:32 HR adjusted for age, gender, calendar year, comorbidities (hypertension, dyslipidemia, diabetes, chronic
375
Association Between Hepatitis C Virus and Chronic Kidney Disease. , 2018; 17 (3): 364-391
Tables 3 and 4 report the impact of continuous
varia-bles on the aHR (incidence of CKD) and proteinuria
fre-quency among anti-HCV positive patients
(meta-regression analysis). As reported in table 3,
meta-re-gression demonstrated a positive impact of ageing (P <
0.0001) and duration of follow-up (P < 0.0001) on the
ad-justed HR of incidence of CKD among HCV-positive
pa-tients.
DISCUSSION
There is growing evidence in the medical literature
suggesting that HCV infection is not a liver-focused
dis-ease but a systemic illness giving several extra-hepatic
(in-cluding renal) manifestations. This meta-analysis (n = 40
studies; 4,072,867 patients) includes a number of reports
almost double compared to the previous one and confirms
the higher risk of chronic kidney disease among
HCV-in-fected patients, aHR, 1.43 (95% CI, 1.23; 1.63) (P =
0.0001). This result has been observed in longitudinal
studies (n = 15) provided with large size and appropriate
follow-ups. Also, a higher rate of proteinuria among
HCV-infected patients was recorded, adjusted effect estimate of
proteinuria with HCV among surveys was 1.633 (95% CI,
1,29; 2.05) (P < 0.001) (n = 10 studies; 315,404 unique
pa-tients). The findings reported here are in keeping with
other pieces of evidence; cohort studies carried out among
individuals with biopsy-proven glomerular disease
48or
diabetic nephropathy
49and patients with HCV-HIV
co-in-fection
50suggested a consistent link between anti-HCV
positive serologic status and incidence or progression of
chronic kidney disease. Antiviral therapy towards HCV
has been able to slow down the progression of chronic
kidney disease in HCV-infected populations. In a
retro-spective observational cohort of patients with stage 3
CKD, regression models reported that sustained viral
re-sponse was associated with a 9.3 (95% CI, 0.44 to 18) mL/
min per 1.73 m
2increase in eGFR during the 6-month
post-treatment follow-up period.
51IFN-based therapies
improved renal survival among diabetics,
52liver transplant
recipients,
53and HCV-HIV infected patients.
54The relationship between anti-HCV positive status and
prevalence of chronic kidney disease was not significant in
many comparisons. The lack of an appropriate follow-up
could explain the discrepancy between longitudinal and
cross-sectional studies. According to our meta-regression
analysis, the impact of HCV on the incidence of CKD was
more prominent in those longitudinal studies provided
with longer follow-ups and aged populations. The
strati-fied analysis showed a consistent association between
anti-HCV positive serologic status and prevalence of chronic
kidney disease in the subset of Asian studies (1.2, 95% CI,
1.01; 1.42) (P < 0.001). This conferred robustness to the
current meta-analysis even if significant between-study
heterogeneity persisted in several comparisons. According
to our meta-regression, the impact of HCV on the
inci-dence of CKD was more evident in those longitudinal
studies provided with longer follow-ups and aged
popula-tions.
The findings from the current meta-analysis present
several limitations. First, many reports show retrospective
and cohort design- from a theoretical point of view, a
ran-domized controlled trial with placebo gives the best
evi-dence on the efficacy of an intervention. However, a large
sample and a long follow-up are needed to perform a RCT
in this setting as the frequency of events is low; also, the
current availability of safe and effective drugs (DAAs) for
the treatment of HCV makes the randomisation to
place-bo not ethically acceptable. Secondly, multivariate analysis
was performed in all the studies retrieved in the current
meta-analysis but residual confounding (confounding
re-maining after adjustment) cannot be excluded as full
infor-mation was not given on various confounders. As an
example, data on life style, illicit drug abuse, and family
history were often missed. Thirdly, our stratified analysis
and meta-regression was not able to capture the sources of
the great heterogeneity we have observed. The high
heter-ogeneity suggests that all the studies included in the
analy-sis are not functionally identical and this precluded the
adoption of a fixed-effects model. Fourth, the relationship
between HCV infection, as detected by positive HCV
RNA in serum, and chronic kidney disease was addressed
in a few surveys. Moreover, individual data from each
study (‘meta-analysis at patient level’) were not available;
thus, it was impossible to perform our own adjustments
even if the studies included in this meta-analysis adjusted
for numerous factors (‘covariates’) that could prove to be
potential confounders. Finally, as with all meta-analyses,
this study has the potential limitation of publication bias
as negative or non-significant studies are less likely to be
published (“file-drawer effect”).
55One approach to
ad-dress this topic is to gather data from as many sources as
possible. On the other hand, we have not included trials
published as abstracts; information presented in abstract
format is often without high quality and can give greater
treatment effect.
We need more studies based on nucleic acid tests
(in-stead of serological assays) to evaluate the link between
HCV infection and occurrence of CKD. CKD appears
more frequently in viraemic patients than HCV negative
individuals. As reported above, this information was not
available in most studies; however, the absence of
statisti-cal heterogeneity confers reliability to our results.
Fabrizi F, et al. , 2018; 17 (3): 364-391
376
renal disease among patients with chronic HCV have been
described. In the context of membrano-proliferative
glomerular disease, HCV gives glomerular damage
through activation and deposition of cryoglobulins. Also,
HCV may cause tubulo-interstitial damage via a direct
cy-topathic effect or antibody immune complex.
Additional-ly, non-immunological pathways (i.e., oxidative stress,
pro-inflammatory cytokines, and others) help the
devel-opment of renal disease by vascular injury.
56Some
investi-gators addressed the influence of HCV eradication on
extra-hepatic outcomes. In a prospective French study, 668
cirrhotic patients (50.5%) underwent antiviral treatment
for HCV and achieved SVR; they had a lower risk of
cardi-ovascular events (HR, 0.42; 95% CI, 0.25-0.69; P = 0.001)
and bacterial infections (HR, 0.44; 95% CI, 0.29-0.68; P <
0.001).
57This meta-analysis of observational studies shows a
link between anti-HCV positive serologic status and
great-er frequency of low eGFR and/or abnormal proteinuria in
the adult general population. We need more studies in
or-der to identify the pathophysiological mechanisms unor-der-
under-lying such association and to deepen the sources of the
heterogeneity identified. In the meantime, early initiation
of antiviral therapy for HCV is encouraged to improve
kidney survival regardless staging of liver disease.
ABBREVIATIONS
•
ACEi:
angiotensin-converting enzyme inhibitor.
•
AH:
arterial hypertension.
•
aHR:
adjusted hazard ratio.
•
ALT:
alanine aminotransferase.
•
aOR:
adjusted odds ratio.
•
ARB:
angiotensin II receptor blocker.
•
aRR:
adjusted relative risk.
•
AST:
aspartate aminotransferase.
•
CI:
confidence intervals.
•
CKD:
chronic kidney disease.
•
CNI:
calcineurin inhibitors.
•
CRF:
chronic renal failure.
•
CV:
cardiovascular.
•
DAAs:
direct-acting antiviral agents.
•
DM:
diabetes mellitus.
•
eGFR:
estimated glomerular filtration rate.
•
EOT:
end of treatment.
•
ESRD:
end-stage renal disease.
•
GN:
glomerulonephritis.
•
HCV:
hepatitis C virus.
•
HD:
haemodialysis.
•
HIV:
human immunodeficiency virus.
•
ICD-9-CM:
International Classification of Diseases:
Ninth Revision: Clinical Modification.
•
IFN:
interferon.
•
ITT:
intention-to-treat analysis.
•
MC:
mixed cryoglobulinemia.
•
MDRD:
modification of diet in renal disease.
•
NA:
not available.
•
NOS:
Newcastle/Ottawa Scale.
•
NSAID:
non-steroidal anti-inflammatory drug.
•
PRISMA:
Preferred Reporting Items for Systemic
Reviews and Meta-Analyses statement.
•
RBV:
ribavirin.
•
SVR:
sustained virological response.
FUNDING
No sources of funding were used for the preparation of
this manuscript.
CONFLICT OF INTEREST STATEMENT
Fabrizio Fabrizi: consultant or advisor to AbbVie,
Mer-ck & Co; Maria Francesca Donato: speaker bureau
Abbv-ie, Gilead, MSD.
REFERENCES
1. Pol S, Corouge M. Treatment of hepatitis C: perspectives.
Med Mal Infect 2014; 44: 449-54.
2. Grignoli R, Goossens N, Negro F. Extra-hepatic
manifesta-tions of HCV. Minerva Gastroenterol Dietol 2015; 61: 31-8.
3. World Health Organization. Global hepatitis report, 2017.
Ex-ecutive summary. Available from: http://www.who.int/hepa- titis/publications/global-hepatitis-report2017-executive-summary/en/(WHO reference number: WHO/HIV/2017.06).
4. Hill N, Fatoba S, Oke J, Hirst J, O’Callaghan C, Lasserson D,
Hobbs R. Global prevalence of chronic kidney disease- a
systematic review and meta-analysis. PLoS One 2016; 11:
e0158765.
5. Park H, Adeyemi A, Henry L, Stepanova M, Younossi Z. A
meta-analytic assessment on the risk of chronic kidney
dis-ease in patients with chronic hepatitis C virus infection. J
Vi-ral Hepat 2015; 22: 897-905.
6. Fabrizi F, Verdesca S, Messa P, Martin P. Hepatitis C virus
infection increases the risk of developing chronic kidney
dis-ease: A systematic review and meta-analysis. Dig Dis Sci
2015; 60: 3801-13.
7. Li M, Wang P, Yang C, Jiang W, Wei X, Mu X, Li X, et al. A
systematic review and meta-analysis: Does hepatitis C virus infection predispose to the development of chronic kidney
disease? Oncotarget 2017; 8: 10692-702.
8. Sansonno D, Lauletta G, Montrone M, Grandaliano G, Schena
F. Hepatitis C virus RNA and core protein in kidney glomeru-lar and tubuglomeru-lar structures isolated with laser capture
micro-dissection. Clin Exp Immunol 2005; 140: 498-506.
9. Adinolfi L, Zampino R, Restivo L, Lonardo A, Guerrera B,
Marrone A, Nascimbeni F, et al. Chronic hepatitis C virus in-fection and atherosclerosis: clinical impact and mechanisms.
World J Gastroenterol 2014; 20: 3410-7.
10. Byrne C, Targher G. NAFLD: a multisystem disease. J
377
Association Between Hepatitis C Virus and Chronic Kidney Disease. , 2018; 17 (3): 364-391
11. Gill K, Ghazinian H, Manch R, Gish R. Hepatitis C virus as a
systemic disease: reaching beyond the liver. Hepatol Int
2016; 10: 415-23.
12. Moher D, Liberati A, Tetzlaff J, Altman D, Prisma Group. Pre-ferred reporting items for systematic reviews and
meta-analyses: the PRISMA statement. J Clin Epidemiol 2009; 62:
1006-12.
13. Poynard T, Conn H. The retrieval of randomised clinical trials in liver diseases from medical literature. A comparison of
MED-LARS and manual methods. Control Clin Trials 1985; 6: 271-9.
14. Wells G, Shea B, O’Connell D, Peterson J, Welch V, Losos M, Tugwell P. The Newcastle-Ottawa scale (NOS) for assess-ing the quality of nonrandomised studies in meta-analyses. Ottawa Health Research Institute website. Available at: http/ www.ohri.ca/programs/clinical_epidemiological/oxford.asp. Accessed 16 August 2012.
15. National Kidney Foundation. K/DOQI clinical practice guide-lines for chronic kidney disease: evaluation, classification,
and stratification. Am J Kidney Dis 2002; 39: S1-S266.
16. DerSimonian R, Laird N. Meta-analysis in clinical trials.
Con-trol Clin Trials 1986; 7: 177-88.
17. Petitti D. Approaches to heterogeneity in meta-analysis. Stat
Med 2001; 20: 3625-33.
18. Higgins J, Thompson S, Deeks J, Altman D. Measuring
incon-sistencies in meta-analysis. Br J Med 2003; 327: 557-60.
19. Crook E, Penumalee S, Gavini B, Filippova K. Hepatitis C is a
predictor of poorer survival in diabetic patients. Diabetes
Care 2005; 28: 2187-91.
20. Tsui J, Vittinghoff E, Shlipak M, Bertenthal D, Inadomi J, Rod-riguez R, O’Hare A. Association of hepatitis C seropositivity with increased risk for developing end-stage renal disease.
Arch Int Med 2007; 167: 1271-6.
21. Moe S, Pampalone A, Ofner S, Rosenman M, Teal E, Hui S. Association of hepatitis C virus infection with prevalence
and development of kidney disease. Am J Kidney Dis 2008;
51: 885-92.
22. Asrani S, Buchanani P, Pinsky B, Rocca Rey L, Schnitzler M, Kanwal F. Lack of association between hepatitis C infection
and chronic kidney disease. Clin Gastroenterol Hepatol
2010; 8: 79-84.
23. Butt A, Wang X, Fried L. HCV and the incidence of CKD. Am
J Kidney Dis 2011; 57: 396-402.
24. Hofmann J, Torner A, Chow W, Ye W, Purdue M, Duberg A. Risk of kidney cancer and chronic kidney disease in relation to hepatitis C virus infection: a nationwide register-based
co-hort study in Sweden. Eur J Cancer Prev 2011; 20: 326-30.
25. Su F, Su C, Chang S, Chen P, Sung F, Lin C, Yeh C. Associa-tion of hepatitis C virus infecAssocia-tion with risk of ESRD: a
popula-tion-based study. Am J Kidney Dis 2012; 60: 553-60.
26. Chen Y, Chiou W, Hung S, Su Y, Hwang S. Hepatitis C virus itself is a causal risk factor for chronic kidney disease be-yond traditional risk factors: a 6-year nationwide cohort
study across Taiwan. BMC Nephrology 2013; 14: 187.
27. Chen Y, Lin H, Li C, Lee M, Su Y. A nationwide cohort study suggests that hepatitis C virus infection is associated with
increased risk of chronic kidney disease. Kidney Int 2014,
85: 1200-07.
28. Lee J, Lin M, Chang J, Hung C, Chang J, Chen H, Yu M, et al. Hepatitis C virus infection increases risk of developing
end-stage renal disease using competing risk analysis. Plos One
2014; 9: e100790.
29. Molnar M, Alhourani H, Wall B, Lu L, Streja E, Kalantar-Zadeh K, Kovesdy C. Association of hepatitis C virus infection with incidence and progression of chronic kidney disease in a
large cohort of US veterans. Hepatology 2015; 61:
1495-502.
30. Hwang J, Jiang M, Lu Y, Weng S. Impact of HCV infection on
diabetes patients for the risk of end-stage renal failure.
Med-icine 2016; 95: e2431.
31. Rogal S, Yan P, Rimland D, Lo Re V, Al-Rowais H, Fried L, Butt A, et al. Incidence and progression of chronic kidney disease after hepatitis C seroconversion: results from
ER-CHIVES. Dig Dis Sci 2016; 61: 930-6.
32. Lai T, Lee M, Yang H, You S, Lu S, Wang L, Yuan Y, et al. High hepatitis C viral load and genotype 2 are strong
predic-tors of chronic kidney disease. Kidney Int 2017; http://
dx.doi.org/10.1016/j.kint.2017.03.02.
33. Park H, Chen C, Wang W, Henry L, Cook R, Nelson D. Chronic hepatitis C increases the risk of chronic kidney disease while
effective treatment decreases the incidence of CKD.
Hepatol-ogy 2017. Doi: 10.1002/hep.29505 [Epub ahead of print].
34. Tsui J, Vittinghoff E, Shlipak M, O’Hare A. Relationship be-tween hepatitis C an chronic kidney disease: Results from
the Third National Health and Nutrition Examination Survey. J
Am Soc Nephrol 2006; 17: 1168-74.
35. Dalrymple L, Koepsell T, Sampson J, Louie T, Dominitz J, Young B, Kestenbaum B. Hepatitis C virus infection and the
prevalence of renal insufficiency. Clin J Am Soc Nephrol
2007; 2: 715-21.
36. Ishizaka N, Ishizaka Y, Seki G, Nagai R, Yamakado M, Koike K. Association between hepatitis B/C viral infection, chronic kidney disease and insulin resistance in individuals
undergo-ing general health screenundergo-ing. Hepatology Research 2008;
38: 775-83.
37. Lee J, Lin M, Yang Y, Lu S, Chen H, Hwang S. Association of hepatitis C and B virus infection with CKD in an endemic
area in Taiwan: a cross-sectional study. Am J Kidney Dis
2010; 56: 23-31.
38. Derbala M, Shebl F, Rashid A, Amer A, Bener A. Microalbu-minuria in hepatitis C-genotype 4: effect of pegylated
inter-feron and ribavirin. World J Gastroenterol 2010; 16:
1226-31.
39. Aoufi Rabih S, Agudo R, Burillo J, Carrillo F, Gonzalez P, Roldan F, Ferrus M, et al. Microalbuminuria and renal
insuffi-ciency in chronic hepatitis C virus infection. Gastroenterol
Hepatol 2012; 35: 309-16.
40. Lin M, Chiu Y, Lee C, Yu H, Chen H, Wu M, Hwang S. Fac-tors associated with CKD in the elderly and nonelderly
popu-lation. Clin J Am Soc Nephrol 2013; 8: 33-40.
41. Li W, Lee Y, Chen I, Wang S, Hsiao C, Loke S. Age and gen-der differences in the relationship between hepatitis C
in-fection and all stages of chronic kidney disease. J Viral
Hepatitis 2014; 21: 706-15.
42. Zeng Q, Gong Y, Dong S, Xiang H, Wu Q. Association be-tween exposure to hepatitis B virus and chronic kidney
dis-ease in China. Int Med Res 2014; 42: 1178-84.
43. Kurbanova N, Qayyum R. Association of hepatitis C virus
in-fection with proteinuria and glomerular filtration rate. Clin
Transl Sci 2015; 8: 421-4.
44. Su S, Lin C, Kao S, Wu C, Lu K, Lai C, Yang H, et al. Risk factors and their interaction on chronic kidney disease: a
multicentre case control study in Taiwan. BMC Nephrology
2015; 16: 83.
45. Lai T, Lee M, Yang W, You S, Lu S, Wang L, Yuan Y, et al. Hepatitis C viral load, genotype, and increased risk of
devel-oping end-stage renal disease: REVEAL-HCV study.
Hepa-tology 2017; 66: 784-93.
46. Liangpunsakul S, Chalasani N. Relationship between
hepati-tis C and microalbuminuria: results from the NHANES III.
Kid-ney Int 2015; 67: 285-90.
hep-Fabrizi F, et al. , 2018; 17 (3): 364-391
378
atitis B and C infections: another chain of link? J Int Med
2006, 260: 255-62.
48. Noureddine L, Usman S, Yu Z, Moorthl R, Moe S. Hepatitis C increases the risk of progression of chronic kidney disease
in patients with glomerulonephritis. Am J Nephrol 2010; 32:
311-6.
49. Soma J, Saito T, Taguma Y, Chiba S, Sato H, Sugimura K, Ogawa S, et al. High prevalence and adverse effect of hep-atitis C virus infection in type II diabetic-related nephropathy.
J Am Soc Nephrol 2000; 11: 690-9.
50. Fabrizi F, Dixit V, Martin P, Messa P. Hepatitis C virus in-creases the risk of kidney disease among HIV-positive
pa-tients: Systematic review and meta-analysis. J Med Virol
2016; 88: 487-97.
51. Sise M, Backman E, Ortiz G, Hundemer G, Ufere N, Chute D, Brancale J, et al. Effect of sofosbuvir-based hepatitis C
vi-rus therapy on kidney function in patients with CKD. Clin J
Am Soc Nephrol 2017; 12: 1615-23.
52. Hsu Y, Lin J, Ho H, Kao Y, Huang Y, Hsiao N, Wu M, et al. Antiviral treatment for hepatitis C virus infection is associat-ed with improvassociat-ed renal and cardiovascular outcomes in
dia-betic patients. Hepatology 2014; 59: 1293-302.
53. Ble M, Aguilera V, Rubin A, Garcia-Eliz M, Vinaixa C, Prieto M, Berenguer M. Improved renal function in liver transplant recipients treated for hepatitis C virus with a sustained
viro-logical response and mild chronic kidney disease. Liver
Transplant 2014; 20: 25-34.
54. Kovari H, Rauch A, Kouyos R, Rougemont M, Cavassini M, Schmid P, Stockle M, et al.; for the Swiss HIV Cohort Study. Hepatitis C infection and the risk of non-liver-related morbidi-ty and mortalimorbidi-ty in HIV-infected persons in the Swiss HIV
Cohort Study. Clin Infect Dis 2017; 64: 490-7.
55. Crawford J, Briggs C, Engeland C. Publication bias and its
im-plications for evidence-based clinical decision making. J
Dental Education 2010; 74: 593-600.
56. Fabrizi F, Donato F, Messa P. Hepatitis C and its metabolic
complications in kidney disease. Ann Hepatol 2017; 16:
851-61.
57. Nahon P, Bourcier V, Lavese R, Audureau E, Cagnot C, Mar-cellin P, Guyader D, et al. Eradication of hepatitis C virus in-fection in patients with cirrhosis reduces risk of liver and
non-liver complications. Gastroenterology 2017; 152: 142-56.
Correspondence and reprint request: Fabrizio Fabrizi, M.D.
Divisione Nefrologica, Ospedale Maggiore, Pad. Croff, Via Commenda 15, 20122, Milano, Italia.
379
Association Between Hepatitis C Virus and Chronic Kidney Disease. , 2018; 17 (3): 364-391
Annex 1. PRISMA 2009 checklist. PRISMA’s items and their application within the paper.
Section/topic N Checklist item Reported .
on page n
TITLE
Title 1 Identify the report as a systematic review, meta-analysis, or both. 1
ABSTRACT
Structured 2 Provide a structured summary including, as applicable: background; objectives; 2
summary data sources; study eligibility criteria, participants, and interventions;
study appraisal and synthesis methods; results; limitations; conclusions and implications of key findings; systematic review registration number.
INTRODUCTION
Rationale 3 Describe the rationale for the review in the context of what is already known. 4
Objectives 4 Provide an explicit statement of questions being addressed with reference 5
to participants, interventions, comparisons, outcomes, and study design (PICOS).
METHODS
Protocol 5 Indicate if a review protocol exists, if and where it can be accessed
and registration (e.g., Web address), and, if available, provide registration information
including registration number.
Eligibility criteria 6 Specify study characteristics (e.g., PICOS, length of follow-up) and report 7
characteristics (e.g., years considered, language, publication status) used as criteria for eligibility, giving rationale.
Information 7 Describe all information sources (e.g., databases with dates of coverage, 6-7
sources contact with study authors to identify additional studies) in the search and
date last searched.
Search 8 Present full electronic search strategy for at least one database, 6-7
including any limits used, such that it could be repeated.
Study selection 9 State the process for selecting studies (i.e., screening, eligibility, 6-7
included in systematic review, and, if applicable, included in the meta-analysis).
Data 10 Describe method of data extraction from reports (e.g., piloted forms, 7
collection process independently, in duplicate) and any processes for obtaining and confirming
data from investigators.
Data items 11 List and define all variables for which data were sought (e.g., PICOS, 8-9
funding sources) and any assumptions and simplifications made.
Risk of bias in 12 Describe methods used for assessing risk of bias of individual studies 8-9
individual studies (including specification of whether this was done at the study or outcome level),
and how this information is to be used in any data synthesis.
Summary measures 13 State the principal summary measures (e.g., risk ratio, difference in means). 9-10
Synthesis 14 Describe the methods of handling data and combining results of studies, 9-10
of results if done, including measures of consistency (e.g., I2) for each meta-analysis.
Risk of bias 15 Specify any assessment of risk of bias that may affect the cumulative evidence 9-10
across studies (e.g., publication bias, selective reporting within studies).
Additional 16 Describe methods of additional analyses (e.g., sensitivity or subgroup analyses, 9-10
analyses meta-regression), if done, indicating which were pre-specified.
RESULTS
Study selection 17 Give numbers of studies screened, assessed for eligibility, and included in 11
Fabrizi F, et al. , 2018; 17 (3): 364-391
380
Study 18 For each study, present characteristics for which data were extracted Tables 1-8
characteristics (e.g., study size, PICOS, follow-up period) and provide the citations.
Risk of bias 19 Present data on risk of bias of each study and, if available, any outcome Tables 1-8
within studies level assessment (see item 12).
Results of 20 For all outcomes considered (benefits or harms), present, for each study: Tables 1-8
individual (a) simple summary data for each intervention group (b) effect estimates
studies and confidence intervals, ideally with a forest plot.
Synthesis of 21 Present results of each meta-analysis done, including confidence intervals 12-13
results and measures of consistency. Tables
9-10
Risk of bias 22 Present results of any assessment of risk of bias across studies (see Item 15). 12-13
across studies Tables
9-10
Additional 23 Give results of additional analyses, if done 13-14
analysis (e.g., sensitivity or subgroup analyses, meta-regression [see Item 16]). Tables
11-12
DISCUSSION
Summary 24 Summarize the main findings including the strength of evidence for each main 15
of evidence outcome; consider their relevance to key groups (e.g., healthcare providers,
users, and policy makers).
Limitations 25 Discuss limitations at study and outcome level (e.g., risk of bias), and at 16
review-level (e.g., incomplete retrieval of identified research, reporting bias).
Conclusions 26 Provide a general interpretation of the results in the context of other evidence, 17
and implications for future research.
FUNDING
Funding 27 Describe sources of funding for the systematic review and other support 18
(e.g., supply of data); role of funders for the systematic review.