Essays on the Mexican stock market
140
0
0
Texto completo
(2) 2016. PhD in Economics. Essays on the Mexican Stock Market. PhD in Economics. César Amador Ambriz. César Amador Ambriz.
(3) PhD in Economics Thesis title:. Essays on the Mexican Stock Market. PhD student:. César Amador Ambriz Advisors:. Concepció Patxot Cardoner Marta Gómez-Puig. Date: May 2016.
(4)
(5)
(6) A mi familia. Lo peor y lo mejor de ser un obrero de la pasión, es que los frutos dolorosos de tu poca o mucha inteligencia son tu único, tu verdadero salario. Mercedes Oliver. Agradezco a la Dra. Concepció Patxot Cardoner y a la Dra. Marta Gómez Puig por sus enseñanzas en el salón de clases y por su valioso apoyo en la etapa final de este proceso. Estimado Dr. José Antonio García-Durán de Lara, es usted sabedor de mi aprecio y reconocimiento, muchas gracias por todas las atenciones que siempre tuvo para su servidor, aún después de su jubilación. Apreciado amigo Zeus Salvador Hernández Veleros, gracias por las recomendaciones, enseñanzas, y el acompañamiento durante este proceso. My deep affection and acknowledgment to Dana Coble and Peace Corps for reviewing the manuscript. Mi gratitud a la Dra. Elisenda Paluzie i Hernàndez por su intervención y atenciones. Estimado Jordi Roca Solanelles gracias por ayudarme siempre. Quarma, gracias por el apoyo y sugerencias. Quizá ahora si podamos realizar ese proyecto y el viaje pospuesto indefinidamente, ¿no crees?. Por mi propio derecho y para los fines legales a que haya lugar, de conformidad con lo dispuesto en el Artículo 19, Fracción XI, del Reglamento de Becas del CONACYT y el Reglamento de Operación del PRODEP, agradezco a estas dos instituciones el apoyo financiero brindado, haciendo mención del crédito respectivo para la realización de los estudios del programa de Doctorado en Economía y el presente trabajo de Tesis. Agradezco también el apoyo brindado por la Universidad Autónoma del Estado de Hidalgo. Se da cumplimiento así a lo convenido en los contratos respectivos y al objeto de los apoyos.. iii.
(7) iv.
(8) Essays on the Mexican Stock Market Index General Introduction ........................................................................................................... 1. Chapter 1: The Stock Market and Economic Growth in Mexico ........................................ 9 Section I: Introduction .................................................................................................... 9 Section II: Theoretical Foundations .............................................................................. 11 2.1 The link between stock markets and economic growth ...................................... 11 2.1.1 Macroeconomic and microeconomic perspectives .......................................... 14 2.1.2 The functions of financial markets and growth ................................................ 18 2.2 Causality between financial sector development and economic growth, does the financial sector cause growth, or follow it? .............................................................. 19 2.3 Reforms to the financial sector in Mexico: some relevant issues ....................... 21 Section III: Econometric Analysis ................................................................................ 26 3.1 The Vector Error Correction Model (VECM)..................................................... 26 3.2 The Autoregressive Distributed Lag model (ADL) ............................................ 29 3.3 Superexogeneity: the conditional equation, the marginal equation and stability of the parameters ........................................................................................................... 31 Section IV: Estimation Methodology............................................................................ 33 4.1 Description of data and descriptive statistics ...................................................... 33 4.2 Model Specification ............................................................................................ 37 4.3 Results ................................................................................................................. 38 4.3.1 VECM estimation............................................................................................. 38 4.3.2 ADL estimation ................................................................................................ 42 4.3.3 Testing for superexogeneity ............................................................................ 47 Section V: Conclusions ................................................................................................. 51. Chapter 2: Business group affiliation, corporate governance and firm profitability in Mexico .............................................................................................................................. 53 Section I: Introduction .................................................................................................. 53 Section II: Literature Review ........................................................................................ 54 2.1 On the importance of corporate governance for firm's growth, soundness of the financial markets and economic development .......................................................... 54. v.
(9) 2.2 Corporate governance and rent extraction .......................................................... 58 2.3 Business Groups .................................................................................................. 61 2.3.1 Advantages of business groups ........................................................................ 61 2.3.2 Disadvantages of business groups .................................................................... 62 2.4 Business Groups in Mexico ................................................................................ 63 Section III: Econometric Analysis ................................................................................ 66 3.1 Estimation Technique.......................................................................................... 66 3.2 GMM levels ........................................................................................................ 67 3.3 GMM differences ................................................................................................ 68 3.4 GMM system....................................................................................................... 68 Section IV: Estimation Methodology............................................................................ 70 4.1 Data ..................................................................................................................... 70 4.2 Performance Model ............................................................................................. 76 4.3 Results ................................................................................................................. 76 Section V. Conclusions ................................................................................................. 81. Chapter 3: On using a Transfer Function Model for the price discovery of stock returns: maybe Beta is all that matters. .......................................................................................... 83 Section I: Introduction .................................................................................................. 83 Section II: Theory and Evidence of the CAPM ............................................................ 85 2.1 The Model assumptions ...................................................................................... 85 2.2 The Markowitz and Sharpe Models .................................................................... 86 2.3 The literature review ........................................................................................... 93 Section III: The Transfer Function Model. ................................................................... 98 Section IV: Results...................................................................................................... 102 4.1 Data ................................................................................................................... 102 4.2 Transfer function model estimation .................................................................. 103 Section V: Conclusions ............................................................................................... 111. General Conclusions ....................................................................................................... 113. References: ...................................................................................................................... 117. vi.
(10) Figure Index Figure 1: Temporal evolution of financial and macroeconomic variables ........................ 35 Figure 2: ADL model for LGDPCLC, actual fitted residual graph................................... 48 Figure 3: ADL model for LGDPPCCLC, actual fitted residual graph.............................. 48 Figure 4: ADL model for LGDPCLC, Cusum and Cusum-Squares stability test ............ 49 Figure 5: ADL model for LGDPCLC, recursive estimates for the coefficients of lagged variables in levels. ............................................................................................................. 49 Figure 6: Actual and fitted values for IPC. ..................................................................... 104 Figure 7: Actual and fitted values for FEMSA ............................................................... 106 Figure 8: Actual and fitted values for CEMEX............................................................... 107 Figure 9: Actual and fitted values for GFNORTE .......................................................... 108 Figure 10: Actual and fitted values for GMEXICO ........................................................ 109. Table Index. Table 1: Definition of the Financial and Economic Variables .......................................... 33 Table 2: Descriptive Statistics of the Financial and Economic Variables ........................ 34 Table 3: Correlations of the Financial and Economic Variables....................................... 34 Table 4: Unit root tests, Financial and Economic variables in levels ............................... 36 Table 5: Unit root tests, Financial and Economic variables in first differences ............... 37 Table 6: Cointegration Test (Trace), for LGDPCLC, ST, BC; 3 lags, model 3. ............... 38 Table 7: Cointegration Test (Maximum Eigenvalue) for LGDPCLC, ST, BC; 3 lags, model 3.............................................................................................................................. 39 Table 8: Cointegration Test (Trace), for LGDPPCCLC, ST, BC; 4 lags, model 3. .......... 39 Table 9: Cointegration Test (Maximum Eigenvalue) for LGDPPCCLC, ST, BC; 4 lags, model 3.............................................................................................................................. 39 Table 10: Short run dynamics of VEC estimates (p-values) ............................................. 39 Table 11: Granger causality tests ...................................................................................... 40 Table 12: ECT parameters of VEC estimates ................................................................... 41 Table 13: Log run VEC equations .................................................................................... 42 Table 14: ADL and Superexogeneity regressions ............................................................. 44 Table 15: F-type critical values for level relationship....................................................... 46 Table 16: T-type critical values for level relationship ...................................................... 46 Table 17: F-type statistic for level relationship ................................................................. 47 Table 18: Ticker of companies under profitability and affiliation analysis ...................... 70 Table 19: Business Groups in México .............................................................................. 72 Table 20: Descriptive Statistics of variables for profitability and affiliation analysis ...... 74 Table 21: Correlation Coefficients, variables used for profitability and affiliation analysis ........................................................................................................................................... 75 Table 22: Regression Results, profitability model ............................................................ 77. vii.
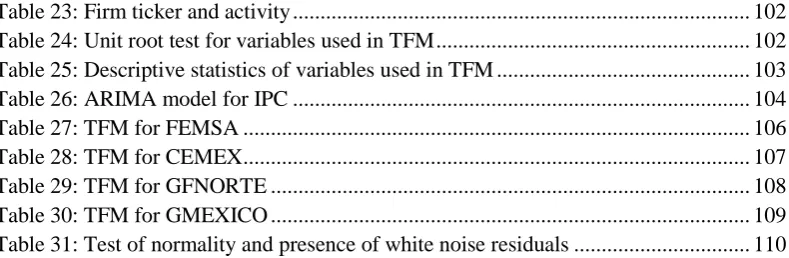
(11) Table 23: Firm ticker and activity ................................................................................... 102 Table 24: Unit root test for variables used in TFM ......................................................... 102 Table 25: Descriptive statistics of variables used in TFM .............................................. 103 Table 26: ARIMA model for IPC ................................................................................... 104 Table 27: TFM for FEMSA ............................................................................................ 106 Table 28: TFM for CEMEX............................................................................................ 107 Table 29: TFM for GFNORTE ....................................................................................... 108 Table 30: TFM for GMEXICO ....................................................................................... 109 Table 31: Test of normality and presence of white noise residuals ................................ 110. viii.
(12) General Introduction Raising living standards has been the focus of economic development theories, in this regard there is a whole range of analysis and proposals that countries can adopt to accelerate the rates of economic growth, reduce poverty levels, and create more and better employment opportunities. But to achieve these goals, according to Meier (1989), countries will have to eliminate what he calls the four constraints for development: 1. Low savings1. 2. Foreign Exchange Constraint 3. The low level of agricultural development 4. Underdevelopment of human resources. Eliminating such restrictions in various fronts, will contribute to economic development. To this end, financial sector reforms can be linked to strategies to eliminate or alleviate the first two restrictions. The fundamental aspect of financial reform is to mobilize more resources through savings and in turn, funding the most attractive investments. In Mexico financial liberalization policies were designed to eliminate the so-called problem of financial repression2 and left the resource allocation to market forces. In order to reform the financial sector, several measures were undertaken, the liberalization of interest rates, the reduction of reserve ratios, and the elimination of discretionary allocations of credit; in Mexico these measures were further complemented with bank privatization (Hernandez-Murillo, 2007). After implementing the macroeconomic stabilization policies, several countries have undertaken measures to liberalize trade and the capital account in order to achieve greater efficiency and economic growth.. 1. ... a vicious circle of poverty that runs from low real income to low savings to low investment to low productivity and then back to low real income (Meier, 1989, p. 64). 2. The term "financial repression" was coined by McKinnon (1973) and Shaw (1973) and is defined as follows: “When governments tax and otherwise distort their domestic capital market, the economy is said to be financially repressed”.. 1.
(13) With all these measures, there was a large capital inflow to Mexico. However, after the 1994 crisis, the country lost its attractiveness to investors. The rise of other emerging markets, the lack of confidence in the Mexican economy, weak institutions to protect investors’ rights, unethical practices and corporate scandals within the country, finally undermined its position in international portfolios. Economic literature provides different perspectives on the theoretical link between financial development and economic growth and there is still a lively debate on whether financial liberalization measures accelerate growth; or, the sector's development is simply a consequence of economic growth that creates a demand for more sophisticated financial products. Until now, the empirical evidence remains mixed. The literature identifies four perspectives regarding the direction of causality between financial sector development and economic growth. The first of these postulates that improved financial intermediation contributes to the growth in two ways: a) improving the accumulation and the marginal productivity of capital, b) increasing the rate of savings and investment. The most well-known proponents of this position are McKinnon (1973) and Shaw (1973). The second corresponds to the case where causality goes from the economy to the financial sector (Robinson, 1952). The third says that causality is bidirectional, Demetriades and Hussein (1996), Greenwood and Smith (1997). Finally, the fourth corresponds to the Lucas critique (1988), stating that there is no causality. Tests done in developing countries to determine causation are not entirely conclusive, mainly due to lack or insufficient data, Wolde-Rufael (2009), Ortiz et al (2002), Federici and Caprioli (2009), Hondroyiannis and Lolos (2005). Usually the econometric technique utilized to test causality relies on Vector Error correction (VEC) or Vector Autoregressive (VAR) models that with a limited number of observations, the degrees of freedom of the model rapidly diminish. Therefore it forced to include only the most relevant variables; or to use quarterly or monthly data, or explore this relationship using panel data models, Demetriades and Hussein (1996), Baltagi et al (2009), Pradhan et al (2015). The objective of the first chapter is to determine if in México the financial sector causes economic growth as postulated in the “supply leading. 2.
(14) hypothesis” of McKinnon (1973) and Shaw (1973). To test this hypothesis, a VEC model is employed using a longer period, from 1960 to 2013. The results of an Autoregressive Distributed Lag (ADL) model are presented as well as super exogeneity tests, developed by Pesaran et al (2001) and Engle & Hendry (1993) respectively; both barely used in this context with the notable exceptions of Ang (2008) and Yang & Hoon-Yi (2008). The motivation to utilize VEC and ADL models is to contrast the results of both, and denote the superiority of the second, in terms of parsimony, simplicity, robustness and capability to explain satisfactorily the dependent variable; because in detriment of VEC estimates, they usually present low R2. According to the results, VEC and ADL models confirm that the stock market causes economic growth, whereas only the VEC estimates confirm that banks contribute to growth. Causality is unidirectional.. The second chapter of this work analyzes the impact in profitability of affiliated firms to a business group and listed in the Mexican stock exchange. The aim of this chapter is twofold: a) provide evidence if affiliated firms are more profitable and b) if firms belonging to a business group carry out the rent extraction practice known as tunneling. Early analyses on the subject were made with cross sectional models but the trend quickly moved to the usage of panel data Lemmons and Lins (2003), Santiago-Castro and Brown (2007), although limiting the sample of companies from each country or varying the number of countries. Other studies have focused on single country analysis, but have included a greater number of firms Pombo and Gutierrez (2011), Liu and Hyan (2008). The case of Mexico has been studied by Castaneda (2002) and Chong et al (2009), but their work has considered a short period of time or included a small sample of firms. This work presents evidence from a large data collection covering all the firms still and once listed in the local stock market from 1990 to 2012. Consequently, is important to mention that an unbalanced panel is utilized, and to avoid endogeneity bias the Generalized Method of Moments of. 3.
(15) Arellano & Bond (1991) and Blundell & Bond (1998) that allow the use of instruments is employed. Corporate governance is related with a firm’s policies to achieve its profitability goals, or in other words, is the way a firm establishes how to generate and distribute profits. The pioneering work of Jensen and Meckling (1976) determined that when separation of ownership and control takes place, agency problems arise and that the plundering of resources reduces the value of the firm. This may occur if a manager diverts resources to purposes other than profit maximization. In OECD (2004) and Francis et al (2013), the positive influence of good corporate governance on company performance, and therefore on economic growth, is also evident. Limiting rent extraction in listed firms is a desirable objective because can result in improved performance and therefore induce economic growth, Maher and Andersson (2000), OECD (2004). In this respect, Claessens and Yurtoglu (2013) concluded that better corporate governance mechanisms increase access to external financing, leading to more investment, more growth and hence more employment. So, if the stock market can spur growth, then one way to achieve it comes from the improvements to corporate governance of firms, IMF-World Bank (2013). This is also important considering that private pension funds are now allowed to include shares in their portfolios. This is the connection between the issues analyzed in chapters 1 and 2. In the economic literature, business groups can be seen as ‘‘paragons’’ or ‘‘parasites’’ (Khanna and Yafeh, 2007), which means that affiliated firms may yield an acceptable payout to their minority shareholders or may have a rent seeking behavior in detriment to them. This organizational behavior is related with the governance mechanisms of the firm. According to the results, firms affiliated to business groups tend to have higher levels of profitability, however during recessions they carry out the practice of tunneling. Although this is undesirable, is pertinent to say that this phenomenon is not permanent.. The Third chapter of this thesis is related with price discovery. In financial econometrics there are two branches related with the modeling of prices of financial assets: price discovery and price predictability Narayan and Smyth. 4.
(16) (2015). The first is related to the analysis of transmission of information within or across markets and how information is incorporated into share prices, for citing one example: sometimes in the commodities markets, the futures’ prices drive the formation of spot prices, or vice versa. If the information in other variables affects stock prices, then those variables can be used as predictors. Models focused on price predictability can use those variables to assist investors to make better informed decisions. In other words price predictability models have been focused on stock returns, both using past returns and incorporating other variables, or, in the terminology of Fama and French (1993), other “factors”. Looking back to Fama & Macbeth (1973), their attempt to empirically validate the CAPM was conducted 1) estimating a time series regression using the market model, and then 2) performing a cross section regression to obtain the market risk premium of shares. Since the results were not inconclusive, other factors were incorporated in addition to Beta following those steps, Fama & French (1992) and Fama & French (1993). Since then, other works had tried to demonstrate the superiority of their factors. And the quest for the Holy Grail began! Regarding step 1, most of the research done is circumscribed to incorporate other factors in addition to index market returns to improve the regression results. A classical example of this corresponds to Fama and French (1993). Then follows that the task within price predictability has been to successfully incorporate those factors to the unconditional and conditional CAPM. For example Subramayan (2010) documented over fifty variables, highlight expected inflation, interest rates, output gap, consumer confidence, term spreads, default spreads, etc., besides the most known factors as Size, Momentum, B/M ratio. For recent research with a focus on emerging markets we have Soon-Ho et al (2012), Harshita & Yadav (2015) and Bajpai & Sharna (2015). In other lines of research, if Beta is stable we are talking about the unconditional CAPM; if the reported Beta exhibits a time varying pattern then we are talking about the conditional CAPM, where most of the new techniques have been applied, Subramayan (2010), Narayan and Smyth (2015). Within the analysis of conditional Beta models, two approaches can be distinguished: a) beta can be regarded as a function of time, neglecting. 5.
(17) any economic influence on changing betas; and b) betas can be affected by some relevant economic variables, Cai et al (2015). Concerning step 2, the cross section regression presents other drawbacks that will not be addressed other than mentioning that up to this point, quantile regression seems to be the most suitable econometric technique to deal with nonlinearity of the risk premium. The problems to validate the CAPM still continue in the step 1, (that may difficult the estimation of step 2). Since the early work of Jensen (1968) until very recent papers Bajpai & Sharna (2015), Soon-Ho et al (2012), the most notorious weakness are: a) low R2, b) possibility of non-normality of residuals, c) undesirable effects of outliers. In the cases when the stock market return is the only explanatory variable, these problems may become acute, that’s why other factors were incorporated. The Transfer Function Model (TFM) never has been employed in the analysis of CAPM, so this paper is the first work that attempt to apply this econometric technique. In this regard, the objective of chapter 3 is to present evidence that market return is the only pricing factor needed for modeling stock returns. The TFM is a mix of ARIMA and structural regression models, developed by Box and Jenkins (1976) and enriched by the contributions of Liu and Hanssens (1982), Liu (1991), Liu et al (2010). This model was designed to exploit the structure of current and lagged information of one explanatory variable and the ARIMA terms. Those who have tried to model stock returns, will immediately agree that, in using either structural or univariate ARIMA models, it is very difficult to achieve an acceptable adjustment between estimated and observed data, especially if the data corresponds to emerging markets. As a contribution, this work can offer a new methodology for price discovery that improves the market model estimations in step 1, which are necessary for the validation of CAPM in step 2; or to provide accurate predictions or be used on Value at Risk (VaR) where Beta is necessary to gauge the incremental VaR, but you better judge the results.. 6.
(18) The graphs in chapter three show the adjustment achieved using TFM, employing only one factor (IPC, the market index) as explanatory variable and the ARIMA terms. For the modeling of monthly returns, the longest data set available is employed (June 1997 to April 2015); with the last six observations are reserved for the out-of-sample forecasting (May to October 2015).. Thus, this work can be seen as a collection of three papers analyzing several facets of the Mexican stock market, each of them with their own objectives, hypothesis and methodology, with particular and general conclusions presented respectively.. 7.
(19) 8.
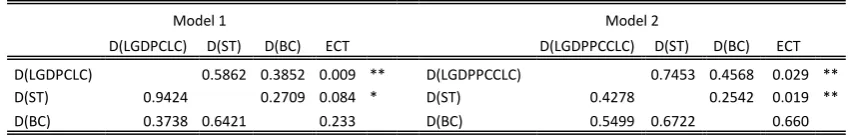
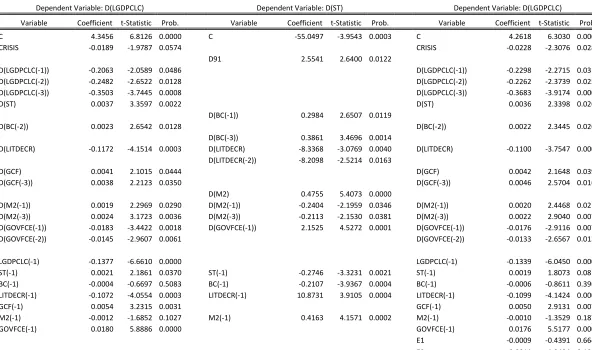
(20) Chapter 1: The Stock Market and Economic Growth in Mexico Section I: Introduction Generally, banks have been the predominant activity in comparison with other financial activities, therefore the stock markets were not recognized as promoters of growth. This work is intended to present evidence that the stock market can contribute to economic growth in Mexico. The causal relationship between financial activities and economic growth, still presents mixed results. The vector error correction model (VECM) is the most used econometric technique to establish the direction of causality. In this context, the Autoregressive Distributed Lag Model (ADL) and superexogeneity tests are barely used. Mexico has been studied mainly in panel data models, and consequently shorter time periods are covered. For example Baltagi et al (2009), covered a time span from 1980 to 2003, they used for their analysis bank credit to private sector and stock market capitalization as percentage of GDP. For emerging countries before 1980, there is no information for the latter variable, which drastically limits the number of observations available. However the value of stocks traded can be tracked several years before that date. In fact this analysis is performed considering a yearly time series from 1960 to 2013. Ortiz et al (2007) employed a bivariate VECM to assess the impact of Mexico’s stock market on its economy using the Stock Market Index and data on Industrial Production. They utilized monthly data from 1978 to 2002 and detected a bidirectional causality. Levine and Zervos (1995) recommended that the value of stocks traded (as percentage of GDP) is a better predictor of economic activity than other stock market variables. Demetriades and Hussein (1996) stated that it is preferable to conduct this analysis using yearly3. However, references are still scarce for the country. The aim of this chapter is to determine if in México the financial sector causes economic growth as postulated in the “supply leading hypothesis” of McKinnon (1973) and Shaw (1973). A VEC model is employed using a longer period, from 1960 to 2013. The results of an ADL model are presented as well as super exogeneity tests, developed by Pesaran et al. “In fact it is preferable to use data sets containing fewer annual observations over a long time period than data sets containing more observations over a shorter time period.” Demetriades and Hussein (1996, p. 389). 3. 9.
(21) (2001) and Engle & Hendry (1993) respectively; and following the methodology of Ang (2008) and Yang & Hoon-Yi (2008). In a VEC model can be shown that banks contribute to growth, but in an ADL model their contribution is not significant. With respect to the Mexican stock market, both models indicate a significant contribution to the growth of the economy. The causality goes from financial sector to the real economy, but not vice versa.. 10.
(22) Section II: Theoretical Foundations 2.1 The link between stock markets and economic growth For Schumpeter (1911) the financial sector is an important factor for growth, since it promotes productive investment and innovation. Patrick (1966) and Goldsmith (1969) indicate that countries with higher growth rates also experienced financial sector expansions; McKinnon (1973) and Shaw (1973) emphasized that financial sector development enhances savings, capital accumulation and therefore economic growth; King and Levine (1993) show evidence of a robust relationship between the level of financial development and current growth rates, as well for subsequent periods. Levine and Zervos (1995) showed that the development of the market, particularly the liquidity indicator 4 , is robustly correlated with future economic growth. Their analysis also showed that even after adding banking development indicators, market indicators remain significant, which means that both financial activities have a complementary role. The empirical findings of the link between financial sector development and growth; Bencivenga, Smith y Starr (1992), Levine (1991), Greenwood y Jovanovic (1990), Saint-Paul (1992), showed that a liquid secondary market helps allocate funds to projects with the highest marginal productivity, stimulating economic growth. Long-term investments in physical capital may have higher returns than short term investments. A liquid market lowers the cost of capital and fosters investments in more productive projects and for longer terms, thereby contributing to the economy to expand at higher growth rates. When equity markets become more liquid, it also contributes to increasing capital productivity through better portfolio diversification and thus lower risks. Capital markets also encourage risk diversification and thus ease the specific risks of investing in one particular company. This allows each company to specialize and increase productivity without increasing systemic risk. Stock markets also generate incentives to acquire information about the companies in which individuals invest5.These incentives in turn generate more research and monitoring on firms, improving the role of market for resource allocation. 4. To measure the degree of liquidity in a market, the value of stocks traded as a percentage of GDP is used. 5 Stock markets may also influence the acquisition and dissemination of information about firms. As stock markets become larger and more liquid, market participants may have greater incentives to acquire information about firms. Intuitively, with larger and more liquid markets, it is easier for an agent who has acquired information to disguise this private information and make money (Levine, 1997, p. 695).. 11.
(23) As equity markets were recognized as promoters of growth; Levine (2002) tried to assess whether banking or stock markets are better to boost growth. The evidence provided by this author states that is indifferent if an economy relies their funding in one or another. Demirgüc-Kunt and Maksimovic (2002) indicated that to finance firms, banks are better to provide short-term capital; but stock markets are more efficient for long-term horizons. Equity markets may be better to diversify risk, while banks are more efficient to reduce informational asymmetries between lenders and borrowers. The reason that the financial sector in general and the stock market in particular, are important for growth, has to do with the functions they perform. According to Levine (1997), markets perform five functions which can generate greater economic growth, acting through two channels: capital accumulation and innovation. First, financial intermediaries facilitate risk management. To facilitate diversification, financial intermediaries allow the economy to invest more in new production technologies even with the risks involved, and then boost economic growth. Without financial markets, investors facing liquidity problems would be forced to withdraw funds from long-term investment projects. The premature withdrawal of these resources reduces economic growth. Stock markets can remedy this situation by giving shareholders immediate access to their resources while simultaneously offering businesses a source of long-term capital. Investors in the market also wish to diversify the risk of productivity associated with individual investment projects. Without financial markets, investors would be required to buy whole pieces of capital. The markets allow investors to hold small parts of a large number of firms6 Second, by acquiring ex-ante information from investment projects, the financial intermediaries improve the allocation of funds. Information asymmetries give firms with prospective investment projects seeking financing an advantage about the quality of their potential investments. As companies go to the market to obtain financing, the ability to assess and allocate resources to the most promising projects, leads to economic growth. 6. Besides reducing liquidity risk, financial systems may also mitigate the risks associated with individual projects, firms, industries, regions, countries, etc. Banks, mutual funds, and securities markets all provide vehicles for trading, pooling, and diversifying risk. The financial system's ability to provide risk diversification services can affect long-term economic growth by altering resource allocation and saving rates. Besides the link between risk diversification and capital accumulation, risk diversification can also affect technological change. Agents are continuously trying to make technological advances to gain a profitable market niche (Levine, 1997, p. 694).. 12.
(24) Third; ex-post monitoring on firm’s management also induces the need for financial services. For individual investors, it is difficult and expensive to appraise the projects and monitor their management. The costs of acquiring information (screening cost) create incentives for the emergence of financial intermediaries: they reduce the cost of monitoring to prevent such efforts from being duplicated, Diamond (1984). In the stock market, brokerage and / or rating firms perform this function, and this information is reflected in prices. An example of this is an IPO when its placement price is fixed, the issuance of recommendations to buy or sell, etc. By the way, the assessment of information disseminated, is another activity carried out in the sector. Stock markets introduce the possibility of aligning the interests of managers and shareholders, as for example the partial compensation of managers with shares or options of the firm, that mitigates the principalagent problem generated by the separation of ownership and control. In firms with concentrated ownership, the agency problem is less acute, but the agency problem is transferred between the majority and minority shareholders. Fourth, financial markets mobilize savings efficiently. Capital markets establish conditions where investors feel comfortable with renouncing control of their resources. If securities are of low denominations, a greater number of potential participants in the market are allowed. By reducing transaction costs, the liquidity of stock markets is also encouraged 7. Fifth, financial markets foster specialization. The markets can contribute to the production specialization, by channeling savings to projects that use a new technology and / or expand the scale of production. Also, financial 7. The possibilities of reducing transaction costs and thereby improving the performance of stock markets, can best be seen in the following passage: “By facilitating trade, stock markets reduce liquidity risk. As stock market transaction costs fall, more investment occurs in the illiquid, high-return project. If illiquid projects enjoy sufficiently large externalities, then greater stock market liquidity induces faster steady-state growth… Trading costs can also highlight the role of liquidity. For example, different production technologies may have a wide array of gestation periods for converting current output into future capital, where longer-run technologies enjoy greater returns. Investors, however, may be reluctant to relinquish control of their savings for very long periods. Thus, long-gestation production technologies require that ownership be transferred throughout the life of the production process in secondary securities markets. If exchanging ownership claims is costly, then longer-run production technologies will be less attractive. Thus, liquidity -as measured by secondary market trading costs- affects production decisions. Greater liquidity will induce a shift to longergestation, higher- return technologies (Levine, 1997, p. 693).. 13.
(25) products (new and existing) can encourage specialization and therefore trade of goods. Townsend (1979) argues that the formation and development of stock markets occurs endogenously once the per capita income levels of an economy reach a certain threshold, so in these markets subsequently by reducing transaction costs liquidity can be increased, and then promoting specialization of firms and, therefore trade. A key feature of equity markets which distinguishes them from other financial markets, such as credit, is that it emerges from a different contractual relationship. Investor revenues are in the form of dividends or capital gains, depending on the performance of the firms. Thus, the stock markets, by promoting investment, also encourage economic activity by increasing the scale of existing businesses and through the creation of new firms.. 2.1.1 Macroeconomic and microeconomic perspectives There is evidence that high inflation rates have adverse effects on growth (Barro, 1996), but also for the banking and stock market Boyd et al (2001). By reducing the return on investments in financial assets, bank and stock market activity decreases, with a consequent decline in investment and hence economic activity in general. More recently, Pradhan et al (2015) found that economic growth causes the development of capital markets and vice versa, but also there is a bidirectional causality between inflation and stock markets. It is noteworthy that macroeconomic stability8 is a necessary condition for a) a successful implementation of a financial liberalization program, and b) and setting up a safe economic environment for promoting private sector investment, Karnameh Haghighi et al (2012). As an example, in the late seventies Mexico experienced the excessive expansion of public spending and generated a high fiscal deficit to 8. For macroeconomic stability is understood that an economy is able to minimize the impact on the product from shocks, such as changes in international interest rates and exchange rates, etc., and also presents a) low and stable rates of inflation, b) low interest rates for the long term, c) low levels of debt measured as a percentage of GDP, d) low levels of public deficit, also measured as percentage of GDP, e) exchange rate stability. The above recommendations are in line with the Maastricht Criteria. See: http://glossary.reuters.com/index.php?title=Maastricht_Criteria. 14.
(26) counteract the decline in private investment, along with loose monetary policy, this led to an inflationary spiral that overvalued exchange rate. Ultimately, appreciation of the peso generated a growing deficit in the balance of payments that led to the debt crisis of 1982. This macroeconomic scenario resulted in a decline of the financial intermediation measured as a percentage of GDP. During the seventies, in Latin American economies, and Mexico, foreign capital flows came from bank loans. In the following two decades they were replaced by foreign direct investment and portfolio investment, the latter directed to the bond market and the stock market, Bekaert and Harvey (2003). While emerging economies can benefit from capital flows from developed countries, they may eventually face exchange rate shocks that affect the real economy, excessively appreciating or depreciating the local currency. At the end of the eighties, The World Institute for Development Economic Research (WIDER) one of the most influential think tanks, suggested that emerging countries should liberalize their financial markets to attract capital flows, especially to the equity markets; under the argument that investment funds and pension funds in developed countries had accumulated large sums of capital, and by the downward flow of international bank lending (WIDER, 1990). During the eighties and nineties, several countries had embarked on economic liberalization programs that included the removal of restrictions on international trade, deregulation and internationalization of the financial sector, privatization and generally the elimination of market-distorting regulations. In fact after the debt crises, loans to Latin American economies from multilateral agencies such as the IMF were conditioned on the implementation of stabilization and liberalization programs. Thus, in many emerging economies during the eighties these measures were implemented as part of their structural adjustment programs. Measures to eliminate preferential credit for the government, the elimination of controls on interest rates, and the privatization of financial institutions were the main recipe for the development of local financial markets. Also, the capital account was liberalized. WIDER’s (1990) recommendations for the development of stock markets, were as follows: 1. Restrictions that limit foreign investment should be removed. 2. The limits for foreigners on share ownership and participation in boards need to be revised, as well as the holding of shares without voting rights.. 15.
(27) 3. The taxes that discourage investment must be eliminated, and taxes on capital gains and dividends should be at levels in line with international standards. 4. The protection that limits foreign participation in the financial activities was of doubtful necessity and needs to be revised. 5. Restrictions limiting participation in the stock market are part of a wider set of constraints that affect capital flows and therefore countries should eliminate these barriers. 6. To develop emerging markets a combination of legal and supervisory framework is required, along with sound fiscal and monetary policies. Financial reforms instituted within economies were expected to interact with the liberalization of the capital account, so that foreign investment flows could contribute to the enlargement of stock markets as controls on the capital account were removed and limitations on foreign ownership in local firms were eliminated. The result was the development of local equity markets, whether measured by capitalization ratios, liquidity or the number of companies listed on the stock exchange. Financial liberalization measures integrated local markets to international financial markets and channeled capital flows from developed to emerging markets. Those flows were subject to factors that propel his departure from the first (Push Factors) or factors attracting those resources to the second (Pull Factors) thereby generating an acceleration of resources invested outside the advanced economies, Fernandez-Arias and Montiel (1996). Some of the push factors that act in advanced markets are low interest rates, lower growth expectations, and the availability of institutional investors’ resources to place and diversify portfolios abroad. Regarding the pull factors, they act in emerging economies to attract investment, including the economic fundamentals, but also the political, regulatory and legal framework of the host country, and of course returns. The liberalization of the economy implies liberalization of international trade, financial deregulation and liberalization of the capital account, listed in the order posed by McKinnon (1973) and Shaw (1973). Results of financial reforms in Taiwan are analyzed by Liu and Hsu (2006) and Yu (1999), this case is considered the most successful, and most orthodox, by reason of being the least vulnerable country to the Asian crisis of 19979. 9. “We could find that the financial liberalization process in Taiwan comparing with that of Japan or Korea during the last two decades followed the order suggested by McKinnon to transform the economy from a financial control economy to a market-oriented one... Taiwan’s deregulation of the financial system had followed an appropriate sequence. Before opening of international market, Taiwan had just begun to deregulate the domestic. 16.
(28) While a reform of financial activities has the task of increasing the volumes of savings and investment, Mishkin (2009) also notes that the effectiveness of these measures depends in turn on the coexistence of the following factors: a. b. c. d. e. f.. Defined property rights. An efficient legal system. Low or zero levels of corruption. Quality of the financial information Good corporate governance practices Sound and prudent regulations of the financial system.. In Mexico, and several emerging economies, financial liberalization measures lacked or had lacked some of these conditions. At the microeconomic level, transaction and information costs cause frictions in financial markets that hinder their proper functioning (Levine, 1997). To illustrate this, note that principal-agent problems, either by moral hazard or adverse selection, may represent an obstacle in emerging economies ability to develop their markets. Following Lombardo & Pagano (2002) and Stiglitz & Weiss (1981), adverse selection problems arise from a situation where the riskiest borrowers are those who usually are more willing to seek external financing (and often those most likely to default and more willing to not return the loans). While higher interest may be charged to them, this does not mean that one can avoid financing risky projects. In fact the theory states that a higher interest induces those agents with the riskiest projects to seek resources. The way in which this problem is avoided is in charging a higher interest, but rather in the rationing of available resources to finance investment. The moral hazard problems in the world of finance have to do with the potential situation where once the resources to a project are granted, they are used for purposes other than those agreed originally, whether it is used in riskier activities, or simply who is granted, flee with the money. The problem will become more acute as it becomes difficult for the principal (who provides the resources) to monitor the behavior of the agent (who receives the resources). Even in absence of information asymmetries, if the costs to enforce a contract are high this problem can prevail. Generally, the financial industry and to decontrol its domestic market. It had also followed an appropriate sequence to open up its financial account. The current account should be liberalized before the financial account, and the long term-capital, before the short-term capital” (Liu y Hsu, 2006, pp. 676-677).. 17.
(29) problems of moral hazard are more present in the equity markets and to reduce them is to align the interests of the agent with the principal (it means shareholders versus managers). When this is not achieved, the resources are simply not granted. Moreover the problem of transaction costs can arise from deficiencies in the institutions, market failures and other informational problems. This makes obtaining information on projects and borrowers too expensive. It makes difficult to access markets, value assets, monitor firms and enforce contracts, etc., thus hindering the market development. The institutional framework of the economy also affects the flow of information, transaction costs and the way the contracts are enforced: Institutions have an impact on the development of financial markets and access to sources of financing, so, countries with efficient legal systems that safeguard shareholders’ and lenders’ property rights have more developed financial markets. In environments with weak institutions, it is difficult to ensure that contracts are honored, information on listed companies is scarce and not always reliable. As a result, agency problems tend to be mitigated through mechanisms that rely on personal relationships, use of collateral, and group supervision. Thus, countries with better institutional frameworks have better mechanisms to reduce agency problems and transaction costs so that someone who needs funding for a project depends less on personal relationships and having collateral.. 2.1.2 The functions of financial markets and growth For a long time, the effects on growth attributable to banking and stock markets were not distinguished, primarily by the lack of indicators, and the short extension thereof. Financing for investment projects primarily comes from internal funds, then from external funding; the external funds used first being bank loans and then the issue of shares. Therefore, note that in the financial system, banking activities are the first to develop and then the stock market. These activities generally are complementary to facilitate business expansion. In an effort to establish channels of causation of the financial sector to the real economy Pagano (1993) established first, that the monitoring and supervision of those seeking funds could lead to a better allocation of resources; second, the provision of financial services can encourage the. 18.
(30) mobilization of idle resources; and third, more efficient ways of sharing risks can reduce the costs of financing projects and thereby encourage savings rates and promote innovative startup projects. Following Rousseau and Wachtel (2000) the role of markets in growth may be due to the following factors: The stock markets provide investors a mechanism for entry and exit. Foreign capital flows are a major source of funding, either in the form of direct investment or portfolio investment. Moreover, in emerging economies they provide a source of foreign exchange. c. Liquidity in stock markets enables national and international investors to transfer their surplus from short-term assets to those with long term maturities. In addition liquidity encourages the diversification of portfolios and capital flows. d. The existence of equity markets generates information of listed companies, enabling investor to monitoring their performance and assessing its ability to generate value. a. b.. 2.2 Causality between financial sector development and economic growth, does the financial sector cause growth, or follow it? The link between financial deepening and economic growth has generated a lively debate on whether it promotes growth or whether the sector's development is simply a consequence of economic growth that creates a demand for more sophisticated financial products. Until now, the empirical evidence has been mixed. The literature identifies four perspectives regarding the direction of causality between financial sector development and economic growth. The first of these postulates that improved financial intermediation contributes to the growth in two ways: a) improving the accumulation and the marginal productivity of capital, b) increasing the rate of savings and investment. The most well-known proponents of this position are McKinnon (1973) and Shaw (1973). The second corresponds to the case where causality goes from the economy to the financial sector (Robinson, 1952). The third says that causality is bidirectional, Demetriades and Hussein (1996), Greenwood and Smith (1997). Finally, the fourth corresponds to the Lucas critique (1988), stating that there is no causality. Patrick (1966) was among the first authors to try to empirically establish the relationship between finance and growth. In fact, these four visions are related to the so-called "Patrick's Problem". That is, the attempt to establish. 19.
(31) that causal link. This author identified two possible causal relationships between finance and growth: the “supply leading hypothesis”, which postulates that financial development generates growth: and, the “demand following hypothesis”. The second simply posits that the financial sector has a passive response to the economic growth, "where enterprise leads, finance follows" noted Robinson (1952); considering that development of the financial sector depends on real output growth. The causal relationship between growth and finance has important policy implications. If there is causality from the financial sector to growth, then promoting and reforming financial institutions will be a desirable objective since greater financial deepening increases the supply of products and financial resources available in the economy. To understand why the financial sector can be positively related to economic growth, Stiglitz (1998) points out that savers can select investments more in line with their risk tolerance. Moreover, a group of savers can hardly take advantage of higher returns derived from investments on a larger scale. In addition, entrepreneurs often lack sufficient capital of their own to launch their projects. In light of the foregoing, capital markets and other intermediaries can provide the services that make it possible to channel resources from savers to investments with higher rates of return, thus increasing productive specialization. With the development of financial markets, the risk can be pooled and transferred through the use of more sophisticated financial products. This increases investment efficiency (enabled by greater savings) in new innovative projects, and drives growth progressively. It should be noted that the above argument assumes that markets are free of distortions caused by any government intervention 10 , McKinnon (1973) states that the flows of savings and investment should be voluntary, and equilibrium interest rates determined by the market. The literature that promotes liberalization of financial markets indicates that to operate efficiently and profitably, financial institutions need to work in an environment free from distortions and not repressed by government policies, such as interest rate ceilings11 or 10. The measures of financial repression were present in the economies of developing countries during the period in which the import substitution model was implemented. Giovannini and de Melo (1990) note that controls on international capital flows, coupled with controls on domestic financial intermediaries, generated distortions in the money market which were reflected in negative real interest rates for savers. 11. The government not only creates restrictions in the credit market by implementing interest rate control, but also by inhibiting competition in the financial industry or possessing banks. High reserve requirements are also a mechanism that illustrates how government raises funds at low interest forcing banks to hold government bonds in their. 20.
(32) excessive reserve requirements. Therefore reforms are considered necessary to liberalize the financial sector and contribute to economic growth. The proponents of liberalizing financial markets indicated that if repressive policies are continued, and the macroeconomic environment is unstable, the result would be a severe contraction of savings and therefore a reduction of available funding. A wider range of products and financial resources could be allocated to traditional economic activities and gradually place a greater share of these resources to the most modern or innovative sectors. Access to financing for new activities could foster entrepreneurship and generate sufficient economic benefits to justify the launch of a public intervention for the development of the financial system12 . 2.3 Reforms to the financial sector in Mexico: some relevant issues In recent times the world stage has had a dynamic of constant change, driven by financial and technological innovation and the participation of new actors. In addition the past 20 years has been characterized by the financial crisis and contagion across international markets. All these events have been accompanied by deregulation and financial liberalization driven by the process of globalization, the emergence of new financial instruments and increasing resources available from the international financial market Mishkin (2009). Until the early seventies, Mexican banks had an acceptable role regarding their main social function, mobilize savings and provide credit to the private sector. Activity flourished in a stable macroeconomic environment, especially in the sixties, under the old Law of Credit Institutions and Auxiliary Organizations in force since 1941, which regulated the sector in a specialized banking system. portfolios. Through controls for capital inflows and outflows, a government can pay lower rates in the domestic market than those prevailing in the international debt market. 12. In Mexico, the Entrepreneur Fund is an example of a government initiative for financing companies with public funds. Other private financial institutions has joined, see: http://www.soyentrepreneur.com/21388-10-instituciones-para-conseguir-credito.html http://www.cnnexpansion.com/economia/2015/02/11/gobierno-lanza-creditos-para-losjovenes-emprendedores But perhaps the most successful public policy in Mexico is the housing loans program administered by INFONAVIT. After its implementation, the supply of private credit complemented those public funds.. 21.
(33) This law, in addition to regulating the financial system, allowed the government to channel resources to certain economic activities designated as strategic to achieve industrialization. While the resources obtained in this way were used to finance those strategic activities and build public infrastructure at a low cost; progressively they were used to finance the public deficit. In the period between the forties and early seventies, the deficit incurred by the government represented a small percentage of GDP, meaning that borrowing requirements were not in competition for resources from the banking system and other intermediaries. However, this situation began to change since the mid-seventies when public spending began to replace private investment as the engine of growth. Recurrent public deficits demanded increasing resources both from commercial banks and the Bank of Mexico. The consequences were soon manifested in the functioning of the banking system: the resources destined to the government represented a greater proportion of available credit, at the same time inflationary pressures emerged and became chronic. When combined with fixed nominal interest rates paid to savers, they eventually obtain lower, and several times, negative real interest rates that reduced bank deposits in real terms and therefore the credit to the private sector, both measured as a percentage of GDP. Thus, the banking system experienced a period of financial disintermediation during 1976-1988. To contain the financial disintermediation, was promoted the transformation of specialized banks towards commercial banks. Savers were allowed to possess accounts in US dollars, even if the deposits had been made in pesos. The adaptation of the legal framework during 1976 to 1982 had given the national banking system tools to reverse the declining trends in credit and modernize the sector, but this process would be stopped with the bank expropriation decreed by Jose Lopez Portillo in September 1982, the last day of his term (Hernandez-Murillo, 2007). The nationalized banks facilitated the financing of a public deficit that reached 18 percent of GDP in 1982. Given the stringency of loanable funds in international markets, and locked in a tight monetary policy aimed at reducing inflation, the government of President Miguel de la Madrid (19821988) financed the huge government deficit inherited by his predecessor with unprecedented increases in reserve requirements, so that the availability of bank financing to the private sector decreased considerably13.. 13. The bank expropriation brought a loss of human capital and technological backwardness. In addition, the appointments of management positions were granted from. 22.
(34) While Mexican banks were nationalized, the government allowed the private sector to continue operating in other financial sector activities such as brokerage, foreign exchange, insurance, etc. Although the size of these businesses was small compared with banks; however, at the end of the eighties brokerage firms where competing with the former. In the absence of credit, non-bank intermediaries, especially brokerage firms were replacing state banks in terms of attracting savings and channeling resources for investment. During the period 1988-1992, the regulatory framework of the financial system was upgraded and new laws were designed to improve the performance and competitiveness of the financial intermediaries. At that time of the financial reforms, the money market had become more liquid and active, so the government had significantly increased the issuance of short term treasury bills (created in 1978), and therefore depended less on mandatory loans from banks. In 1989, Mexico had returned regained access to international capital markets, having been excluded from this market from 1982 to 1988, after having launched a new stabilization plan implemented in December 1987 and ensuring the payment of external public debt through the so-called Brady Plan. In 1989, at the beginning of the presidential term of Carlos Salinas de Gortari, controls on interest rates and mandatory bank lending to the government were removed. In 1990, financial groups were allowed under the scheme of universal banking, where these groups could be integrated with all the branches of financial intermediation: banks, insurance, brokerage, leasing, factoring, foreign exchange, etc. Reserve requirements on private deposits were eliminated in 1991. These reforms led to the privatization of banks between 1991 and 1992. Also in 1989 the capital account was liberalized.. the spheres of political power. Moreover, while international financial institutions made technological improvements in providing financial services, Mexican government-owned banks -insolated from competition- had no incentive to improve their services (Hernandez-Murillo, 2007).. 23.
(35) The most relevant financial liberalization measures for the Mexican economy14: Liberalization of Interest Rates The existence of interest rate ceilings in an environment of rising inflation caused an erosion of bank deposits in pesos, because savings had taken refuge in dollar-denominated instruments, or channeled to non-bank institutions able to provide better conditions for savers during the time the banks were expropriated. Interest rates were freed in 1989, resulting in an increase in savings in the form of bank deposits and expansion of credit. Suppression of the legal reserve The mandatory reserve requirement was suspended and replaced in 1989 by the so-called liquidity ratio, which would be in operation during two years. In 1991, it was substituted by a voluntary reserve ratio. With these provisions, the authorities limited themselves to the purchase and sale of government bonds. Thus, banks could expand credit rapidly. The deregulation of credit In 1989, mandatory credit which the authorities required since 1941, was removed. The arrival of the CETES (Treasury Bills) in 1978 gave the government a privileged instrument for domestic debt financing and for open market operations development. As the market for government debt securities matured, mandatory credit was relegated to second place. As the reduction in public deficit was achieved, mandatory credit fell into disuse until it finally ceased to be an instrument of monetary policy and source of public financing. In 1993, domestic public debt was composed entirely of government bonds, while by 1988 represented only 40 percent. As immediate consequence, banks channeled more credit to the private sector. Liberalization of the capital account With the Law on Foreign Investment of 1989 controls on the capital account were eliminated, allowing free inflows and outflows of capital. For stock market was allowed the cross listings of shares leading to the first issuance in 1991 of a Mexican ADR (and by the way the first one that proceeded from an emerging country. This is important to note because Bekaert and Harvey (2000) detect a structural break in 1989 for the Mexican stock market, while Hargis (1998) signaled that with the launching of Telmex ADR in 1991 was what really triggered the growth of the stock. 14. http://www.banxico.org.mx/sistema-financiero/disposiciones/resumen-principales.html. 24.
(36) market15. With these measures, bank lending to the private sector, as well as market capitalization and value of traded stocks, increased significantly. Regardless, the rapid expansion of credit and poor banking supervision mechanisms, lead to the crisis of 1994 (Hernandez-Murillo, 2007). Continuing with the financial reform, in 1994 the corresponding law amendments established the independence of the central bank with the objective to maintain low levels of inflation. In 1997, the reform of the pension system allowed private enterprises to manage these resources, although at that time they were only allowed to invest in government bonds. It wasn't until 2005 that pension funds were allowed have in their portfolios, shares and other financial assets of the domestic market and from abroad. In 1998, the Mexican derivatives market was created. Since most of the reforms have impacted mainly the banking field, it is clear that the Mexican authorities must still continue with the process of financial reform to strengthen the stock market.. 15. “Integration should stimulate stock market development by increasing the size of the market and enhancing the liquidity of companies traded, helping the market to provide the diversification, liquidity and informational roles which stimulate economic growth” (Hargis, 1998, p. 305-306).. 25.
(37) Section III: Econometric Analysis 3.1 The Vector Error Correction Model (VECM) In many cases, the economic variables in levels are not stationary. When this occurs, they must be differentiated “d” times before they become stationary. So, it is said that one variable is integrated of order “d”, such that if Y t I (d), then d Y t I (0). Other variable of interest could also be integrated with the same order "d" as X t I (d). Thus, if the variables are of the same order of integration, a set of variables may be cointegrated if the linear combination between them is stationary. This is the definition of cointegation of Engle and Granger (1987) 16. Suppose that there is a set of variables g such that g ≥ 2, and both are I (1), VAR representation of them in matrix form is: 𝑌𝑡 = 𝛽1 𝑌𝑡−1 + 𝛽2 𝑌𝑡−2 + ⋯ + 𝛽𝑘 𝑌𝑡−𝑘 + 𝑢𝑡 (1) To use the Johansen test, the VAR model has to become a vector error correction model: 𝑌𝑡 = 𝑌𝑡−𝑘 + 1 𝑌𝑡−1 + 2 𝑌𝑡−2 + ⋯ + 𝑘−1 𝑌𝑡−(𝑘−1) + 𝑢𝑡 (2) Alternatively:. 𝑘−1. 𝑌𝑡 = 𝑌𝑡−1 + ∑ 𝑖 𝑌𝑡−𝑖 + 𝑢𝑡 (3) 𝑖=1. Where = ∑𝑘𝑖=1 𝛽𝑖 − 𝐼𝑔 , and 𝑖 = − ∑𝑘𝑗=𝑖+1 𝛽𝑗 . Equation (3) has g variables in first differences on the left side, and k-1 variables in lagged differences on the right side, with a matrix associated with each lagged term. Meanwhile, the matrix is associated with the lagged levels of the variables; then, can be interpreted as the long term coefficient matrix. The Johansen test is calculated by means of the rank of the matrix , so the rank of the matrix equals the number of nonzero eigenvalues, which are denoted as i, ordained high to low, until as many g variables are contained in the system: 1 ≥ 2 ≥ ... ≥ g . The values of i, must be positive and less than unity (in absolute value) so that 1 ≥ i ≥ 0, the first 's are those whose value is closer to 1, and the last whose value is closer to zero. If the variables that are part of the VEC are 16. Typically variables can be I (1), and only in the event that these variables are cointegrated the error term will be I (0).. 26.
(38) not cointegrated, the rank of the matrix is not significantly different from zero, such that i ≈ 0, i. For the Johansen cointegration test there are two statistics: the trace and the eigenvalue, which can be formulated respectively as: 𝑔. 𝑡𝑟𝑎𝑐𝑒 (𝑟) = −𝑇 ∑ ln(1 − ̂ 𝑖 ) (4) 𝑖=𝑟+1. 𝑚𝑎𝑥 (𝑟, 𝑟 + 1) = −𝑇 ln(1 − ̂ 𝑖 ) (5) Where r is the number of cointegrating vectors, and ̂ 𝑖 are the estimated values of the ith eigenvalue of matrix so that each eigenvalue is associated with a different cointegration vector. 𝑡𝑟𝑎𝑐𝑒 is a statistic to test the null hypothesis where the number of cointegrating vectors is less than or equal to r, against the alternative hypothesis that there are more than r. With the statistic 𝑚𝑎𝑥 , the null hypothesis is that the number of cointegrating vectors is r, against the alternative of the existence of r + 1 vectors. The work of Johansen and Joselius (1990) include the critical values for the two test statistics, the trace and eigenvalue, although Osterwald-Lenum (1992) provides a more complete set of critical values for the Johansen test. It is pertinent to note that this statistical distribution is not normal, and critical values depend on the value of g-r, the number of non-stationary components, and on whether intercepts are included in the cointegrating vectors or in the model in differences (the inclusion of an intercept in the model in differences equals a trend in the data generating process). The tests are conducted sequentially for r = 0, 1, 2 ..., g-1, and it is important to note that the matrix cannot be of full range g, since this corresponds to a set of stationary variables. If the rank of the matrix is zero (r = 0), Yt depends only on the lagged differences of the system (Yt-j) and therefore there would be no long-term relationship. But if the range is between 1 ≤ r <g, there will be r cointegrating vectors. Defining the matrix as the product of two matrices, and ', with dimension (gxr) and (rxg) respectively, such that '; in which represents the adjustment coefficients associated each variables of the VEC system, while is composed with the cointegrating vectors.. 27.
Figure
+7


Documento similar
It is generally believed the recitation of the seven or the ten reciters of the first, second and third century of Islam are valid and the Muslims are allowed to adopt either of
In the preparation of this report, the Venice Commission has relied on the comments of its rapporteurs; its recently adopted Report on Respect for Democracy, Human Rights and the Rule
Abstract: Transepidermal water-loss (TEWL), stratum-corneum hydration (SCH), erythema, elas- ticity, pH and melanin, are parameters of the epidermal barrier function and
No obstante, como esta enfermedad afecta a cada persona de manera diferente, no todas las opciones de cuidado y tratamiento pueden ser apropiadas para cada individuo.. La forma
To determine how public authorities should manage curbside and garage parking, Chapter 2 analyzes the impact of garage fee and curbside regulation characteristics (fee and types
As in the main results, there is an initial negative impact on development on the year immediately after the flood event, which becomes larger in the following years, reaching
Díaz Soto has raised the point about banning religious garb in the ―public space.‖ He states, ―for example, in most Spanish public Universities, there is a Catholic chapel
teriza por dos factores, que vienen a determinar la especial responsabilidad que incumbe al Tribunal de Justicia en esta materia: de un lado, la inexistencia, en el
