de sangre seca en papel de filtro
Nancy M Ruiz
1, María T Pérez
2,
Héctor M Díaz
3, Maricela Izquierdo
4,
Madeline Blanco
1,
Liuber Y Machado
1, Eladio Silva
41 Laboratorio de Biología Molecular 2 Subdirección Gestión de la Calidad
3 Laboratorio de Diagnóstico 4 Subdirección General Laboratorio de Investigaciones del Sida, Lisida Carretera de Jamaica y Autopista Nacional, San José de las Lajas, CP 32700, Mayabeque, Cuba [email protected]
RESUMEN Para la determinación de la carga viral del virus de la inmunodeficiencia humana tipo 1 (VIH-1), se evaluaron muestras de sangre seca en papel de filtro, mediante la prueba Cobas®Ampliprep/Cobas®Taqman® HIV-1. Se cuantificó el ARN en pares de muestras plasma-sangre seca en papel de filtro, provenientes de personas infectadas con el VIH-1. Se calculó el coeficiente de correlación lineal de Pearson y la concordancia mediante el método de Bland y Altman. Se estudiaron la precisión y la linealidad, y se determinó la sensibilidad analítica del ensayo. El modelo producto de la regresión lineal se utilizó para pronosticar el valor de la carga viral en el plasma. Hubo una elevada correlación entre las mediciones de la carga viral en el plasma y la sangre seca en papel de filtro, en 39 de los 43 pares de muestras estudiados (r = 0.964, p < 0.0001). La tasa de detección fue del 90.7 %. Se apreció un comportamiento lineal entre 134 y 420 000 copias/mL de ARN viral, con precisión satisfactoria. Se demostró que no existen diferencias estadísticamente significativas entre las medias de los valores de carga viral pronosticados y reales en el plasma, mediante un nivel de confianza del 95 %. Tales resultados apoyan el empleo de muestras de sangre seca en papel de filtro, para la determinación de la carga viral del VIH, mediante la prueba Cobas®Ampliprep/ Cobas®Taqman® HIV-1. Se recomienda validar el modelo propuesto con un número más amplio de muestras.
Palabras clave: VIH-1, ARN, carga viral, sangre seca en papel de filtro, CAP/CTM HIV-1 Test
Biotecnología Aplicada 2014;31:141-145
ABSTRACT Determination of HIV-1 viral load on dried blood spot specimens. The objective of this report was to eval-uate dried blood spot as optional specimen for quantification of the viral load using Cobas®Ampliprep/Cobas®
Taqman® HIV-1 Test for which RNA levels were quantified on 43 plasma and dried blood spot paired samples, col-lected from HIV-1 infected people. The Pearson linear correlation coefficient was calculated as well as the agreement by the Bland-Altman method. Studies regarding precision, linearity and analytical sensitivity of the assay were also carried out. In addition, the model from regression analysis was used to predict the plasma viral load. There was a high correlation in the viral load results in 39 out of 43 sample pairs studied (r = 0.964, p < 0.0001). The detection rate was 90.7 % and the test showed linear performance between 134 and 420 000 copies/mL of viral RNA. A good precision was obtained and it was demonstrated that there were no statistically significantly differences between predicted and real media values of the plasma viral load for a confidence level of 95 %. These results support the optional use of dried blood spot for the viral load determination with Cobas®Ampliprep/Cobas®Taqman® HIV-1 Test and it is suggest validating the model used with a greatest number of samples.
Keywords: HIV-1, RNA, viral load, dried blood spot, CAP/CTM HIV-1 Test
I
ntroducción
La determinación cuantitativa del ARN o carga viral
(CV) del virus de inmunodeficiencia humana tipo 1 (VIH-1) en el plasma, es una de las herramientas fun-damentales para evaluar el riesgo de progresión a síndrome de inmunodeficiencia adquirida (sida), y la efectividad de la terapia antirretroviral en aquellos in
-dividuos que la reciben [1].
Los ensayos comerciales disponibles hoy para la de
-terminación de la CV son el producto de una evolución investigativa, que se ha centrado en aumentar la sensibi
-lidad, la precisión, los rangos dinámicos y la identifica
-ción de las variantes genéticas de un virus que se carac
-teriza por su elevada mutabilidad [2, 3]. Estos ensayos basan su funcionamiento en tecnologías como la reac
-ción en cadena de la polimerasa (RCP) en tiempo real,
que han posibilitado la automatización de los sistemas. Esa automatización, ha reducido el error humano y ha aumentado la eficiencia en el trabajo [4].
Aunque la muestra ideal para la cuantificación de la CV del VIH-1 es el plasma, no pocos investigado
-res han probado sangre seca en papel de filtro (SSPF), con diferentes estuches comerciales o con métodos estandarizados en laboratorio, por sus ventajas econó
-micas y técnicas, y han demostrado su utilidad; sobre todo para aquellos lugares que no poseen la costosa infraestructura de los ensayos existentes [5-9].
En Cuba, como parte de la descentralización de la atención médica a las personas que viven con VIH/ sida, se habilitaron varios laboratorios, con el propósi
-to de facilitarles el acceso a la determinación de la CV.
1. Mellors JW, Munoz A, Giorgi JV, Margolick JB, Tassoni CJ, Gupta P, et al. Plasma viral load and CD4+ lymphocytes as prognostic markers of HIV-1 infection. Ann Intern Med. 1997;126(12):946-54.
2. Luft LM, Gill MJ, Church DL. HIV-1 viral diversity and its implications for viral load testing: review of current platforms. Int J Infect Dis. 2011;15(10):e661-70.
3. Cobb BR, Vaks JE, Do T, Vilchez RA. Evolution in the sensitivity of quantitative HIV-1 viral load tests. J Clin Virol. 2011;52 Suppl 1:S77-82.
4. Espy MJ, Uhl JR, Sloan LM, Buckwalter SP, Jones MF, Vetter EA, et al. Real-time PCR in clinical microbiology: applications for routine laboratory testing. Clin Microbiol Rev. 2006;19(1):165-256.
Para ello se utiliza una prueba, comercializada por la firma extranjera Roche Molecular Systems, validada para muestras de plasma humano. Sin embargo, hay zonas rurales y de montaña, donde se torna difícil el procesamiento y transportación de las muestras para este ensayo.
Esta prueba no se ha evaluado lo suficiente con SSPF; sin embargo, este tipo de muestra ofrece venta
-jas que la hacen atractiva, como su estabilidad pese a la temperatura y la facilidad para transportarla, incluso por correo postal. Por tales razones, nos propusimos evaluar la SSPF con la prueba Cobas®Ampliprep/ Cobas®Taqman® HIV-1, versión 2.0 (Roche Mole
-cular Systems, Inc., Nueva Jersey, EE.UU.), como al-ternativa para simplificar el procesamiento y traslado hacia laboratorios especializados, para efectuar el en
-sayo de CV.
M
ateriales y métodos
Ética
Los procedimientos siguieron los estándares éticos del Ministerio de Salud Pública (Minsap) y del Ministerio de Ciencia, Tecnología y Medio Ambiente (CITMA), de la República de Cuba, que contemplan los princi
-pios enunciados en la Declaración de Helsinki para las investigaciones médicas en seres humanos [10]. Antes de la toma de la muestra de sangre, se obtuvo el consentimiento informado de cada paciente parti
-cipante en el estudio, y su identidad se mantuvo bajo confidencialidad.
Pacientes y muestras, procesamiento
de la sangre, cuantificación del ARN del VIH-1 Se obtuvieron 43 muestras de sangre total, con el empleo de ácido etilendiaminotetraacético (EDTA) como anticoagulante, de personas infectadas por el VIH-1 para los estudios de correlación entre la CV en el plasma y en la SSPF. Las muestras se tomaron con independencia de la variante genética infectiva de los sujetos de estudio, y de si tenían tratamiento antirre
-troviral o no. Se aplicaron gotas de 50 µL de san
-gre sobre tarjetas de papel de filtro 903 (Whatman, Madstone, Reino Unido), previamente identificadas por cada paciente. El plasma de la sangre restante se separó mediante centrifugación a 1600 × g
duran-te 20 min, en una centrífuga modelo 3K15 (Sigma, EE.UU.), se dispensó en alícuotas de 1.5 mL en tu
-bos estériles de polipropileno, y almacenó congelada a -15 ºC. Las tarjetas con las manchas de sangre se dejaron secar a temperatura de laboratorio (aproxi-madamente a 24 ºC) durante 16 a 18 h. Luego se guar-daron individualmente en bolsas de nailon, que con
-tenían desecantes en su interior, y se almacenaron a 2-8 ºC hasta su análisis. Tanto el plasma como las tar-jetas de SSPF se conservaron hasta el momento de su utilización.
Para la evaluación de la linealidad, la precisión y la sensibilidad del ensayo con SSPF, también se ob
-tuvo sangre total con EDTA como anticoagulante, a partir de un paciente con una CV en plasma igual a 420 000 copias/mL. Se prepararon diluciones seriadas en base 5, desde 1:5 hasta 1:15 625, para lo cual se uti -lizó como diluente sangre total O negativa (O-) de un
donante seronegativo al VIH, al virus de la hepatitis C
y al virus de la hepatitis B. El producto de cada dilu
-ción se aplicó en gotas de 50 µL sobre tarjetas de papel de filtro y se siguió el mismo procedimiento descrito para el secado y la conservación. Mediante tres ensayos se evaluó la linealidad, se cuantificó la CV en la muestra pura de SSPF y en las seis diluciones seriadas que se prepararon a partir de esta. Se probaron tres réplicas de todas las concentraciones utilizadas y los ensayos se efectuaron en días diferentes, para que los resulta
-dos se pudieran utilizar en el análisis de la precisión y la determinación de la sensibilidad.
Para el procesamiento de cada muestra de SSPF se recortaron dos manchas (equivalentes a 100 µL), de la tarjeta de papel de filtro, y se cortaron en frag-mentos pequeños, que se colocaron en un tubo es
-téril de polipropileno. Se adicionaron 1.2 mL de so-lución reguladora Tris-EDTA (1.0 mol/L Tris-HCl, pH 8.0; 0.1 mol/L EDTA) para la elución de la san
-gre durante 2 h, a 2-8 ºC. Posteriormente se recupe-ró 1 mL del contenido del tubo, para su análisis. Se uti
-lizó la prueba Cobas®Ampliprep/Cobas®Taqman® HIV-1 Test, versión 2.0 (Roche Molecular Systems, Inc., Nueva Jersey, EE.UU.), según las indicaciones del fabricante. El único cambio fue el empleo de la muestra de SSPF mediante el procesamiento descri -to. Esta prueba, dirigida a las regiones gag y LTR del genoma del VIH-1, para su amplificación y de
-tección, y cuya sensibilidad es de 20 copias/mL, se realizó en la plataforma para RCP en tiempo real Cobas® Ampliprep/Cobas®Taqman® 48 (CAP/CTM 48) (Roche Molecular Systems, Inc., Nueva Jersey, EE.UU.), y todas las operaciones se efectuaron desde la estación de datos del equipo, mediante el programa Amplilink, versión 3.2.
Procesamiento estadístico e interpretación de los resultados
Los valores de la CV se transformaron a log10 para
los cálculos. Con los datos de la CV, se analizó la re
-gresión en los pares plasma-SSPF, mediante el pro
-grama estadístico InfoStat, versión 1.1 (Córdoba, Argentina). El modelo del análisis de regresión obte
-nido se utilizó para pronosticar la CV en el plasma a partir del resultado en SSPF. Para ello se interpolaron los valores de la CV de las muestras de SSPF en el eje x, y los valores resultantes en el eje y
constitu-yeron los valores pronosticados de la CV del plasma de esas mismas muestras. La comparación de los valores reales y pronosticados de la CV en el plas
-ma, se realizó mediante una prueba t de Student. Se compararon las medias para muestras independientes, con el programa Statgraphics Plus versión 5.1, para Windows 5.1 (Maryland, EE.UU.).
La correlación entre los resultados de ambos ti
-pos de muestras se evaluó mediante el coeficiente de correlación lineal de Pearson, y la concordancia, con el método de Bland y Altman [11]. Antes se realizó la prueba de Shapiro-Wilk, con el paquete estadísti
-co R, versión 3.0.1 (Departamento de Estadísticas, Universidad de Kentucky, EE.UU.) para conocer si las diferencias entre los valores de la CV en los pares plasma-SSPF seguían una distribución normal.
Por último, se analizó la regresión en el estudio de la linealidad, y se calcularon los coeficientes de varia
-ción para evaluar las precisiones intra e interensayo.
5. Fiscus SA, Brambilla D, Grosso L, Schock J, Cronin M. Quantitation of human immunodeficiency virus type 1 RNA in plas-ma by using blood dried on filter paper. J Clin Microbiol. 1998;36(1):258-60.
6. O’Shea S, Mullen J, Corbett K, Chrys-tie I, Newell ML, Banatvala JE. Use of dried whole blood spots for quantification of HIV-1 RNA. Aids. 1999;13(5):630-1.
7. Mwaba P, Cassol S, Nunn A, Pilon R, Chintu C, Janes M, et al. Whole blood versus plasma spots for measurement of HIV-1 viral load in HIV-infected African patients. Lancet. 2003;362(9401):2067-8.
8. Ikomey GM, Atashili J, Okomo-Assoumou MC, Mesembe M, Ndumbe PM. Dried blood spots versus plasma for the quantification of HIV-1 RNA using the ma-nual (PCR-ELISA) amplicor monitor HIV-1 version 1.5 assay in Yaounde, Cameroon. J Int Assoc Physicians AIDS Care (Chic). 2009;8(3):181-4.
9. Mehta N, Trzmielina S, Nonyane BA, Eliot MN, Lin R, Foulkes AS, et al. Low-cost HIV-1 diagnosis and quantification in dried blood spots by real time PCR. PloS One. 2009;4(6):e5819.
10. WMA Declaration of Helsinki - Ethi-cal Principles for MediEthi-cal Research Involving Human Subjects [Internet]. Ferney-Voltaire: World Medical Asso-ciation, Inc.; 2013 [cited 2013 Oct 10]. Available from: http://www.wma.net/ en/30publications/10policies/b3/.
R
esultados y discusión
Los valores de ARN en el plasma de las 43 muestras estudiadas estuvieron entre 40 y 2 450 000 copias/mL, con una media de 10 000 copias/mL. En cuatro mues
-tras no se detectó ARN en la SSPF, para una tasa de detección total del 90.7 % (Tabla 1). Los valores de la CV en las 39 muestras de SPF con ARN detecta
-do promedió 2250 copias/mL y estuvo en el rango 40-155 000 copias/mL. La CV en el plasma de las cuatro muestras cuyo ARN en SSPF no se detectó, y osciló en el rango 40-216 copias/mL. De las mues
-tras cuyos niveles de CV en plasma eran inferiores a 1000 copias/mL, en el 63.6 %, se pudo cuantificar el ARN viral, cuando se utilizó SSPF. Esta afectación de la sensibilidad con la muestra de SSPF cuando los niveles de viremia son bajos también se ha eviden
-ciado con otras pruebas de cuantificación de la CV [12-14]; pero, aunque el éxito virológico de la tera
-pia antirretroviral significa llevar la CV a niveles no detectables, en la práctica clínica es habitual tomar decisiones cuando los niveles de ARN viral sobrepa
-san las 1000 copias/mL. Por ello, en nuestras con
-diciones, la inefectividad de cuantificación del ARN en el 36.4 % de las muestras de SSPF, con menos de 1000 copias/mL, es irrelevante para el seguimiento de los pacientes. En los 39 pares de muestras con ARN detectado, se obtuvo una elevada correlación de la CV (r = 0.964, p < 0.0001) (Figura 1), tal como ha sido reportado por otros grupos [15-18].
La diferencia promedio entre los valores de la CV obtenidos para ambos tipos de muestras fue de 1.07 log10 copias/mL. Se ha reportado diferencias de 0.53 log10 entre los resultados de los investigadores
que utilizaron plataforma y ensayo similares a los de este trabajo [17]. En otro estudio se obtuvo una di
-ferencia promedio de 1.0 log10, mediante la RCP en tiempo real con el instrumento Cobas®TaqMan® y un procedimiento de extracción diferente al nuestro [14]. De acuerdo con el modelo de Bland y Altman, los lí-mites de concordancia fueron 0.378 (0.178-0.577) y 1.771 (1.571-1.969) log10 copias/mL (media ± 1.96 veces la desviación estándar), respectivamente, y el 94.8 % de los valores estuvo en ese rango. Ello evi -denció una alta concordancia entre los valores de la
CV para ambos tipos de muestras (Figura 2). Los análisis de regresión en la evaluación de la li
-nealidad con la muestra de SSPF, en los tres ensayos, proyectaron valores de regresión muy cercanos a 1; de manera que el promedio fue 0.98. Este valor es muy similar al reportado por el fabricante de la prueba, para la muestra de plasma (0.989). La detección del ARN en SSPF fue lineal en un rango dinámico amplio de 134-420 000 (2.1-5.6 log10) copias/mL. El límite inferior de detección (LID) en este estudio fue menor que los LID que otros investigadores obtuvieron en estudios similares [19-21].
Como el volumen de entrada y el tipo de muestra influyen en la sensibilidad de estas pruebas, y en este estudio se está probando una muestra diferente y un volumen inferior a los que recomienda el fabricante, el reto está en conocer cuándo un resultado con SSPF debe ser analizado cuidadosamente. Ello dependerá de si hubiese contradicción con otros factores y pará
-metros analizados en el paciente en estudio. Es proba
-ble que en casos particulares, sea entonces necesario y
aconsejable el análisis de la CV en el plasma. A su vez, los niveles de la CV que indican momentos de impor
-tantes decisiones terapéuticas como el inicio del trata
-miento y el cambio de régimen terapéutico, este últi
-mo generalmente necesario por el fallo virológico, se cuantificaron con este ensayo usando SSPF, dado que el rango dinámico exhibido por la prueba con este tipo de muestra, los abarca. Los niveles de CV que motivan tales decisiones son carga viral mayor que 40 000 o 50 000 copias/mL o cuando el conteo de CD4 es me
-nor que 350 células/mm3, según las pautas cubanas
para la atención médica integral a las personas que viven con VIH/sida. Varios estudios han demostrado que el empleo de la SSPF es confiable para cuantificar
12. Johannessen A, Garrido C, Zahonero N, Sandvik L, Naman E, Kivuyo SL, et al. Dried blood spots perform well in viral load monitoring of patients who receive antiretroviral treatment in rural Tanzania. Clin Infect Dis. 2009;49(6):976-81. 13. Marconi A, Balestrieri M, Comastri G, Pulvirenti FR, Gennari W, Tagliazucchi S,
et al. Evaluation of the Abbott Real-Time
HIV-1 quantitative assay with dried blood spot specimens. Clin Microbiol Infect. 2009;15(1):93-7.
14. Andreotti M, Pirillo M, Guidotti G, Ceffa S, Paturzo G, Germano P, et al. Correlation between HIV-1 viral load quantification in plasma, dried blood spots, and dried plas-ma spots using the Roche COBAS Taqplas-man assay. J Clin Virol. 2010;47(1):4-7. Figura 1. Análisis de correlación entre la carga viral (CV)
ob-tenida a partir de muestras de plasma y sangre seca en papel de filtro (SSPF) de pacientes con virus de inmunodeficiencia humana tipo 1 (VIH-1). Coeficiente de correlación de Pearson: r = 0.964 (p < 0.0001).
CV del VIH-1 en el plasma
(log
10
copias/mL)
6
5
4
2
1.5 2.0 2.5 3.0 3.5 4.0 4.5 5.0 5.5
CV del VIH-1en SSPF (log10 copias/mL)
r2 = 0.9319
3
Tabla 1.Tasas de detección del ARN del VIH-1 en sangre seca en papel de filtro Carga viral en plasma
(log10 copias/mL) Muestras Muestras positivas Tasa de detección (%)
2-2.99 11 7 63.6
3-3.99 6 6 100
4-4.99 12 12 100
> 5 14 14 100
Total 43 39 90.7
Figura 2. Análisis de la concordancia entre los valores de carga viral (CV) del plasma y sangre seca en papel de filtro (SSPF), según el método de Bland y Altman. La línea sólida representa la diferencia media, y las líneas discontinuas, los intervalos superior e inferior de 1.96 veces la desviación estándar.
Diferencia de CV entre plasma y SSPF
(log
10
copias/mL)
0 0.5 2.0
3 4 5 6
2
Media de CV en plasma y SSPF (log10 copias/mL)
1.5
los niveles de viremia que caracterizan a esas fases de la infección [12, 14, 19]. Además, se conoce que la CV no es el único parámetro que evalúan los médicos especialistas clínicos en el momento de trazar estrate
-gias terapéuticas.
El volumen de SSPF utilizado para la cuantifica
-ción de la CV ha sido variable [22]. Algunos autores que utilizaron un volumen similar al utilizado en este estudio, obtuvieron resultados de menor sensibilidad [20, 21]. Una explicación pudiera ser que las prue
-bas utilizadas (Abbott Real Time, NucliSENSEasy Q HIV-1 y CAP/CTM HIV-1 Test; procedentes de varias casas comerciales) no focalizan la misma región del genoma para el análisis, difieren en el principio de am-plificación, en el límite inferior de detección, y en los reactivos y metodologías utilizados para la lisis [2].
En la tabla 2 se muestran los resultados de los estu
-dios de precisión intra e interensayos. Los coeficientes de variación obtenidos, inferiores al 10 %, indican que la precisión de la prueba con la muestra de SSPF fue satisfactoria. Sin embargo, en las concentraciones de 2.8 log10 y 2.1 log10 se aprecian algunos valores supe
-riores al 10 %. Y aunque se ha planteado que los coe
-ficientes de variación elevados, superiores al 20-30 %, se consideran aceptables para datos brutos [23], la afectación pudo deberse más a una manipulación in
-correcta que al tipo de muestra.
El análisis de regresión lineal en el estudio de corre-lación arrojó la ecuación: y = 1.18 x + 0.47.
Esta se utilizó como se describe en la sección de Materiales y métodos. El resultado de la comparación entre los valores reales y los pronosticados de la CV, en el plasma de las muestras estudiadas, se muestra en la figura 3. Se demostró que no hay diferencia estadís
-ticamente significativa entre las medias de los dos va
-lores, para un nivel de confianza del 95 %. Por tanto,
esta manera de calcular el valor de la carga viral del
VIH-1 en el plasma de las personas infectadas pudiera ser efectiva si consideramos que debe validarse el mo
-delo con un número más amplio de muestras.
C
onclusiones
En este estudio se obtuvieron resultados satisfactorios tras la cuantificación del ARN del VIH-1 a partir de muestras de SSPF con la prueba Cobas®Ampliprep/ Cobas®Taqman® HIV-1, versión 2.0 (Roche Mole
-cular Systems, Inc., Nueva Jersey, EE.UU.), que ava-lan su utilización. Aunque el universo de estudio no fue suficientemente extenso, estos resultados son alen-tadores, por las posibilidades que puede ofrecer el empleo de esta muestra como alternativa. Ello pu
-diera ser beneficioso para las personas que viven con
Figura 3. Comparación de medias por prueba t de Student entre los valores reales y pronosticados de carga viral (CV) del virus de inmundeficiencia humana tipo 1 (VIH-1) en el plasma. Intervalo de confianza del 95 % (IC 95%) para la media de CV real: 4.43462 ± 0.377713 (4.0569; 4.81233). IC 95 % para la media de CV pronosticada: 4.46283 ± 0.370786 (4.09204; 4.83361). La cruz representa la mediana de distri-bución de los datos.
CV real CV pronosticada
2.2 3.2 4.2 5.2 6.2 7.2
CV del VIH-1
(log
10
copias/mL)
VIH/sida, residentes en localidades cubanas aleja
-das de los laboratorios para el análisis de la carga viral. También en aquellas zonas en las que no exis
-ten las condiciones necesarias para el procesamiento de la sangre, el almacenamiento del plasma y su trans
-portación bajo refrigeración. Luego de validarse el modelo para el pronóstico de la CV en el plasma a partir de SSPF, se podrá recomendar la utilización de este tipo de muestra de forma confiable.
A
gradecimientos
Agradecemos a la Ing. MSc. Josefina de Calzadilla, de la Universidad Agraria de La Habana; a la Dra. Ileana Miranda, del Centro Nacional de Sanidad Agropecua
-ria y al MSc. Orlando Martínez, de la Universidad de las Ciencias Informáticas, por su valiosa contribución en los análisis estadísticos.
Concentración nominal de ARN del VIH-1 en plasma
(log10 copias/mL)a
Precisión interensayo (coeficiente de variación; %)
a Se evaluó la concentración nominal 1.4 log
10copias/mL del ARN del VIH-1 en plasma, pero la carga viral fue
indetectable en muestras de sangre seca en papel de filtro, por lo que no se calculó su coeficiente de variación.
Tabla 2. Resultados de los estudios de precisión intra e interensayos
5.6 4.9 4.2 3.5 2.8 2.1
2.40 0.90 3.00 3.30 8.40 9.20
1.30 2.30 2.50 4.80 8.03 15.30
1.10 2.00 1.60 4.30 27.70 16.70
1.70 0.90 0.46 2.00 10.20 7.30
Precisión intraensayo (coeficiente de variación; %)
Ensayo 1 Ensayo 2 Ensayo 3
15. Alvarez-Munoz MT, Zaragoza-Rodriguez S, Rojas-Montes O, Palacios-Saucedo G, Vazquez-Rosales G, Gomez-Delgado A, et al. High correlation of human immunodeficiency virus type-1 viral load measured in dried-blood spot samples and in plasma under different storage conditions. Arch Med Res. 2005;36(4):382-6.
16. Reigadas S, Schrive MH, Aurillac-Lavignolle V, Fleury HJ. Quantitation of HIV-1 RNA in dried blood and plasma spots. J Virol Methods. 2009;161(1):177-80.
17. Carmona S, Seiverth B, Horsfield P, eSa B, Goerdes M, Stevens W. Evaluation of COBAS®
AmpliPrep/ COBAS® TaqMan® HIV-1 v2.0 test on dried blood spots (DBS). Abstract No. TULBPE031. 6th IAS Conference on HIV pathogenesis and treatment; 2011; Rome, Italy. Geneva: Interna-tional AIDS Society; c2013 [cited 2013 Oct 10]. Available from: http://www.iasociety.org/Default. aspx?pageId=12&abstractId=200743912
18. Ouma KN, Basavaraju SV, Okonji JA, Williamson J, Thomas TK, Mills LA, et al. Evaluation of quantification of HIV-1 RNA viral load in plasma and dried blood spots by use of the semiautomated Cobas Amplicor assay and the fully automated Cobas Ampliprep/TaqMan assay, version 2.0, in Kisumu, Kenya. J Clin Microbiol. 2013;51(4):1208-18.
19. Brambilla D, Jennings C, Aldrovandi G, Bremer J, Comeau AM, Cassol SA, et al. Mul-ticenter evaluation of use of dried blood and plasma spot specimens in quantitative assays for human immunodeficiency virus RNA: mea-surement, precision, and RNA stability. J Clin Microbiol. 2003;41(5):1888-93.
21. Kane CT, Ndiaye HD, Diallo S, Ndiaye I, Wade AS, Diaw PA, et al. Quantitation of HIV-1 RNA in dried blood spots by the real-time NucliSENS EasyQ HIV-1 assay in Senegal. J Virol Methods. 2008;148(1-2):291-5.
22. Hamers RL, Smit PW, Stevens W, Schuur-man R, Rinke de Wit TF. Dried fluid spots for HIV type-1 viral load and resistance genotyping: a systematic review. Antivir Ther. 2009;14(5): 619-29.
23. Jacobson RH. Validation of serological assays for diagnosis of infectious diseases. Rev Sci Tech. 1998;17(2):469-526.
blood spot specimens
Nancy M Ruiz
1, María T Pérez
2,
Héctor M Díaz
3, Maricela Izquierdo
4,
Madeline Blanco
1,
Liuber Y Machado
1, Eladio Silva
41 Laboratorio de Biología Molecular 2 Subdirección Gestión de la Calidad
3 Laboratorio de Diagnóstico 4 Subdirección General Laboratorio de Investigaciones del Sida, Lisida Carretera de Jamaica y Autopista Nacional, San José de las Lajas, CP 32700, Mayabeque, Cuba
ABSTRACT Dried blood spot specimens on filter paper were evaluated to determine the viral load of the human immunodeficiency virus type 1 (HIV-1), through the Cobas®Ampliprep/Cobas®Taqman® HIV-1 test. RNA levels were quantified in pairs of plasma and dry blood spot specimens on filter paper from persons infected with HIV-1. The Pearson linear correlation coefficient was calculated as well as the agreement by the Bland-Altman method. Studies on precision, linearity and analytical sensitivity of the assay were also carried out. The linear regression model was used to predict the value of the viral load in the plasma. There was a high correlation in viral load measurements in the plasma and dried blood spot specimens, in 39 out of the 43 sample pairs studied (r = 0.964, p < 0.0001). Detection rate was 90.7 % and the test behaved linearly between 134 and 420 000 copies/mL of viral RNA, showing good precision. No statistically significant differences were observed between the means of the true and predicted values of viral load in the plasma, with a 95 % confidence level. These results support the use of dried blood spots on filter paper for viral load determination with the Cobas®Ampliprep/Cobas®Taqman® HIV-1 Test. Authors recommend the validation of the model proposed with a larger number of samples.
Keywords: HIV-1, RNA, viral load, dried blood spots, CAP/CTM HIV-1 Test
Biotecnología Aplicada 2014;31:146-149
RESUMEN Determinación de la carga viral del VIH-1 en muestras de sangre seca en papel de filtro. Para la determinación de la carga viral del virus de la inmunodeficiencia humana tipo 1 (HIV-1), se evaluaron muestras de sangre seca en papel de filtro, mediante la prueba Cobas®Ampliprep/Cobas®Taqman® HIV-1. Se cuantificó el ARN en pares de muestras plasma-sangre seca en papel de filtro, provenientes de personas infectadas con el HIV-1. Se calculó el coeficiente de correlación lineal de Pearson y la concordancia mediante el método de Bland y Altman. Se estudiaron la precisión y la linealidad, y se determinó la sensibilidad analítica del ensayo. El modelo producto de la regresión lineal se utilizó para pronosticar el valor de la carga viral en el plasma. Hubo una elevada correlación entre las mediciones de la carga viral en el plasma y la sangre seca en papel de filtro, en 39 de los 43 pares de muestras estudiados (r = 0.964, p < 0.0001). La tasa de detección fue del 90.7 %. Se apreció un comportamiento lineal entre 134 y 420 000 copies/mL de ARN viral, con precisión satisfactoria. Se demostró que no existen diferencias estadísticamente significativas entre las medias de los valores de carga viral pronosticados y reales en el plasma, mediante un nivel de confianza del 95 %. Tales resultados apoyan el empleo de muestras de sangre seca en papel de filtro, para la determinación de la carga viral del HIV, mediante la prueba Cobas®Ampliprep/Cobas® Taqman® HIV-1. Se recomienda validar el modelo propuesto con un número más amplio de muestras.
Palabras clave: VIH-1, ARN, carga viral, sangre seca en papel de filtro, CAP/CTM HIV-1 Test
I
ntroduction
The quantitative determination of RNA or viral load
(VL) of human immunodeficiency virus type 1 (HIV-1) in the plasma, is an essential tool to assess the risk of the progress of the infection toward the acquired immunodeficiency syndrome (AIDS), and the effec-tiveness of the anti-retroviral therapy in patients [1].
Commercial assays available today to determine VL are the outcome of advances in research, mainly focused on increasing the sensitivity, precision, dynamic ranges and identification of the genetic variants of a virus characterized by its high mutation rate [2, 3]. These trials operate on technologies such as real time polymerase chain reaction (RT-PCR), which
has enabled the automation of the systems, reducing human error and increasing working efficiency [4].
Although the ideal specimen for VL quantification of HIV-1 is the plasma, certain researchers have tested dried blood spots specimens (DBS) on filter paper using different commercial kits or standardized laboratory methods, because of its economic and technical advantages. DBS has shown its usefulness, above all in locations lacking the costly infrastructure used for regular trials [5-9].
In Cuba, as part of the decentralized medical care medical care of people living with HIV/AIDS, several laboratories have been set up to facilitate the
1. Mellors JW, Munoz A, Giorgi JV, Margolick JB, Tassoni CJ, Gupta P, et al. Plasma viral load and CD4+ lymphocytes as prognostic markers of HIV-1 infection. Ann Intern Med. 1997;126(12):946-54.
2. Luft LM, Gill MJ, Church DL. HIV-1 viral diversity and its implications for viral load testing: review of current platforms. Int J Infect Dis. 2011;15(10):e661-70.
3. Cobb BR, Vaks JE, Do T, Vilchez RA. Evolution in the sensitivity of quantitative HIV-1 viral load tests. J Clin Virol. 2011;52 Suppl 1:S77-82.
patients’ access to VL determinations. A test from Roche Molecular Systems, which has been validated for human plasma specimens, is used for this purpose. However, specimen processing and transportation for the assay is hindered in rural and mountainous areas.
This test has not been well assessed with DBS, but this sample type has advantages that makes it attractive. They include its stability, in spite of high temperature, and ease of transportation, by which specimens can even be sent through the postal system. Therefore, we decided to evaluate DBS with the Cobas®Ampliprep/Cobas®Taqman® HIV-1 test, ver-sion 2.0 (Roche Molecular Systems, Inc., New Jersey, USA), as an alternative to simplify specimen pro-cessing and transfer for VL determination in special-ized laboratories.
M
aterials and methods
Ethics
Procedures followed the ethical standards of the Ministry of Public Health (MINSAP), and of the Ministry of Science, Technology and Environment (CITMA), of the Republic of Cuba, which take into account the principles of the Helsinki Declaration for medical research in humans [10]. An informed consent was obtained from each patient participating in the study before taking the blood sample, and their identity remained confidential.
Patients and specimens, blood processing, HIV-1 RNA quantification
Forty-three specimens of total blood were obtained from persons infected with HIV-1, using ethylene-diamine-tetra acetic acid (EDTA) as the anticoagulant, to study the correlation between VL in the plasma and in the DBS. The samples were taken regardless of the infective genetic variant of the subjects in the study and whether or not they were under anti-retroviral treatment. Drops of 50 µL of blood were applied on cards of filter paper 903 (Whatman, Madstone, United Kingdom), which had been labeled to identify each patient. The remaining blood plasma was separated by centrifugation at 1600 × g for 20 min, in a centrifuge model 3K15 (Sigma, USA); it was dispensed in aliquots of 1.5 mL in sterile polypropylene test tubes and frozen at -15 ºC. The cards with the blood spots were left to dry at room temperature (approximately 24 ºC) for 16 to 18 h. They were later placed in individual plastic bags containing desiccants and stored at 2-8 ºC until their analysis. Both the plasma and the DBS cards were preserved until they were used.
To evaluate linearity, precision and the sensitivity of the trial with DBS we also obtained total blood, using EDTA as the anti-coagulant, from a patient with a plasma VL of 4.2 × 10⁵ copies/mL. Serial dilutions were prepared on a basis of 5, from 1:5 to 1:15 625, for which O negative blood (O-) from a donor who was seronegative to HIV, as well as to the Hepatitis C and Hepatitis B viruses, was used as a diluent. The product of each dilution was applied in drops of 50 µL on filter paper cards, and the same procedure described above was used for drying and preservation. Linearity was assessed by three trials. The VL was quantified in
the pure DBS specimen and in the six serial dilutions prepared from it. Three replicates of all concentrations used were tested, and the trials were performed on different days, so that the results could be used to analyze precision and determine sensitivity.
For DBS specimen processing two spots were cut (equivalent to 100 µL), from the filter paper card, and they were then cut again into smaller fragments and placed in a sterile polypropylene test tube. A total of 1.2 mL of the regulating solution Tris-EDTA (Tris-HCl 1.0 mol/L, pH 8.0; EDTA 0.1 mol/L) were added for blood elution for 2 h, at 2-8 ºC. Later, 1 mL was recovered from the content of the test tube, for its analysis.
The Cobas®Ampliprep/Cobas®Taqman® HIV-1 Test, version 2.0 (Roche Molecular Systems, Inc., New Jersey, USA) was used according to the manufacturer’s indications. The only change was the use of a sample of DBS by the described procedure. This test, targeted on the gag and LTR regions of the genome of the HIV-1, for its amplification and detection, and having a sensitivity of 20 copies/mL, was carried out on the platform for the real time PCR Cobas®Ampliprep/Cobas®Taqman® 48 (CAP/CTM 48) (Roche Molecular Systems, Inc., New Jersey, USA), and all operations were performed from the data station of the device, using the Amplilink, version 3.2 program.
Statistical processing and interpretation of results
The values of VL are transformed to log10 for the calcu-lations. With the values of VL, we analyzed the regre-ssion in the plasma-DBS pairs using the InfoStat, version 1.1 statistical program (Córdoba, Argentina). The model from the regression analysis obtained was used to predict the VL in the plasma through the result given by the DBS. The values of the VL of the DBS specimens were thereby interpolated in the x axis, and the resulting values from the y axis were the values predicted from the VL of the plasma in these same samples. The means of the true and predicted values of VL were compared by a Student's t test for independent samples, with the Statgraphics Plus softwarefor Windows, version 5.1 (Maryland, USA).
The correlation between the results of both types of samples was evaluated through the Pearson linear coefficient of correlation, and for their agreement the Bland-Altman method was used [11]. Before this, the Shapiro-Wilk test was carried out, with the statistical package R, version 3.0.1 (Statistics Department of the University of Kentucky, USA) to know if the differ-ences between the values of the VL in the plasma-DBS pairs followed a normal distribution.
Finally, the regression in the linearity study was analyzed, and the coefficients of variation were cal-culated to evaluate the intra- and inter-assay precision.
R
esults and discussion
The values of RNA in the plasma of the 43 specimens studied were in the range of 40 to 2 450 000 copies/mL, with a mean of 10 000 copies/mL. No RNA was de-tected in four specimens of DBS, for a total detection rate of 90.7 % (Table 1). The VL in the 39 samples of DBS with detected RNA averaged 2250 copies/mL and ranged from 40 to 155 000 copies/mL. The VL in the
4. Espy MJ, Uhl JR, Sloan LM, Buckwalter SP, Jones MF, Vetter EA, et al. Real-time PCR in clinical microbiology: applications for routine laboratory testing. Clin Microbiol Rev. 2006;19(1):165-256.
5. Fiscus SA,Brambilla D, Grosso L, Schock J, Cronin M. Quantitation of human immunodeficiency virus type 1 RNA in plasma by using blood dried on filter paper. J Clin Microbiol. 1998;36(1):258-60.
6. O’Shea S, Mullen J, Corbett K, Chrystie I, Newell ML, Banatvala JE. Use of dried whole blood spots for quantification of HIV-1 RNA. Aids. 1999;13(5):630-1.
7. Mwaba P, Cassol S, Nunn A, Pilon R, Chintu C, Janes M, et al. Whole blood versus plasma spots for measurement of HIV-1 viral load in HIV-infected African patients. Lancet. 2003;362(9401):2067-8.
8. Ikomey GM, Atashili J, Okomo-Assoumou MC, Mesembe M, Ndumbe PM. Dried blood spots versus plasma for the quantification of HIV-1 RNA using the manual (PCR-ELISA) amplicor monitor HIV-1 version 1.5 assay in Yaounde, Cameroon. J Int Assoc Physicians AIDS Care (Chic). 2009;8(3):181-4.
9. Mehta N, Trzmielina S, Nonyane BA, Eliot MN, Lin R, Foulkes AS, et al. Low-cost HIV-1 diagnosis and quantification in dried blood spots by real time PCR. PloS One. 2009;4(6):e5819.
plasma of four samples, where the RNA was not detected in the DBS, was in the range of 40 to 216 copies/mL. The viral RNA was quantified in 63.6 % of the spe-cimens showing levels of VL in the plasma lower than 1000 copies/mL, when using DBS. This effect on the sensitivity of the DBS specimen when viral levels are low has also been found in other VL quantification tests [12-14]. Nonetheless, although the virologic success of the antiretroviral therapy is measured by the VL reach-ing undetectable levels, in clinical practice it is normal to make decisions when the levels of viral RNA surpass 1000 copies/mL. Therefore, under our conditions, the ineffectiveness of RNA quantification in 36.4 % of the DBS specimens with less than 1000 copies/mL is irrelevant for the follow-up of these patients.
In the 39 pairs of samples where RNA was detected, we obtained a high correlation of the VL (r = 0.964, p < 0.0001) (Figure 1), as reported by other groups [15-18].
The average difference between the values of the VL obtained for both types of samples was of 1.07 log10 copies/mL. Differences of 0.53 log10 have been reported between the results of the researchers using platforms and assays that are similar to this study [17]. In another study there was an average difference of 1.0 log10, by using the Cobas® TaqMan® instrument and with an extraction procedure that differed from ours [14]. According to the Bland-Altman model, the agreement limits were 0.378 (0.178-0.577) and 1.771 (1.571-1.969) log10 copies/mL (mean ± 1.96 times the standard deviation), respectively, and 94.8 % of the values were in that range. This showed a high agreement between the values of the VL for both types of samples (Figure 2).
The regression analysis in the linearity evaluation with the sample of DBS, in the three assays, showed regression values that were very close to 1, with an average of 0.98. This value is very similar to that reported by the manufacturer of the test for the plasma specimen (0.989). The detection of RNA in DBS was linear within a wide dynamic range of 134-420 000 (2.1-5.6 log10) copies/mL. The lower limit of detection (LLD) in this study was less than the LLD found by other researchers in similar studies [19-21].
Since the input volume and the type of sample influence the sensitivity of these tests, and in this study we are testing a different type of sample and a volume lower than that recommended by the manufacturer, the challenge is to know when a result with DBS should be considered cautiously. This depends on a possible contradiction with other factors and parameters ana-lyzed in the patient in this study. Probably, in specific cases, it may be necessary and advisable to analyze the VL in the plasma.
At the same time, the levels of VL that would indicate when important therapeutic decisions must be made, such as the start of the treatment and a change in the therapeutic regime, the latter being generally necessary because of the virological failure, are quantified here using DBS, since the dynamic range shown by the test with this type of sample is able to cover it. The levels of VL leading to these decisions are when viral load is higher than 40 000 or 50 000 copies/mL, or when the CD4 count is less than 350 cells/mm3, according to the Cuban standards for comprehensive
medical care for persons living with HIV/AIDS. Sev-eral studies have demonstrated that the use of DBS is reliable for quantifying levels of viremia that char-acterize these infection stages [12, 14, 19]. Moreover, it is known that the VL is not the only parameter eval-uated by specialized clinical physicians when design-ing therapeutic strategies.
The volume of DBS used to quantify the VL has been variable [22]. Some authors using a volume similar to that of this study obtained results showing less sensitivity [20, 21]. One explanation for this could be that the tests used (Abbott Real Time, NucliSENSEasy Q HIV-1 and CAP/CTM HIV-1 Test; from several
11. Bland JM, Altman DG. Statistical methods for assessing agreement between two methods of clinical measurement. Lancet. 1986;1(8476):307-10.
12. Johannessen A, Garrido C, Zahonero N, Sandvik L, Naman E, Kivuyo SL, et al. Dried blood spots perform well in viral load monitoring of patients who receive antiretroviral treatment in rural Tanzania. Clin Infect Dis. 2009;49(6):976-81.
13. Marconi A, Balestrieri M, Comastri G, Pulvirenti FR, Gennari W, Tagliazucchi S,
et al. Evaluation of the Abbott Real-Time
HIV-1 quantitative assay with dried blood spot specimens. Clin Microbiol Infect. 2009;15(1):93-7.
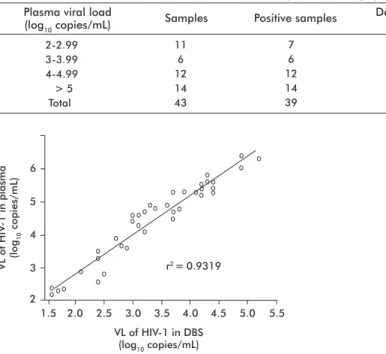
Table 1. Detection rate of HIV-1 RNA in dried blood spots on filter paper Plasma viral load
(log10 copies/mL) Samples Positive samples Detection rate (%)
2-2.99 11 7 63.6
3-3.99 6 6 100
4-4.99 12 12 100
> 5 14 14 100
Total 43 39 90.7
Figure 1. Analysis of the correlation between the viral load (VL) obtained from plasma specimens and dried blood spots (DBS) of patients with the human immunodeficiency virus type 1 (HIV-1). Pearson’s correlation coefficient: r = 0.964 (p < 0.0001).
VL of HIV
-1 in plasma
(log
10
copies/mL)
6
5
4
2
1.5 2.0 2.5 3.0 3.5 4.0 4.5 5.0 5.5
VL of HIV-1 in DBS (log10 copies/mL)
r2 = 0.9319
3
Figure 2. Analysis of the agreement between the values of viral load (VL) of the plasma and dried blood spots (DBS), according to the Bland-Altman method: The continuous line represents the mean difference, and the dotted lines are the upper and lower intervals of 1.96 times the standard deviation.
Mean VL in plasma and DBS (log10 copies/mL)
Difference in VL between plasma and DBS
(log
10
copies/mL)
0 0.5 2.0
3 4 5 6
2 1.5
companies) do not focus on the same region of the genome for the analysis; they differ in the amplification principle, in the lower detection limit, and in the reagents and methodologies used for the lysis [2].
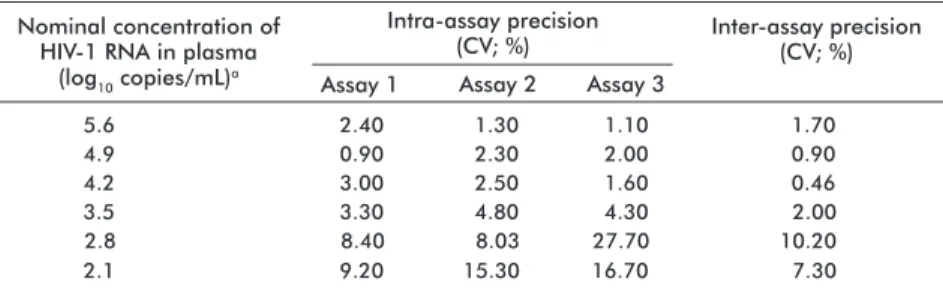
Table 2 shows the results of the intra- and inter-assay precision tests. The coefficients of variation obtained, which were less than 10 %, indicate that the precision of the test with the DBS sample was satisfactory. However, in the concentrations of 2.8 log10 and 2.1 log10 some of the values are higher than 10 %; and although it has been stated that high coefficients of variation, of over 20-30 %, are considered acceptable for crude data [23], the effect may be largely due to incorrect handling, rather than the type of specimen.
The linear regression analysis in the correlation study resulted in the following equation: y = 1.18 x + 0.47. This was used as described in the Materials and Meth-ods section. The results of the comparison between the true and predicted values of the VL, in the plasma of the samples studied, are shown in figure 3. It was demonstrated that there is no significant statistical difference between the means of both values, for a con-fidence level of 95 %. Therefore, this way of cal-culating the value of the viral load of HIV-1 in the plasma of infected persons, could be effective if we consider that the model should be validated with a larger number of samples.
C
onclusions
Satisfactory results were obtained in this studyafter quantifying the RNA from the HIV-1 through DBS spec-imens with the Cobas®Ampliprep/Cobas® Taqman® HIV-1 test, version 2.0 (Roche Molecular Systems, Inc., New Jersey, USA), endorsing its use. Although the universe of the study was not sufficiently large, these results are encouraging, due to the possibilities of the use of this type of specimen as a valid alternative. This may be beneficial for persons living with HIV/ AIDS who have to come from Cuban areas located far from the laboratories for the analyses of their viral load. It is also useful for those people living in areas where the conditions are inappropriate for blood processing, plasma storage and its refrigerated transportation. After validating the model for the prediction of the VL in the plasma through the use of DBS, it may be
possible to recommend the utilization of this type of sample in a reliable manner.
A
cknowledgements
We would like to thank Eng. Josefina de Calzadilla, MSc., from the Agrarian University of Havana; Dr. Ileana Miranda, from the National Agricultural Health Center (CENSA by its Spanish acronym) and Orlando Martínez, MSc. from the University of Information Technology Sciences, for their valuable contribution to the statistical analyses.
15. Alvarez-Munoz MT, Zaragoza-Rodriguez S, Rojas-Montes O, Palacios-Saucedo G, Vazquez-Rosales G, Gomez-Delgado A, et al. High correlation of human immunodeficiency virus type-1 viral load measured in dried-blood spot samples and in plasma under different storage conditions. Arch Med Res. 2005;36(4):382-6.
16. Reigadas S, Schrive MH, Aurillac-Lavignolle V, Fleury HJ. Quantitation of HIV-1 RNA in dried blood and plasma spots. J Virol Methods. 2009;161(1):177-80.
17. Carmona S, Seiverth B, Horsfield P, eSa B, Goerdes M, Stevens W. Evaluation of COBAS® AmpliPrep/ COBAS® TaqMan® HIV-1 v2.0 test on dried blood spots (DBS). Abstract No. TULBPE031. 6th IAS Conference on HIV pathogenesis and treatment; 2011; Rome, Italy. Geneva: International AIDS Society; c2013 [cited 2013 Oct 10]. Available from:
http://www.iasociety.org/Default.aspx?pageI d=12&abstractId=200743912
18. Ouma KN, Basavaraju SV, Okonji JA, Williamson J, Thomas TK, Mills LA, et al. Evaluation of quantification of HIV-1 RNA viral load in plasma and dried blood spots by use of the semiautomated Cobas Amplicor assay and the fully automated Cobas Ampliprep/TaqMan assay, version 2.0, in Kisumu, Kenya. J Clin Microbiol. 2013;51(4):1208-18.
19. Brambilla D, Jennings C, Aldrovandi G, Bremer J, Comeau AM, Cassol SA, et al. Multicenter evaluation of use of dried blood and plasma spot specimens in quantitative assays for human immunodeficiency virus RNA: measurement, precision, and RNA stability. J Clin Microbiol. 2003;41(5):1888-93.
20. Abravaya K, Huang S, Erickson B, Mak W-B. The use of dried blood spots with the Abbott
RealTime HIV-1 viral load assay. Abstract No. CDB0034. AIDS 2008 - XVII International AIDS Conference. 3-8 August 2008, Mexico City, Mexico. Geneva: International AIDS Society; c2013 [cited 2013 Oct 10]. Available from: http://ias2007.org/Abstracts/A200718278.aspx
21. Kane CT, Ndiaye HD, Diallo S, Ndiaye I, Wade AS, Diaw PA, et al. Quantitation of HIV-1 RNA in dried blood spots by the real-time NucliSENS EasyQ HIV-1 assay in Senegal. J Virol Methods. 2008;148(1-2):291-5.
22. Hamers RL, Smit PW, Stevens W, Schuurman R, Rinke de Wit TF. Dried fluid spots for HIV type-1 viral load and resistance genotyping: a systematic review. Antivir Ther. 2009;14(5): 619-29.
23. Jacobson RH. Validation of serological assays for diagnosis of infectious diseases. Rev Sci Tech. 1998;17(2):469-526.
Received in November, 2013.
Nominal concentration of HIV-1 RNA in plasma
(log10 copies/mL)a
Inter-assay precision (CV; %)
a The nominal concentration 1.4 of the HIV-1 RNA in plasma was also tested, but its viral load was undetectable
in dried blood spots on filter paper. Therefore, its coefficient of variation (CV) was not calculated.
Table 2.Results of the intra-and inter-assay precision studies
5.6 4.9 4.2 3.5 2.8 2.1
2.40 0.90 3.00 3.30 8.40 9.20
1.30 2.30 2.50 4.80 8.03 15.30
1.10 2.00 1.60 4.30 27.70 16.70
1.70 0.90 0.46 2.00 10.20 7.30
Intra-assay precision (CV; %)
Assay 1 Assay 2 Assay 3
Figure 3. Comparison of the means per t test between the true and predicted values of viral load (VL) of the human im-munodeficiency virus type 1 (HIV-1) in the plasma: the 95 % confidence interval (CI 95 %) for the mean of the true VL: 4.43462 ± 0.377713 (4.0569; 4.81233). CI 95 % for the mean of the predicted VL: 4.46283 ± 0.370786 (4.09204; 4.83361). The cross represents the median of the data distribution.
2.2 3.2 4.2 5.2 6.2 7.2
VL of HIV
-1
(log
10
copies/mL)