Comparison of Dynamic
Changes Among Various Prognostic Scores
in Viral Hepatitis-Related Acute Liver Failure
Shalimar,* Ujjwal Sonika,* Saurabh Kedia,* Soumya J. Mahapatra,* Baibaswata Nayak,* Dawesh P. Yadav,* Deepak Gunjan,* Bhaskar Thakur,** Harpreet Kaur,* Subrat K. Acharya*
* Department of Gastroenterology and Human Nutrition, All India Institute of Medical Sciences, New Delhi, India. ** Department of Biostatistics, All India Institute of Medical Sciences, New Delhi, India
May-June, Vol. 17 No. 3, 2018: 403-412
INTRODUCTION
Acute liver failure (ALF) is a rare clinical entity marked by sudden loss of hepatic function and a severe life-threat-ening course in a person without prior history of liver dis-ease.1 The mortality may be as high as 90%, depending
upon the etiology and reference center.2-6 Hepatitis
virus-es are the commonvirus-est cause of ALF in the East,7,8 whereas
drug induced (especially acetaminophen) hepatotoxicity is the most common cause in the West.3,4,9 Liver
transplanta-tion (LT) is the only definitive optransplanta-tion to improve survival in these patients. The availability of donors is the major limiting factor. Moreover, delay in consideration for LT may lead to demise of the patient. Furthermore, it is also
essential to identify patients who are likely to recover spontaneously, in order to avoid unnecessary LT and life-long immunosuppression. Therefore, an ideal test or a prognostic score is needed to predict outcome.
A number of prognostic models have been proposed. Among these, King’s College Hospital (KCH) criteria,10
model for end stage liver disease (MELD)11 and acute
liv-er failure early dynamic model (ALFED)12 are commonly
used in clinical practice. Other prognostic scores include MELD-Na13 and sequential organ failure score.14
Recent-ly, a new prognostic score has been developed for acute on chronic liver failure (ACLF)- the chronic liver failure consortium acute on chronic liver failure (CLIF-C ACLF) score. This is a composite score involving six or-The Official Journal of the Mexican Association of Hepatology,
the Latin-American Association for Study of the Liver and the Canadian Association for the Study of the Liver
Manuscript received: Manuscript received:Manuscript received:
Manuscript received:Manuscript received: June 03, 2017. Manuscript accepted:Manuscript accepted:Manuscript accepted:Manuscript accepted:Manuscript accepted: August 03, 2017.
DOI:10.5604/01.3001.0011.7384
A B S T R A C T A B S T R A C T A B S T R A C T A B S T R A C T A B S T R A C T
Introduction and aim. Introduction and aim.Introduction and aim. Introduction and aim.
Introduction and aim. Multiple prognostic scores are available for acute liver failure (ALF). Our objective was to compare the dy-namicity of model for end stage liver disease (MELD), MELD-sodium, acute liver failure early dynamic model (ALFED), chronic liver failure (CLIF)-consortium ACLF score and King's College Hospital Criteria (KCH) for predicting outcome in ALF. Materials andMaterials andMaterials andMaterials andMaterials and methods.
methods.methods. methods.
methods. All consecutive patients with ALF at a tertiary care centre in India were included. MELD, MELD-Na, ALFED, CLIF-C ACLF scores and KCH criteria were calculated at admission and day 3 of admission. Area under receiver operator characteristic curves (AUROC) were compared with DeLong method. The sensitivity, specificity, positive predictive value (PPV), negative predic-tive value (NPV), likelihood ratio (LR) and diagnostic accuracy (DA) were reported. Results.Results.Results.Results. Of the 115 patients included in theResults. study, 73 (63.5%) died. The discrimination of mortality with baseline values of prognostic scores (MELD, MELD-Na, ALFED, CLIF-C ACLF and KCH) was modest (AUROC: 0.65-0.77). The AUROC increased on day 3 for all scores, except KCH criteria. On day 3 of admission, ALFED score had the highest AUROC 0.95, followed by CLIF-C ACLF 0.88, MELD 0.81, MELD-Na 0.77 and KCH 0.52. The AUROC for ALFED was significantly higher than MELD, MELD-Na and KCH (P < 0.001 for all) and CLIF-C ACLF (P = 0.05). ALFED score ≥ 4 on day 3 had the best sensitivity (87.1%), specificity (89.5%), PPV (93.8%), NPV (79.1%), LR positive (8.3) and DA (87.9%) for predicting mortality. Conclusions.Conclusions.Conclusions.Conclusions. Dynamic assessment of prognostic scores better predicts outcome. ALFEDConclusions. model performs better than MELD, MELD, MELD-Na, CLIF-C ACLF scores and KCH criteria for predicting outcome in viral hepati-tis-related ALF.
Key words. Key words.Key words. Key words.
gan failures (OFs), age and total leucocyte count.15
CLIF-C ACLIF-CLF score has not yet been validated in studies of ALF patients. KCH criteria has high specificity, but poor sensi-tivity in predicting outcome.16 Thus, inability to identify
sick patients who can be considered for a timely LT is a major limitation of KCH criteria. A recent meta-analysis concluded that KCH predicts mortality better in paraceta-mol-induced ALF, whereas MELD scores predict mortal-ity better in patients with non-paracetamol induced ALF.16
In contrast, MELD-Na score in ALF patients has been shown to be inferior to MELD in predicting prognosis.17
A recent study reported dynamic model to be better than static model for predicting outcome in paracetamol in-duced ALF.18 Therefore, the aim of the present study was
to compare the dynamicity of available prognostic scores for predicting mortality in patients with viral hepatitis-re-lated ALF.
MATERIAL AND METHODS
In this prospective study, all consecutive ALF patients admitted at the All India Institute of Medical Sciences, New Delhi, India between July 2011 and March 2016 were included. Patients with hospital stay of less than 2 days were excluded as they died early in the course of the disease and hence their dynamic prognostic scores could not be determined. Patients with anti-tuberculosis drugs induced ALF and those with incomplete etiology work-up were also excluded. Due to rarity of the ALF cases, we did not calculate the sample size for the prognostic scores; in-stead, took all consecutive ALF patients admitted during the study period.
Definitions of variables
ALF was defined as per International Association for the Study of Liver (IASL) criteria, as the occurrence of he-patic encephalopathy (HE) within 4 weeks of onset of symptoms in the absence of preexisting liver disease.19
Grading of HE was done as follows:20
• Grade 1. Loss of sleep rhythm, drowsiness, confusion and flapping tremors.
• Grade 2. Features of grade 1 HE with loss of sphinc-ter control in addition.
• Grade 3. Unconsciousness with no response to oral commands, but responding to painful stimuli.
• Grade 4. Deep unconscious state, with no response to pain. In this study, we used the terms-early HE (grade 1 and 2) and advanced HE (grade 3 and 4).
Pre-encephalopathy interval (PEI) and icterus-enceph-alopathy interval (IEI) were defined as the intervals from
the onset of prodrome and jaundice, respectively, to the onset of HE.7 Encephalopathy to admission interval (EAI)
was defined as the interval between onset of HE to admis-sion at our hospital.
Cerebral edema was defined clinically by the presence of spontaneous or inducible decerebrate posturing, or the pres-ence of two or more of the following: hypertension (blood pressure ≥ 150/90 mmHg), bradycardia (heart rate, < 60/ min), pupillary changes or neurogenic hyperventilation.7
Infection was diagnosed by the presence of pyrexia (temperature > 101°F) or hypothermia (temperature < 98°F) and neutrophil leucocytosis (total leucocyte count > 15,000/mm3, with ≥ 80% polymorphs), and one or more of
the following: positive blood culture, positive urine cul-ture, and or radiographic evidence of pneumonitis.7
Hos-pital stay was calculated as the duration in days from admission till discharge or death. Etiology of ALF was de-fined as per the standard definitions.7 The details of
etio-logical work-up are provided in the Annex 1.
The following clinical and laboratory parameters were collected: age, sex, PEI, IEI, EAI, presence of gastrointes-tinal bleeding, cerebral edema, requirement of ventilator support, grade of HE, infection, etiology of ALF and hos-pital stay in days. In addition to these clinical details, other laboratory parameters were obtained after admission in-cluding- hemoglobin, total leucocyte count, platelet count, international normalized ratio (INR), serum creati-nine, serum sodium, total bilirubin, aspartate aminotrans-ferase, alanine aminotransaminotrans-ferase, serum albumin levels, arterial pH and arterial ammonia. All of the above labora-tory parameters were repeated daily for 5 consecutive days. The KCH criteria,10 MELD score,11 MELD-Na,13
ALFED12 and CLIF-C ACLF score15 were calculated as
per the standard criteria- at baseline and then at day 3 of admission. The study was approved by the institute’s eth-ics committee and consent was obtained from the patient or the nearest relatives in case of hepatic encephalopathy.
Managements protocol
All patients were admitted to the Gastroenterology in-tensive care unit, and had continuous, non-invasive cardi-ac, oxygen saturation and blood pressure monitoring. Central venous lines were inserted in all cases. Blood sug-ar was checked two hourly. Serum electrolytes, blood urea, and serum creatinine, and arterial blood gases were estimated daily. Arterial ammonia was estimated daily by an enzymatic method (Randox Lab Ltd, UK) in heparinised plasma.
ventilation for patients with cerebral edema and/or grade 4 HE. Prophylactic parenteral antibiotics were started at presentation in all cases (cefoperazone and sulbactam, van-comycin, and fluconazole). This prophylactic antibiotic therapy was modified, as indicated, based on the results of positive cultures. Antibiotics were continued till com-plete neurological recovery, and absence of clinical or ra-diological evidence of ongoing infection. Ventilatory support was offered to those with grade 3 HE and overt features of cerebral edema, and in all patients admitted with grade 4 HE, as per our protocol management policy in ALF. Deceased donor LT program has recently been started in our hospital. However, none of the patients of this study underwent LT, due to non-availability of organs; all patients were followed up until recovery or demise.
Data analysis and statistics
Normally distributed continuous variables were ex-pressed as median (interquartile range, IQR). Mann-Whit-ney U test was used for continuous variables, and Chi-square or Fishers test for discrete variables, wherever applicable. The level of significance was set at P = 0.05. All factors significant in univariate analysis were included in the multivariate cox-proportional hazard analysis for outcome. The variables with a significance of P ≤ 0.10 in the univariate analysis were taken for multivariate analysis. Receiver Operator Characteristic (ROC) curves were used to identify the cut-off points for various prognostic scores at admission and day 3. We included 137 patients (115 as per inclusion criteria and 22 who died within 48 h of admission) to assess the performance of the prognostic scores at admission; 115 patients were included to assess the dynamic assessment of prognostic scores. Based on best cut-off points obtained from the ROC curves, differ-ent diagnostic measures such as sensitivity, specificity and predictive values were reported. The PPV and NPV of a model are important parameters for selecting a candidate for LT. Preferences for PPV ensure that all patients who need a transplant get it while a preference for NPV mini-mizes unnecessary LT. Pairwise comparison of the area under ROC (AUROC) curve for competing prognostic scores was done by DeLong method both on day of ad-mission and day 3 of adad-mission. The data was analyzed us-ing IBM SPSS Statistics software (version 20.0, Chicago, IL, USA), and Medcalc software (version 15.11.4, Med-Calc Software, Ostend, Belgium).
RESULTS
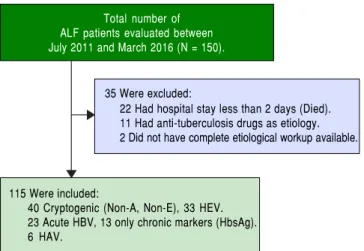
A total of 150 patients were evaluated during the study period. Of these 35 patients were excluded- 22 had a
hos-pital stay of less than 2 days; 11 had anti-tuberculosis drugs as etiology, and in 2 patients the work for etiology was in-complete (Figure 1). Of the 115 patients included in the study, 73 (63.5%) died and 42 (36.5%) survived.
Baseline demographic and
clinical characteristics on day of admission
Most patients were young with median age 25 years and 57 (49.6%) were females. The median PEI, IEI and EAI were 7, 4 and 2, respectively. At presentation, cerebral ede-ma, early HE and advanced HE were present in 61 (53.0%), 34 (29.6%) and 81 (70.4%) patients respectively. On the day of admission, ventilator support was required in 68 (59.1%) patients. The median creatinine was 0.9 mg/dL, and 17 (14.8%) patients had creatinine more than 1.5 mg/ dL. The median INR was 3.5. The median arterial ammo-nia was 131 μmol/L. The median hospital stay was 4 days. The various viral etiologies included- cryptogenic (Non-A, Non-E) in 40 (34.8%), followed by hepatitis E virus in-fection in 33 (28.7%), acute-hepatitis B virus in 23 (20.0%), chronic markers (HBsAg) were present in 13 (11.3%), hepatitis A virus in 6 (5.2%). On day of admission, median MELD, MELD-Na, CLIF-C ACLF and ALFED scores were 33, 32, 45.6 and 2 respectively. King’s College Hospi-tal criteria was met in 32/115 (27.8%) on admission.
Univariate and multivariate analysis of
baseline factors associated with outcome
On univariate analysis there were significant differenc-es in INR, bilirubin, arterial ammonia, cerebral edema, re-quirement of ventilator support on admission, and grade of HE between survivors and non-survivors (Table 1). As compared to survivors, non-survivors had significantly
35 Were excluded:
22 Had hospital stay less than 2 days (Died). 11 Had anti-tuberculosis drugs as etiology. 2 Did not have complete etiological workup available.
115 Were included:
40 Cryptogenic (Non-A, Non-E), 33 HEV. 23 Acute HBV, 13 only chronic markers (HbsAg). 6 HAV.
Total number of ALF patients evaluated between July 2011 and March 2016 (N = 150).
Figure 1. Figure 1.Figure 1. Figure 1.
higher MELD (35.0 vs. 27.0; P < 0.001), MELD-Na (34.8
vs. 27.0; P < 0.001), CLIF-C ACLF (47.7 vs. 41.2; P < 0.001) and ALFED scores 2 (2-3) vs. 2 (1-2); P < 0.001 (Table 1). KCH criteria were more frequently present in non-survivors (38.4%) as compared to survivors (9.5%), P = 0.001. The median hospital stay was higher in survivors than non-survivors (6 days vs. 3 days; P < 0.001). There were no differences in age, sex, PEI, IEI, EAI, hemoglob-in, total leucocyte count, platelet count, serum creatinine, serum sodium, serum potassium, aspartate aminotrans-ferase, alanine aminotransaminotrans-ferase, albumin and arterial pH between the 2 groups.
On multivariate analysis, the factors associated with survival were INR (HR, 1.31, 95% CI, 1.13-1.52, P < 0.001) and arterial ammonia (HR, 1.01; 1.00-1.01, P = 0.046). Age, serum creatinine, bilirubin, grade of encepha-lopathy were not significant predictors of outcome (P > 0.05). Cerebral edema and requirement of ventilatory sup-port were not included in the multivariate analysis due to collinearity with HE.
Complications and Prognostic scores on Day 3
Overall, infection developed in 58 (50.4%), seizures in 22 (19.1%), gastrointestinal bleeding in 7 (6.1%) and ventilation at any time was required in 86 (74.8%) patients. The median values of the prognostic scores were higher among those died than those who survived, MELD (35 vs. 23), MELD-Na (35 vs. 24), ALFED (5 vs. 1), P < 0.001 for all. The KCH criteria was positive in 18 (24.7%) of those who died and 9 (21.4%) of those who survived, P = 0.82 (Table 2).
Diagnostic accuracy of prognostic scores at baseline and day 3 of admission
The diagnostic accuracy of tests was assessed both on day 1 and day 3. ROC curves were used to assess the diag-nostic accuracy of the various progdiag-nostic scores.
On the day of admission, the discrimination of out-come by all prognostic scores was modest-AUROC values
Table 1. Baseline characteristics of survivors and non-survivors (n=115)
Variable Non-survivors Survivors P
(n = 73) (n = 42) Value
Age (years) 26 (20-35) 23 (20 - 29.2) 0.10
Male: Female, n (%) 36 (49.3%): 37 (50.7%) 22 (52.4%): 20 (47.6%) 0.84
Prodrome to encephalopathy interval (days) 7 (4-12) 8 (6-15) 0.17
Icterus to encephalopathy interval (days) 4 (2-9) 4 (3-7) 0.54
Encephalopathy to admission interval (days) 2 (1-3) 2 (1-3) 0.72
Hemoglobin (g/dL) 11 (9.5-13.4) 11.8 (10.4-13.0) 0.63
Total leucocyte count (/mm3) 12,500 (9,200-17,950) 11,550 (8,175-17,075) 0.38
Platelet count (x103/mm3) 192 (125-271) 182 (108-251) 0.59
International Normalized Ratio 4.1 (2.8-5.1) 2.3 (1.7-3.3) < 0.001
Creatinine (mg/dL) 1 (0.7-1.4) 0.8 (0.6-1.0) 0.06
Sodium (mEq/L), mean ± sd 140 (136-145) 140 (137.0-144.0) 0.95
Potassium (mEq/L) 4 (3.4-4.4) 3.8 (3.3-4.4) 0.50
Total bilirubin (mg/dL) 18.5 (13.7-26.7) 13.6 (8.9-19.6) 0.004
Aspartate Aminotransferase (IU/L) 348 (159.0-1095) 429 (150-1257) 0.91
Alanine Aminotransferase (IU/L) 807 (40-1383) 824 (396-2028) 0.68
Albumin (g/dL) 3.1 (2.6-3.5) 2.8 (2.4-3.4) 0.17
Arterial pH 7.45 (7.40-7.50) 7.44 (7.41-7.50) 0.80
Arterial ammonia (μmol/L), mean ± sd 145.0 ± 43.6 122.9 ± 41.5 0.02
Ventilator support on day of admission, n(%) 52 (71.2%) 16 (38.1%) 0.001
Cerebral edema, n (%) 46 (63.0%) 15 (35.7%) 0.006
Hepatic Encephalopathy (Early: Advanced), n (%) 16 (21.9%): 57 (78.1%) 18 (42.9%): 24 (57.1%) 0.021
Pregnancy/total number of females, n (%) 8/37 (21.6%) 6/20 (30.0%) 0.53
MELD score on admission 35 (30-38) 27 (24-33) < 0.001
MELD-Na score on admission 34.8 (31-38) 27 (24-31) < 0.001
ALFED Score on admission 2 (2-3) 2 (1-2) < 0.001
CLIF-C-ACLF score on admission 47.7 (42.2-52.8) 41.2 (37.0-45.7) < 0.001
KCH Criteria on admission, n(%) 28 (38.4%) 4 (9.5%) 0.001
Figure 2. Figure 2.Figure 2.
Figure 2.Figure 2. Receiver operating characteristic curve (ROC) of various ALF prognostic scores and mortality. A.A.A.A.A. The area under ROC curve on day of admission of MELD, MELD-Na, ALFED, CLIF-C ACLF and King's College Hospital criteria were 0.77, 0.77, 0.68, 0.73, and 0.65 respectively. B.B.B.B.B. The area under ROC curve on Day 3 of admission of MELD, MELD-Na, ALFED, CLIF-C ACLF, and King's College Hospital criteria were 0.81, 0.77, 0.95, 0.88, and 0.52 respec-tively.
A AA AA
100
80
60
40
20
0
Sensitivity
0 20 40 60 80 100
100-Specificity
Admission MELD Admission MELD-Na Admission ALFED Admission CLIF-ACLF Admission King’s College Hospital Criteria
B BB B B
100
80
60
40
20
0
Sensitivity
0 20 40 60 80 100
100-Specificity Day 3 MELD Day 3 MELD-Na Day 3 ALFED Day 3 CLIF-C
Day 3 King’s College Hospital Criteria
Table 3. Sensitivity, Specificity, Positive Predictive Value, Negative Predictive Value, Likelihood Ratio and Diagnostic Accuracy of vari-ous prognostic scores for predicting mortality on day of admission.
Parameter AUROC Sensitivity (%) Specificity (%) PPV (%) NPV (%) LR+ LR- DA
(Cut-off) (95% CI) (95% CI) (95% CI) (95% CI) (95% CI) (%)
MELD (≥ 30) 0.77 (0.69-0.84) 76.5 (67.0-84.3) 66.7 (51.0-80.0) 83.9 (77.2-88.8) 55.6 (45.4-65.2) 2.3 0.35 73.5 MELD-Na (≥ 30) 0.77 (0.69-0.84) 78.4 (69.2-85.9) 69.8 (53.8-82.8) 86.0 (79.4-90.7) 57.7 (47.3-67.5) 2.6 0.31 75.9 ALFED (≥ 3) 0.70 (0.62-0.77) 42.6 (32.8-52.8) 83.7 (69.3-93.2) 86.0 (75.0-92.6) 38.3 (33.4-43.4) 2.6 0.69 54.8 CLIF-C ACLF (≥ 46) 0.79 (0.72-0.86) 74.0 (64.5-82.1) 65.2 (49.7-78.6) 82.8 (76.1-87.9) 52.6 (43.0-62.1) 2.1 0.40 71.3 King's College 0.66 (0.58-0.74) 40.4 (30.9-50.5) 91.3 (79.2-97.6) 91.3 (80.0-96.5) 40.4 (36.1-44.8) 1.2 0.99 56.0 Hospital criteria
positive (KCH)
MELD: model for end stage liver disease. Na: sodium. ALFED: acute liver failure early dynamic. CLIF-C ACLF: chronic liver failure consortium acute on chronic liver failure. KCH: King's College Hospital.
Table 2. Complications during hospital stay and prognostic scores on Day 3 in non-survivor and survivor ALF patients.
Variable Non-survivors Survivors P
(n = 73) (n = 42) Value
Gastrointestinal Bleed, n (%) 5 (6.8%) 2 (4.8%) 0.66
Infection, n (%) 40 (54.8%) 17 (40.5%) 0.17
Ventilator support any time, n (%) 69 (94.5%) 17 (40.5%) < 0.001
Hospital Stay, days 3 (3-6) 6 (5-11) < 0.001
MELD score on day 3 35 (31-39) 23 (19-28) < 0.001
MELD-Na score on day 3 35 (30-39) 24 (2029) < 0.001
ALFED score on day 3 5 (4-5) 1 (0-2) < 0.001
CLIF-C ACLF score on day 3 49.7 (45.8-53.0) 35.2 (28.9-39.4) < 0.001
KCH Criteria on day 3, n (%) 18 (24.7%) 9 (21.4%) 0.82
for MELD, MELD-Na, ALFED, CLIF-C ACLF and King's College Hospital criteria were 0.77, 0.77, 0.68, 0.73 and 0.65 (Table 3, Figure 2A). MELD-Na > 30 had the best sensitivity (80.8%), whereas KCH criteria had the best specificity (90.5%). The details of the PPV, NPV and LR +ve are shown in Table 3. The sensitivity of CLIF-C ACLF score was 67.1%. On comparison of AUROC be-tween different scores, MELD score was not significantly different from MELD-Na, CLIF-C ACLF and ALFED score (P > 0.05 for all, DeLong method). MELD and MELD-Na had higher AUROC than KCH criteria (P < 0.05).
On day 3 of admission, the ALFED score had the best discriminative accuracy (AUROC: 0.95), followed by CLIF-C ACLF score (AUROC: 0.88). The AUROC val-ues for MELD, MELD-Na and KCH were 0.81, 0.77 and 0.52 respectively (Table 4, Figure 2B). ALFED score ≥ 4 had the best sensitivity, specificity, PPV, NPV, LR +ve and diagnostic accuracy. On comparison of AUROC be-tween different scores, ALFED was significantly better than all other prognostic scores- MELD, MELD-Na and KCH (P < 0.001 for all, DeLong method) and CLIF-C ACLF (P = 0.05, DeLong method). AUROC values of MELD and MELD-Na were significantly higher than KCH criteria (P < 0.001). The AUROC of CLIF-C ACLF was significantly higher than MELD-Na and KCH (P < 0.05). There was no difference between CLIF-C ACLF and MELD scores (P = 0.12).
DISCUSSION
In this study, we compared 5 prognostic scores for pre-diction of mortality in ALF. We found that dynamic scor-ing is better for predictscor-ing outcome than the assessment of parameters at baseline alone, for all prognostic scores (Ta-bles 3 and 4; Figure 2A). Among viral hepatitis-related ALF, ALFED score fares better than MELD, MELD-Na,
KCH and CLIF-C ACLF score on day 3 of admission (Table 4, Figure 2B).
The most difficult question in management of ALF is when to list the patient for LT. It is vital for this to be done at the ideal time, as delay will result in the patient being non-transplantable, and too early listing will lead to unnecessary LT. This is important as LT involves huge costs, expertise, infrastructure and long-term immunosup-pression. Also, scarcity of liver donors is a major limiting factor. An ideal prognostic score is one which is simple to use at the bedside, reliable, reproducible, rapidly meas-ured, includes objective parameters, and identifies patients before multi-organ dysfunction occurs. The sensitivity, specificity, positive predictive values and negative predic-tive values should be high.
There are differences in the etiologies of ALF across the world.21,22 Our study cohort included patients with
vi-ral hepatitis-related ALF. We included non-A, non-E ALF in the overall cohort of viral-hepatitis ALF, as we have previously shown that these patients have clinical presen-tation, and course (including outcomes) similar to other forms of viral hepatitis-related ALF.7 The KCH criteria
derivation and validation included ALF patients with pre-dominant etiology as paracetamol (60%). Viral etiology ac-counted for 40% of all etiologies in derivation, and 26% in the validation cohort. Of minor KCH criteria (namely, age < 10 or > 40 years, etiology-indeterminate or drug in-duced, IEI > 7 days, INR > 3.5 and bilirubin > 17.5 mg/ dL), 3 out of 5 should be present to identify those with higher chance of death. When minor criteria are analyzed in the Indian population, most Indian patients are less than 40 years of age;7 few patients fall in the age groups < 10
and > 40 years. Among etiologies, indeterminate- non-A, non-B (not clearly specified) and halothane are rare causes of ALF in India. The median IEI was short (median 4 days) in most of our patients. Previous reports in hepatitis virus related ALF indicate no difference in mortality
be-Table 4. Sensitivity, Specificity, Positive Predictive Value, Negative Predictive Value, Likelihood Ratio and Diagnostic Accuracy of vari-ous prognostic scores for predicting mortality on day 3 of admission.
Parameter AUROC Sensitivity (%) Specificity (%) PPV (%) NPV (%) LR+ LR- DA
(Cut-off) (95% CI) (95% CI) (95% CI) (95% CI) (95% CI) (%)
MELD (≥ 30) 0.81 (0.72 - 0.88) 78.8 (67.5 - 87.7) 84.6 (69.5 - 94.1) 90.3 (80.1 - 96.3) 68.7 (53.7 - 81.3) 5.1 0.25 80.9 MELD-Na (≥ 30) 0.77 (0.67 - 0.85) 74.6 (62.9 - 84.2) 81.1 (64.8 - 92.0) 88.3 (77.4 - 95.2) 62.5 (47.3 - 76.0) 3.9 0.31 76.8 ALFED (≥ 4) 0.95 (0.88 - 0.98) 87.1 (77.0 - 93.9) 89.5 (75.2 - 97.1) 93.8 (85.0 - 98.3) 79.1 (63.9 - 89.9) 8.3 0.14 87.9 CLIF-C ACLF (≥ 46) 0.88 (0.80 - 0.94) 83.6 (72.5 - 91.5) 87.2 (72.6 - 95.7) 91.8 (81.9 - 97.3) 75.6 (60.5 - 87.1) 6.5 0.19 84.9 King's College 0.52 (0.42 - 0.62) 24.6 (15.3 - 36.1) 78.6 (63.2 - 89.7) 66.7 (46.0 - 83.4) 37.5 (27.4 - 48.5) 1.2 0.99 44.3 Hospital criteria
positive (KCH)
tween those who present with duration less than 7 days as compared to those with more than 7 days’ duration.7 Also,
being a static model, KCH has its own limitations as com-pared to dynamic models. These differences make it im-practical for KCH to be a good prognostic test in viral hepatitis-related ALF.
A recent meta-analysis assessed KCH criteria for out-come in non-paracetamol induced ALF. A total of 18 stud-ies, 1105 patients were included. KCH criteria had low sensitivity (68%) and high specificity (82%). Moreover, specificity was higher in the subgroup with high grade (> 2) HE, and when it was used dynamically with time course.16 Our results were similar to this meta-analysis.
This highlights the fact that the use of dynamic criteria predicts outcome better than static criteria on day of ad-mission. The dynamic models have been shown to be bet-ter in other severe liver diseases like alcoholic hepatitis.23
Furthermore, a recent study reported dynamic models to be better than static models for prediction of outcome in paracetamol induced ALF.18 We found that the AUROC of
all scores, except KCH criteria, increased over the 3 days (Table 3 and 4). These facts reiterate that prognostic scores should be calculated daily in the routine manage-ment of ALF, and any increase should be a sign of im-pending complications. Further studies at centers routinely performing LT are needed to validate the impact of dynamic score assessment on transplant related deci-sions. At most transplant centers, the decision to transplant is based on clinical judgement; dynamic score assessment would be a more objective method for the same.12,18
The other score- CLIF-C ACLF takes into account age, total leucocyte count and CLIF-OF scores. The CLIF-OF scores are derived from modified sequential organ failure assessment (SOFA) score- the modifications being replace-ment of Glasgow Coma Scale with different grades of HE, and inclusion of INR in scoring the coagulation OF.24 The
CLIF-C ACLF score has been shown to correlate with out-come in ACLF.24,25 There is no data on the use of CLIF-C
ACLF score in ALF. This score would be expected to per-form better than other scores as it takes into account multi-ple organ systems. Therefore, we assessed and compared CLIF-C ACLF and other prognostic scores. Most of our patients were young, with median age being 26 years. There were no differences in total leucocyte counts between the survivors and non-survivors. The CLIF-OF score (modifi-cation of the SOFA score) is a composite score and takes into account 6 major organ systems (liver, kidney, brain, co-agulation, circulatory and respiratory). In our cohort, renal failure (creatinine ≥ 2 mg/dL) was seen in 13 (11.3%) of pa-tients, most ALF patients had maintained PaO2/FiO2, and the need for ventilation was secondary to cerebral edema or advanced HE. Also, the mean arterial pressure was main-tained in most cases- only 8 (6.9%) cases had mean arterial
pressure below 70 mm Hg at admission. Due to these rea-sons, overall, CLIF-C ACLF did not perform better than ALFED, which has been specifically generated for patients with viral hepatitis-related ALF (Table 4). ALFED model incorporates changes in arterial ammonia, HE, serum bi-lirubin and INR over 3 days for predicting outcome. In pa-tients with ALF, arterial ammonia and INR change rapidly (probably associated with liver regeneration), which makes this model better than other models. None of the other models incorporates ammonia, which has been shown to correlate with outcome.
Limitations of the study include a small sample size from a single tertiary care center. These results need to be validated in a separate cohort of patients with non-viral etiologies. Another limitation is that we excluded the pa-tients who died within 2 days of hospital admission, as we could not assess the dynamicity of the prognostic models in these patients. This may have affected our results. The median duration of interval between onset of encephalop-athy and admission was 2 days. The referral time lag might have affected the performance of the prognostic scores. We used an objective definition of infection, which included clinical and laboratory parameters; despite this we might have missed out a few patients with infection. Another limitation is that we did not calculate the sample size prior to the start of the study. Based on the observed sensitivity and specificity of various prognostic scores (Table 4) with desired precision of 2% and the observed mortality of 63.5%, the maximum sample size is 122. Though we could not reach the ideal sample size, a total of 115 patients (73 died and 42 alive) were included, which seems sufficient to assess the prognostic impression through various scor-ing systems.
CONCLUSIONS
Dynamic assessment of prognostic scores is better than assessment at baseline alone. ALFED score performs bet-ter than the KCH cribet-teria, MELD, MELD-Na and CLIF-C ACLIF-CLF scores in viral hepatitis-related ALF.
ABBREVIATIONS
• ALF: acute liver failure.
• AUROC: area under ROC.
• CLIF-C ACLF: chronic liver failure consortium acute on chronic liver failure.
• EAI: encephalopathy to admission interval. • HE: hepatic encephalopathy.
• MELD: model for end stage liver disease. • OF: organ failure.
• PEI: prodrome to encephalopathy interval. • ROC: receiver operator characteristic. • SOFA: sequential organ failure assessment.
GRANTS AND FINANCIAL SUPPORT
None.
DISCLOSURES
None.
TRANSCRIPT PROFILING
NA.
FUNDING SOURCE
None.
CONFLICTS OF INTEREST
None.
All authors approved the final version of the manu-script
ACKNOWLEDGEMENT
Mr. Amar Negi for data handling.
CONTRIBUTIONS
Shalimar: acquisition of data; analysis and interpretation of data; drafting of manuscript; criticial revision of script. Ujjwal Sonika: acquisition of data; drafting of manu-script. Saurabh Kedia: acquisition of data; drafting of manuscript. Soumya Jagannath Mahapatra: acquisition of data; drafting of manuscript. Baibaswata Nayak: acquisition of data; analysis of blood samples; drafting of manuscript. Dawesh Prakash Yadav: acquisition of data. Deepak Gunjan: interpretation of data; drafting of manuscript. Bhaskar Thakur: statistical analysis; interpretation of the data. Har-preet Kaur: acquisition of data. Subrat Kumar Acharya: study concept and design; interpretation of data; critical re-vision of manuscript for important intellectual content.
REFERENCES
1. Acharya SK, Panda SK, Saxena A, Gupta SD. Acute hepatic failure in India: a perspective from the East. J Gastroenterol Hepatol 2000; 15: 473-9. [PMID:10847431]
2, Shalimar, Acharya SK. Management in acute liver failure. J Clin Exp Hepatol 2015; 5: S104-115. [PMID: 26041950] 3. Polson J, Lee WM. AASLD position paper: The management
of acute liver failure. Hepatology 2005; 41: 1179-97. [PMID: 15841455]
4. Fontana RJ, Ellerbe C, Durkalski VE, Rangnekar A, Reddy RK, Stravitz T, McGuire B, et al. Two-year outcomes in initial survivors with acute liver failure: results from a prospective, multicentre study. Liver International 2015; 35: 370-80. [PMID: 25039930]
5. Bhatia V, Singhal A, Panda SK, Acharya SK. A 20-year sin-gle-center experience with acute liver failure during preg-nancy: is the prognosis really worse? Hepatology 2008; 48: 1577-85. [PMID:18925633]
6. Kumar R, Shalimar, Bhatia V, Khanal S, Sreenivas V, Gupta SD, Panda SK, et al. Antituberculosis therapy-induced acute liver failure: magnitude, profile, prognosis, and predictors of outcome. Hepatology 2010; 51: 1665-74. [PMID: 20196116] 7. Acharya SK, Dasarathy S, Kumer TL, Sushma S, Prasanna
KS, Tandon A, Sreenivas V, et al. Fulminant hepatitis in a tropical population: clinical course, cause, and early predic-tors of outcome. Hepatology 1996; 23: 1448-55. [PMID: 8675163]
8. Kumar R, Shalimar, Sharma H, Praksh S, Panda SK, Khanal S, Acharya SK, et al. Persistent Hyperammonemia Is Associ-ated with Complications and Poor Outcomes in Patients with Acute Liver Failure. Clin Gastroenterol Hepatology 2012; 10: 925-31 [PMID:22521861]
9. Jepsen P, Schmidt LE, Larsen FS, Vilstrup H. Long-term prognosis for transplant-free survivors of paracetamol-in-duced acute liver failure. Aliment Pharmacol Ther 2010; 32: 894-900. [PMID: 20735774]
10. O'Grady JG, Alexander GJ, Hayllar KM, Williams R. Early in-dicators of prognosis in fulminant hepatic failure. Gastroen-terology 1989; 97: 439-45. [PMID: 2490426]
11. Malinchoc M, Kamath PS, Gordon FD, Peine CJ, Rank J, ter Borg PC. A model to predict poor survival in patients under-going transjugular intrahepatic portosystemic shunts. Hepa-tology 2000; 31: 864-71. [PMID: 10733541]
12. Kumar R, Shalimar, Sharma H, Goyal R, Kumar A, Khanal S, Prakash S, et al. Prospective derivation and validation of ear-ly dynamic model for predicting outcome in patients with acute liver failure. Gut 2012; 61:1068-75. [PMID: 22337947] 13. Kim WR, Biggins SW, Kremers WK, Wiesner RH, Kamath PS,
Benson JT, Edwards E, et al. Hyponatremia and mortality among patients on the liver-transplant waiting list. N Engl J Med 2008; 359: 1018-26. [PMID:18768945]
14. Cholongitas E, Theocharidou E, Vasianopoulou P, Betrosian A, Shaw S, Patch D, O'Beirne J, et al. Comparison of the se-quential organ failure assessment score with the King's Col-lege Hospital criteria and the model for end-stage liver disease score for the prognosis of acetaminophen-induced acute liver failure. Liver Transplant 2012; 18: 405-12.[PMID 22213443]
15. Jalan R, Saliba F, Pavesi M, Amoros A, Moreau R, Ginès P, Levesque E, et al. Development and validation of a prognos-tic score to predict mortality in patients with acute-on-chron-ic liver failure. J Hepatol 2014; 61: 1038-47. [PMID:24950482]
16. McPhail MJW, Wendon JA, Bernal W. Meta-analysis of per-formance of Kings's College Hospital Criteria in prediction of outcome in non-paracetamol-induced acute liver failure. J Hepatol 2010; 53: 492-9. [PMID:20580460]
liver failure. BMC Gastroenterol 2013; 13: 58. [PMID:23551795]
18. Bernal W, Wang Y, Maggs J, Willars C, Sizer E, Auzinger G, Murphy N, et al. Development and validation of a dynamic outcome prediction model for paracetamol-induced acute liv-er failure: a cohort study. Lancet Gastroentliv-erol Hepatol 2016; 1: 217-25. [PMID:28404094]
19. Tandon BN, Bernauau J, O'Grady J, Gupta SD, Krisch RE, Liaw YF, Okuda K, et al. Recommendations of the Interna-tional Association for the Study of the Liver Subcommittee on nomenclature of acute and subacute liver failure. J Gas-troenterol Hepatol 1999; 14: 403-4. [PMID:10355501] 20. Riegler JL, Lake JR. Fulminant hepatic failure. Med Clin North
Am 1993; 77: 1057-83. [PMID:8371615]
21. Shalimar, Subrat K Acharya, William M Lee. Worldwide dif-ferences in acute liver failure. In: Critical Care in Acute Liver Failure [Internet]. Future Medicine Ltd; 2013 [cited 2016 May 14]. p. 32-46. Available from: http://www.futuremedicine. com/doi/abs/10.2217/ebo.12.326
22. Shalimar, Kedia S, Gunjan D, Sonika U, Mahapatra SJ, Nayak B, Kaur H, et al. Acute Liver Failure Due to Hepatitis E Virus Infection Is Associated with Better Survival than Other Etiol-ogies in Indian Patients. Dig Dis Sci 2017; 62: 1058-66. [PMID: 28130708]
23. Louvet A, Labreuche J, Artru F, Boursier J, Kim DJ, O'Grady J, Trépo E, et al. Combining Data From Liver Disease Scoring Systems Better Predicts Outcomes of Patients With Alcohol-ic Hepatitis. Gastroenterology 2015; 149: 398-406. [PMID:25935634]
24. Moreau R, Jalan R, Gines P, Pavesi M, Angeli P, Cordoba J, Durand F, et al. Acute-on-chronic liver failure is a distinct syndrome that develops in patients with acute decompensa-tion of cirrhosis. Gastroenterology 2013; 144:1426-37, 1437-9. [PMID:23474284]
25. Shalimar, Kumar D, Vadiraja PK, Nayak B, Thakur B, Das P, Datta Gupta S, et al. Acute on chronic liver failure because of acute hepatic insults: Etiologies, course, extrahepatic or-gan failure and predictors of mortality. J Gastroenterol Hepatol 2016; 31: 856-64. [PMID:26519215]
Correspondence and reprint request:
Shalimar, DM.
Mailing address: Room 127, 1st Floor, Old OT Block, Human Nutrition Unit, All India Institute of Medical Sciences, New Delhi
-110029, India
Annex 1.
ETIOLOGICAL WORK-UP
Viral nucleic acid and serological tests
For diagnosis of hepatitis A virus (HAV) infection, we used serological testing for anti-HAV IgM by automated assay (VIDAS antiHAV IgM, Biomureix USA). For diagnosis of hepatitis E virus (HEV), both qualitative nested RT-PCR (reverse transcriptase PCR) for HEV RNA and serological determination of anti-HEV IgM using commercial ELISA kit was carried out; and the patients positive for any one or both of these tests were considered HEV positive. For hepatitis B virus (HBV) infection, patients were serologically tested for HBsAg, HbeAg, total anti-HBc and anti-HBe by commercial ELISA and automated VIDAS assay. Nucleic acid testing for HBV DNA was performed by real time PCR.
ATT-ALF was diagnosed if the patient with ALF had a history of consumption of at least two of the three first-line hepatotoxic drugs (isoniazid, rifampicin, and pyrazinamide) for a minimum period of 1 week and if the patient's sera tested negative for evi-dence of known hepatitis virus(es)- HAV, HBV, hepatitis C virus [HCV], and HEV, and absence of any other identifiable cause of acute liver injury.
The ALF patients who tested negative for HAV, HBV, HCV and HEV and denied consumption of any known hepatotoxic drugs were designated as cryptogenic (non-A non-E) ALF.
PROGNOSTIC SCORING SYSTEMS IN ALF
King's College Hospital Criteria10
The variables used in assessing the King's College Hospital vary according to the etiology of the ALF. The criteria for acetaminophen-induced ALF:
• An arterial pH of less than 7.30, irrespective of grade of encephalopathy or
• Grade III or IV encephalopathy with both a prothrombin time (PT) greater than 100 seconds and a serum creatinine concentration greater than 3.4 mg/Dl (301 micromol/L).
For other causes of acute liver failure, KCH criteria include:
• A PT greater than 100 seconds, irrespective of the grade of encephalopathy or • Any three of the following:
a) Age less than 10 or greater than 40 years
b) Unfavorable disease etiology, such as non-A, non-B viral hepatitis, idiosyncratic drug reactions, Wilson disease c ) Duration of jaundice before development of encephalopathy greater than seven days
d) PT greater than 50 seconds
e) Serum bilirubin greater than 18 mg/dL (308 micromol/L)
Model for end-stage liver disease (MELD) score11
MELD score is calculated as follows- 3.8*loge (serum bilirubin [mg/dL]) + 11.2*loge(INR) + 9.6*loge(serum creatinine [mg/dL]) + 6.4
Chronic liver failure (CLIF)-Consortium ACLF score (CLIF-C ACLF) score
CLIF-C ACLF score is calculated as follows- 10 x (0.33 x CLIF-C OF + 0.04 x age + 0.63 x Ln [leukocyte count] -2)
Acute Liver Failure Early Dynamic (ALFED) model12
The ALFED model is based on whether the levels of predictive variables remain persistently high or increase over 3 days above the discriminatory cut-off values.12 The model has four variables: arterial ammonia ≥ 123 mmols/l, serum bilirubin ≥ 15
mg/dL, international normalized ratio ≥ 5 and hepatic encephalopathy > Grade II. These values if present on day 3 of presenta-tion are independent predictors of mortality.
ALFED variables at admission Score
Advanced Hepatic Encephalopathy (Grade >2) 1
INR ≥ 5 1
Arterial ammonia ≥ 123 mmol/L 1
Serum bilirubin ≥ 15 mg/dL 1
Dynamicity of ALFED variables over 3 days Score
Variables over 3 days
Hepatic Encephalopathy persistent or progressed to Grade >2 2
INR persistent or increased to≥ 5 1
Arterial ammonia persistent or increased to ≥ 123 mmol/L 1