A Dynamic Model for Predicting
Outcome in Patients with
HBV Related Acute-On-Chronic Liver Failure
Wei Lin,*,|||| Jing Zhang,*,|||| Xiaohui Liu,*,|||| Hongqun Liu,† Jinqiu He,‡ Ming Li,§ Shuqin Zhang,|| Yuexin Zhang, Hong Chen,** Changqing Zhang,†† Wenfang Wu,‡‡ Chenggang Jin,§§ Samuel S. Lee,† Zhongping Duan*,||||
* Beijing Youan Hospital, Capital Medical University, China.
† Liver Unit, University of Calgary, Canada. ‡ Infectious Diseases Hospital Affliated to Nanchang Univeristy, China. § The Second People's Hospital of Fuyang, China. || Hepatobilary Hospital of Jilin Province, China.
The First Affiliated Hospital of Xinjiang Medical University, China. ** The First Hospital of Lanzhou University, China.
†† The Sixth People's Hospital of Kaifeng, China. ‡‡ The School of Biomedical Engineering, Capital Medical University, China. §§ School of Social Development Public Policy, Beijing Normal University, China. |||| Collaborative Innovation Center of Infectious diseases.
INTRODUCTION
Acute on chronic liver failure (ACLF) is an acute de-compensation of chronic liver disease, which is character-ized by high mortality.1 Liver transplantation is the most
effective lifesaving treatment.2 It is very important to
pre-dict the prognosis in order to select proper transplantation candidate.
There are currently four kinds of models to evaluate the severity and prognosis of patients with severe liver dis-ease:3
The Official Journal of the Mexican Association of Hepatology, the Latin-American Association for Study of the Liver and
the Canadian Association for the Study of the Liver
Manuscript received: Manuscript received: Manuscript received: Manuscript received:
Manuscript received: March 29, 2017. Manuscript accepted:Manuscript accepted:Manuscript accepted:Manuscript accepted:Manuscript accepted: July 08, 2017. DOI:10.5604/01.3001.0011.7383
A B S T R A C T A B S T R A C T A B S T R A C T A B S T R A C T A B S T R A C T
Introduction and aim. Introduction and aim.Introduction and aim. Introduction and aim.
Introduction and aim. Accurately predicting the prognosis of individual patient is crucial in the management of ACLF. We aimed to establish a specific prognostic model for HBV-related ACLF patients treated with nucleoside analog (NA). Material and meth-Material and meth-Material and meth-Material and meth-Material and meth-ods.
ods. ods. ods.
ods. We prospectively collected 205 ACLF cases diagnosed according to the APASL criteria. A dynamic prognostic model based on APASL criteria was established and validated. To demonstrate that the model is also applicable to those within EASL criteria, we divided the patients into two groups: met APASL criteria only (group A, n = 123); met both APASL and EASL criteria (group B, n = 82). Its prognostic accuracy was also compared with chronic liver failure-sequential organ failure assessment (CLIF-SOFA) score in group B. Results.Results.Results.Results.Results. The model is: R = 0.94 x Bilirubin + 0.53 x evolution of Bilirubin - 0.45 x PT-A - 0.22 x evolution in PT-A -0.1 x PLT + 10 x anti-HBe. The area under receiver operating characteristic curve (AUC) of the model for predicting 90-day mortality was 0.86, which was significantly higher than that of model for end stage liver disease(MELD), MELD-Na, CLIF-SOFA, ΔMELD (7d) and ΔMELD-Na (7d), ΔCLIF- SOFA(7d) (all p < 0.01). The AUC of our model in the validation group was 0.79 which was superior to MELD (0.45) CLIF-SOFA (0.53) score in group B patients (p < 0.01). Conclusion.Conclusion.Conclusion.Conclusion.Conclusion. In conclusion, the model was superior to the conventional methods in predicting the outcomes of patients with HBV related ACLF treated with NA. It is the first description of a novel prognostic model using consecutive data in patients with HBV-induced acute-on-chronic liver failure (ACLF) treated by nucleoside analogs.
Key word. Key word.Key word. Key word.
1. Liver-specific models such as Child-Turcotte -Pugh Score (CTP), Model for End-Stage Liver Disease (MELD) and Kings’ college hospital (KCH) criteria. 2. General scoring systems such as simplified acute
phys-iology score (SAPS II) and acute physphys-iology and chronic health evaluation II (APACHE II)) and 3. Organ failure models such as organ system failure
score (OSF), sequential organ failure assessment score (SOFA). Recently, a chronic liver failure-sequential organ failure assessment (CLIF-SOFA) model was de-veloped by EASL to evaluate the prognosis of ACLF. 4. Some scores were specially developed for the
differ-ent causes of severe liver dysfunction, such as the Mad-drey score for severe alcoholic hepatitis.
Hepatitis B causes about 80% of ACLF in China.4 Many
scores were developed for this specific type of ACLF. But none of them have been universally accepted. Majority of the previous studies did not account for the therapeutic ef-fect of nucleoside analog (NA).5-7 In addition, the
prog-nostic model based on a single time point may not suitable for ACLF which progresses rapidly. Based on the reasons above, the present study aimed to evaluate the prognostic factors of HBV-related ACLF patients treated with NA. We focused on the therapeutic response and the patient’s prognosis.
MATERIALS AND METHODS
Study population
The protocol was approved by the Beijing Youan Hos-pital ethics committee and conformed to the guidelines of the Helsinki Declaration. All patients provided written in-formed consent. If the patient had encephalopathy or was unable to provide consent, it was obtained from the next-of-kin. We prospectively enrolled 205 HBsAg positive pa-tients with ACLF from 2009 to 2011 in 7 hospitals as model group. The hospitals were Beijing Youan Hospital, Capital Medical University, The Ninth Hospital of Nanchang,The Second People’s Hospital of Fuyang, Hepatobilary Hospital of Jilin Province, The First Teach-ing Hospital of Xinjiang Medical University,The First Af-filiated Hospital of Lanzhou University, The Sixth People’s Hospital of Kaifeng. All patients conformed to the guidelines of Helsinki Declaration and provided a written informed consent. A total of 165 patients hospital-ized as ACLF from 2011 to 2015 in 3 hospitals (Beijing Youan Hospital, Capital Medical University, The Ninth Hospital of Nanchang and the Second People’s Hospital of Fuyang) were used as a validation group.
The inclusion criteria were: met the APASL ACLF cri-teria; HBsAg positive; treated by entecavir or lamivudine;
age older than 18 years. Exclusion criteria: patients with a past history of decompensated cirrhosis; other hepatitis viral infection such as HCV, other insulting factors such as alcoholism and surgery. Patients with malignancy, preg-nancy and HIV-AIDS were also excluded.
Treatment and follow up
The medical treatments included: nutritional support (25-30kcal/kg/d, enteral or parenteral), treatment of com-plications such as ascites, hepatic encephalopathy, infec-tion and hepatorenal syndrome. One of the HRS patients underwent hemodialysis. Antiviral therapy included ente-cavir (Baraclude®, Bristol-Myers Squibb, Shanghai,
China) 0.5-1 mg/d and lamivudine (Heptodin®,
Glaxo-SmithKline, Suzhou, China) 100 mg/d. Two patients had liver transplantation. Ascites was defined as follows:
• Grade 1. Mild, only visible on ultrasound and CT. • Grade 2. Detectable with flank bulging and shifting
dullness.
• Grade 3. Directly visible, confirmed with the fluid wave/thrill test.8
Diagnostic criteria of spontaneous bacterial peritonitis included:9 ascites fluid neutrophil count > 250/mL or
positive ascitic fluid bacterial culture; ascites fluid neu-trophil count < 250/mL but clinical suspicion of infec-tion, such as fever, abdominal rigidity and increased serum WBC and/or neutrophils Hepatic encephalopathy was classified according to the West Haven Criteria.10
Data collection included demographics, basic diseases, precipitating factors, complications, viral tests, liver func-tion, abdominal ultrasound, chest X-ray or computed tom-ography.
After enrolment, the patients were followed up once a week for the first month, then once every other week for 90 days.
Statistical analysis
prognostic factors. The area under Receiver Operating Characteristic (ROC) curve was expressed as point (95% confidence interval).
We used a dynamic logistic regression model to capture the baseline predictors at admission and their changes at day 7 after admission. The area under the ROC curve (AUC) of the prognostic model was expressed as point (95% confidence interval). The model was specified as for-mula 1.
Y = 1 if the patient die within 90 days, y = 0 otherwise. Model comparison and selection was based on Delong test for statistical significance between AUC of different competing models.
Y = β0 + (β1χβ1 +β2 Δχ1) + (β3χ2 + β4Δχ2)... (βκχρ + (β(κ+ 1)Δχρ).
Formula 1. Formula 1. Formula 1. Formula 1.
Formula 1. The area under the ROC curve (AUC) of the prognostic model was expressed as point (95% confidence interval). The model was specified as: Y
Table 1. Demographic, clinical and biochemical features at enrollment of derivation and validation cohorts.
Derivation cohort Validation cohort P value
n = 205 n = 165
Age (y) 41.2 ± 10.9 43.2 ± 11.7 p = 0.142
Male sex, n (%) 171 (83.4) 143 (86.7) p = 0.466
Entecavir, n (%) 90 (43.9) 86(52.1) p = 0.116
Lamivudine, n (%) 115 (56.1) 79 (47.9)
Liver cirrhosis, n (%) 48(23.4) 40(24.2) p = 0.471
HE, n (%) 26 (12.7) 77 (46.7) p < 0.001
I/II/III/IV 17/8/1/0 46/16/4/11
Ascites, n (%) 122 (59.5) 126 (76.4) p < 0.001
Mild 70 (34.1) 87 (52.7)
Moderate 38 (18.5) 21 (12.7)
Severe 14 (6.8) 18 (10.9)
Laboratory data
HBeAg positive, n (%) 96 (46.8) 100 (60.6) p = 0.009 Anti-HBe positive, n (%) 96 (46.8) 106 (64.2) p = 0.001 HBV DNA (IU/mL) 5 x 10⁵ (0, 7.9 x 10⁸) 2 x 10⁵ (0, 1 x 10⁹) p = 0.105
WBC (x109/L) 7.7 (2.9,25.9) 6.1 (1.2,24.2) p = 0.212
Platelet (x109/L) 107 .5 (5.2,290.3) 97 (20,423) p = 0.482
INR 2.5 (1.5,4.9) 2.3 (1.4,5.1) p = 0.769
PT-A (%) 30.1 (11.8,40) 30 (12,54) p = 0.846
ALT (IU/L) 601.9 (8.5,2977) 326.3 (15.9,3873) p = 0.961 Bilirubin (mg/dL) 21.6 (9.9,50.2) 18.5 (10.1,49.3) p = 0.083
Albumin (g/L) 30.3±5 32.5±4.4 p = 0.517
Glucose (mmol/L) 5.04 (1.9,18.1) 4.5 (1.8,14) p = 0.434 Serum creatinine (mg/dL) 0.8 (0.3,3.6) 0.7 (0.1,3.2) p = 0.008 Serum Urea (mmol/L) 5.1 (1.9,62) 4.1 (1.3,34.5) p = 0.636 Na (mmol/L) 134.6 (106.8,142.5) 136 (118,153.2) p = 0.209
MELD score 24.7 (10.8,44.6) 23 (10,48) p = 0.036
MELD-Na score 27.5 (10.8,57.7) 23.7 (10,63) p = 0.007
CLIFSOFA 7(4,10) 8(5,14) p < 0.001
Mortality rate at day 28 34(16.6%) 50(30.3%) p = 0.003 Mortality rate at day 90 49 (23.9%) 61(37.0%) p = 0.008
HE: hepatic encephalopathy. WBC: white blood cell. INR: international normalized ratio. PT-A: prothrombin activity. ALT: alanine aminotransferase. MELD: model of end-stage liver disease. CLIFSOFA: chronic liver failure-sequential organ failure assessment. All the parametric data were expressed as mean ± SD and nonparametric data were expressed as median (maximum, minimum).
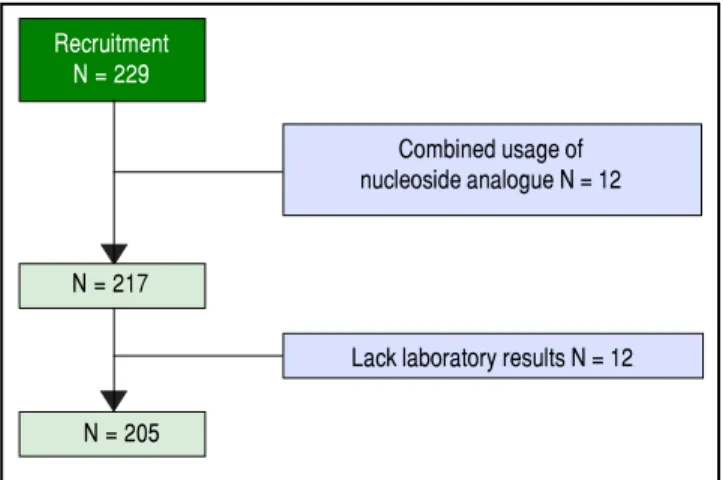
Recruitment N = 229
Combined usage of nucleoside analogue N = 12
N = 217
N = 205
Lack laboratory results N = 12
Figure 1. Figure 1. Figure 1. Figure 1.
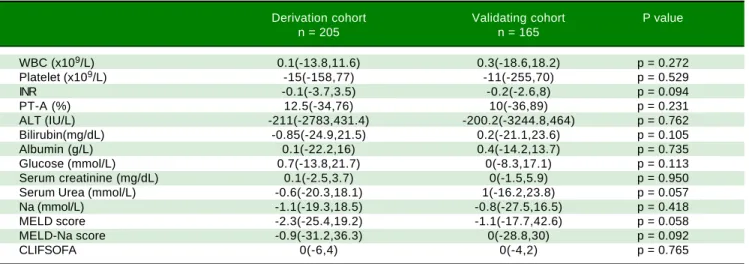
Table 2. Change of variables at day 7 of derivation and validation cohort.
Derivation cohort Validating cohort P value
n = 205 n = 165
WBC (x109/L) 0.1(-13.8,11.6) 0.3(-18.6,18.2) p = 0.272
Platelet (x109/L) -15(-158,77) -11(-255,70) p = 0.529
INR -0.1(-3.7,3.5) -0.2(-2.6,8) p = 0.094
PT-A (%) 12.5(-34,76) 10(-36,89) p = 0.231
ALT (IU/L) -211(-2783,431.4) -200.2(-3244.8,464) p = 0.762 Bilirubin(mg/dL) -0.85(-24.9,21.5) 0.2(-21.1,23.6) p = 0.105 Albumin (g/L) 0.1(-22.2,16) 0.4(-14.2,13.7) p = 0.735 Glucose (mmol/L) 0.7(-13.8,21.7) 0(-8.3,17.1) p = 0.113 Serum creatinine (mg/dL) 0.1(-2.5,3.7) 0(-1.5,5.9) p = 0.950 Serum Urea (mmol/L) -0.6(-20.3,18.1) 1(-16.2,23.8) p = 0.057 Na (mmol/L) -1.1(-19.3,18.5) -0.8(-27.5,16.5) p = 0.418 MELD score -2.3(-25.4,19.2) -1.1(-17.7,42.6) p = 0.058 MELD-Na score -0.9(-31.2,36.3) 0(-28.8,30) p = 0.092
CLIFSOFA 0(-6,4) 0(-4,2) p = 0.765
WBC: white blood cell. INR: international normalized ratio. PT-A: prothrombin activity. ALT: alanine aminotransferase. MELD: model of end-stage liver dis-ease . CLIFSOFA: chronic liver failure-sequential organ failure assessment. All the nonparametric data were expressed as median (maximum, minimum).
R = -1.515 + (0.12 x Bilirubin) + (0.068 x evolution in Bilirubin) - (0.057 x PT-A) - (0.028 x evolution in PT-A) -(0.013 x PLT) + (1.271 x anti-HBe)
Formula 2. Formula 2. Formula 2.
Formula 2. Formula 2. Our dynamic prognostic model.
RESULTS
Among 229 patients selected, 12 were ruled out because of combined usage of nucleoside analogue, 12 were ruled out because of the lack of key laboratory data. A total of 205 patients were included in the model group (Figure 1). The observation endpoint was death, liver transplantation or finish 90-day follow up. The mortality rates were 16.6% at 28 days and 23.9% at 90 days after enrollment. The medi-an survival time of the deceased patients was 57 days (5-90) days.
The clinical data were listed in table 1. Eighty three percent of the patients were male, the median HBV-DNA. DNA was 5 x 10⁵ (0, 7.9 x 10⁸) (IU/mL), 46.8% of the
patients were anti-HBe positive, 12.7% had hepatic en-cephalopathy at the time of enrollment. 59.5% had ascites, 1.5% had hepatorenal syndrome and 3.4% had upper gas-trointestinal bleeding. The median MELD score was 24.7(10.8-44.6); the median MELD-Na score was 27.5(10.8-57.7). Ninety patients were treated with entecav-ir and 115 with lamivudine. One hundred and ninety-two cases had been given NAs before admission to the 7 hospi-tals. The others were given at admission. Since the mor-tality rates were similar (at 90 days between entecavir and lamivudine treated patients (22.2% vs. 25.2%, p = 0.618), we did not compare further between these two groups. The change of variables after 7-day treatment was listed in table 2.
Univariate analysis
Univariate analysis showed(Table 3) that male, anti-HBe positive, higher HBV DNA level, lower platelet, lower PT-A, higher bilirubin, lower serum albumin, low-er slow-erum glucose and lowlow-er slow-erum sodium wlow-ere all indi-cators of poor prognosis. Physicians routinely estimated the prognosis based on the baseline status of patients. However, the patients’ response to the treatment was also very important. Our univariate analysis showed that after 7-day treatment, the difference of PT-A, serum albumin and serum creatinine were also independent prognostic indicators.
Model set up
Multivariate analysis included the following indicators in the model (Table 4): baseline PT-A (%), the alteration at day 7; baseline bilirubin (mg/dL), the change at day 7; platelet (x109/L) and anti-HBe status (positive = 1,
nega-tive = 0) at baseline. Our dynamic prognostic model was in formula 2.
AUC of this model was 0.856 (Figure 2A). If we set the cut off line to -0.73, the sensitivity was 67.3%, specificity was 91%. For example: if the baseline bilirubin was 25 mg/dL, PT-A was 20%, platelet was 30 x 109/L, anti-HBe was
Tabla 3. Univariate analysis of factors.
β SE Wald P
Age 0.022 0.015 2.221 0.136 Male sex -1.781 0.749 5.653 0.017 Liver cirrhosis 0.353 0.371 0.906 0.341 Presence of HE 0.67 0.454 2.183 0.14 Presence of Ascites -0.146 0.337 0.189 0.664 HBeAg positive -0.211 0.330 0.407 0.523 Anti-HBe positive 0.88 0.338 6.783 0.009 HBV DNA -0.340 0.113 9.043 0.003 Alpha-fetoprotein 0.000 0.000 0.015 0.901 WBC 0.05 0.039 1.695 0.193 Platelet -0.009 0.004 5.977 0.014 INR 0.17 0.186 0.833 0.362 PT-A -0.046 0.022 4.352 0.037 ALT 0.000 0.000 0.609 0.435 Bilirubin 0.005 0.001 16.988 < 0.001 Albumin -0.12 0.036 11.296 0.001 Glucose 0.137 0.065 4.421 0.035 Serum creatinine -0.001 0.005 0.077 0.781 Blood urea nitrogen 0.001 0.011 0.005 0.941 Na -0.086 0.033 6.636 0.010
ΔAlpha-fetoprotein 0.000 0.001 1.2 0.273
ΔWBC 0.011 0.018 0.392 0.531
ΔPlatelet -0.004 0.004 0.786 0.375
ΔINR 0.074 0.062 1.435 0.231
ΔPT-A -0.042 0.012 11.745 0.001
ΔALT 0.000 0.000 0.651 0.420
ΔBilirubin 0.001 0.001 1.527 0.217
ΔAlbumin 0.093 0.037 6.202 0.013
ΔGlucose -0.004 0.053 0.007 0.934
ΔSerum creatinine 0.024 0.008 10.003 0.002
ΔBlood urea nitrogen 0.066 0.052 1.586 0.208
ΔNa -0.050 0.031 2.493 0.114
HE: hepatic encephalopathy. WBC: white blood cell. INR. international normalized ratio. PT-A: prothrombin activity. ALT: alanine aminotransferase. MELD: model of end-stage liver disease.
R = (0.94 x Bilirubin) + (0.53 x evolution in Bilirubin) - (0.45 x PT-A) - (0.22 x evolution in PT-A) - (0.1 x PLT) +(10 x anti-HBe).
Formula 3. Formula 3. Formula 3. Formula 3. Formula 3.
great probability that the patient will die. In comparison, if the baseline was the same, 7 days later after hospitaliza-tion, the patient’s PT-A increased to 25%, bilirubin de-creased to15 mg/dL, R value should be -0.88, the patient had great probability to survive.
To simplify the model formula, we multiplied it by 7.87 and derived the much simpler formula which was called HBV-ACLF dynamic model For-mula 3.
Bilirubin was mg/dL, PT-A was expressed as %, PLT as x 109/L, anti-HBe negative counts 0 and positive counts 1.
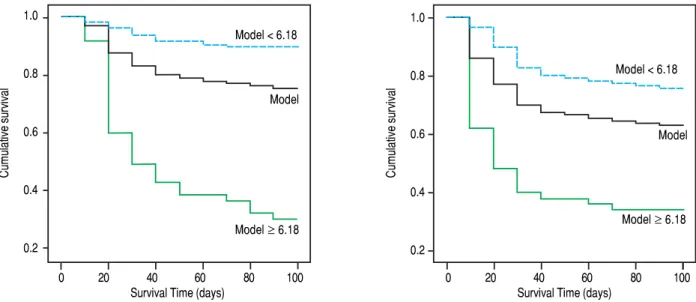
Cutoff value was 6.18. The 90-day mortality rate in our co-hort with R < 6.18 was 10.1% (16/158); this rate was signif-icantly lower than that of patients with R > 6.18 (33/47, 70.2%, χ2 = 71.9, p = 0.000) (Figure 3A).
This model also applied to the patients who only have baseline values, for example, the patients within 7 days af-ter admission, the changes of bilirubin and PT-A were 0, the AUC was 0.801 (0.737, 0.866). But the model drawn from baseline was not as accurate as the HBV-ACLF dy-namic model (χ2 = 5.30, p = 0.0213).
Some special situations
The applicability of
HBV-ACLF dynamic model in patients with different MELD scores
The cut off value was 23.9 when we use MELD to pre-dict mortality. We therefore divided the patients into two groups according to their MELD score. The AUC in group with MELD score above and below 23.9 was 0.833 and 0.841, respectively (χ2 = 0.15, p = 0.6949). This
indi-cated that HBV-ACLF dynamic model was applicable to predict patients’ outcomes in any ACLF patients regard-less of severity as estimated by MELD score.
Table 4. Multivariate analysis of variables.
β SE P RR
Bilirubin 0.007 0.002 p < 0.001 1.007
Platelet -0.013 0.004 p = 0.003 0.987
PT-A -0.057 0.027 p = 0.032 0.945
Evolution of Bilirubin at Day 7 0.004 0.001 p = 0.012 1.004 Evolution of PT-A at Day 7 -0.028 0.014 p = 0.044 0.972
Anti-HBe 1.271 0.423 p = 0.003 3.565
Figure 3. Figure 3.Figure 3.
Figure 3.Figure 3. Survival curve according to cutoff of HBV related acute-on-chronic liver failure model. A.A.A.A.A. Model group. B. B. B. B. B. Validation group. The yellow line: the total accumulation survival curve; the blue line: the accumulation survival curve of patients with R < 6.18; green line: the accumulation survival curve of patients with R ≥ 6.18.
Derivation cohort p value vs. HBV- Validating cohort p value vs.
HBV-AUC(95% CI) ACLF Model AUC(95% CI) ACLF Model
HBV-ACLF -
-0.86 (0.8-0.91) 0.79 (0.73-0.86) Model
MELD 0.58 (0.48-0.69) 0.000 0.67 (0.57-0.76) 0.0068 MELD-Na 0.62 (0.52-0.71) 0.000 0.71 (0.62-0.79) 0.0502
Δ MELD 0.68 (0.58-0.77) 0.0002 0.81 (0.74-0.87) 0.7148
Δ MELD-Na 0.67 (0.57-0.77) 0.0001 0.62 (0.53-0.71) 0.0042
Figure 2. Figure 2. Figure 2.
Figure 2. Figure 2. Comparison of the prognostic accuracy of HBV related acute-on-chronic liver failure dynamic model and other prognostic models. A. A. A. A. A. Derivation group. B. B. B. B. Validation group. ACLF: acute on chronic liver failure. MELD: model of end-stage liver stage. C. B. C. C. C. C. Comparison of AUCs between HBV-ACLF dynam-ic model and other prognostdynam-ic models. AUC: The area under receiver operating characteristdynam-ic curve.
C C C C C
A A A A
A BBBBB
Cumulative survival
1.0
0.8
0.6
0.4
0.2
0 20 40 60 80 100
Survival Time (days)
Model < 6.18
Model
Model ≥ 6.18
Cumulative survival
1.0
0.8
0.6
0.4
0.2
0 20 40 60 80 100
Survival Time (days)
Model < 6.18
Model
Model ≥ 6.18
Sensitivity
1.0
0.8
0.6
0.4
0.2
0.0
0.0 0.2 0.4 0.6 0.8 1.0
1 - Specificity
Sensitivity
1.0
0.8
0.6
0.4
0.2
0.0
0.0 0.2 0.4 0.6 0.8 1.0
1 - Specificity
HBV-ACLF Model M E L D
M E L D - N a C L I F S O F A
Δ MELD
Δ MELD-Na
Δ CLIFSOFA Reference Line
HBV-ACLF Model M E L D
M E L D - N a C L I F S O F A
Δ MELD
Δ MELD-Na
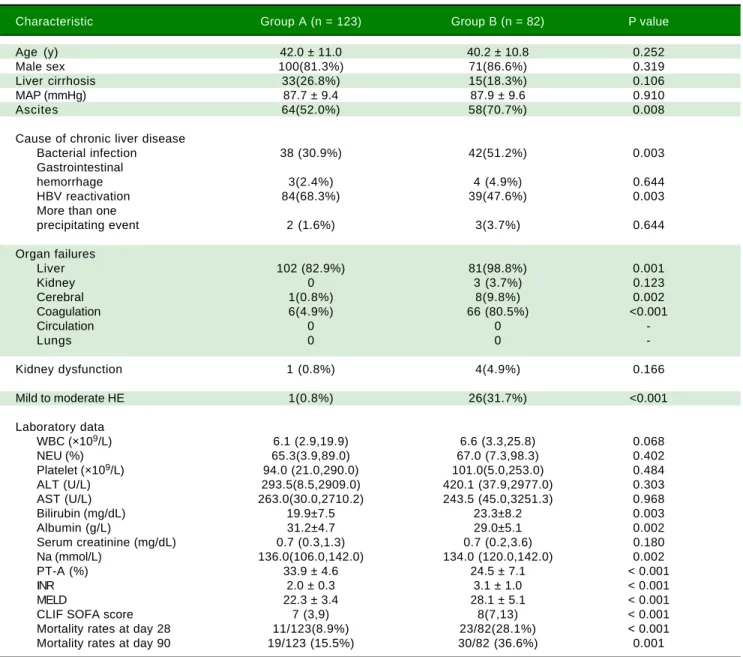
Table 5. Characteristics of patients in group A and B at enrolment.
Characteristic Group A (n = 123) Group B (n = 82) P value
Age (y) 42.0 ± 11.0 40.2 ± 10.8 0.252
Male sex 100(81.3%) 71(86.6%) 0.319
Liver cirrhosis 33(26.8%) 15(18.3%) 0.106
MAP (mmHg) 87.7 ± 9.4 87.9 ± 9.6 0.910
Ascites 64(52.0%) 58(70.7%) 0.008
Cause of chronic liver disease
Bacterial infection 38 (30.9%) 42(51.2%) 0.003 Gastrointestinal
hemorrhage 3(2.4%) 4 (4.9%) 0.644
HBV reactivation 84(68.3%) 39(47.6%) 0.003
More than one
precipitating event 2 (1.6%) 3(3.7%) 0.644
Organ failures
Liver 102 (82.9%) 81(98.8%) 0.001
Kidney 0 3 (3.7%) 0.123
Cerebral 1(0.8%) 8(9.8%) 0.002
Coagulation 6(4.9%) 66 (80.5%) <0.001
Circulation 0 0
-Lungs 0 0
-Kidney dysfunction 1 (0.8%) 4(4.9%) 0.166
Mild to moderate HE 1(0.8%) 26(31.7%) <0.001
Laboratory data
WBC (×109/L) 6.1 (2.9,19.9) 6.6 (3.3,25.8) 0.068
NEU (%) 65.3(3.9,89.0) 67.0 (7.3,98.3) 0.402
Platelet (×109/L) 94.0 (21.0,290.0) 101.0(5.0,253.0) 0.484
ALT (U/L) 293.5(8.5,2909.0) 420.1 (37.9,2977.0) 0.303 AST (U/L) 263.0(30.0,2710.2) 243.5 (45.0,3251.3) 0.968
Bilirubin (mg/dL) 19.9±7.5 23.3±8.2 0.003
Albumin (g/L) 31.2±4.7 29.0±5.1 0.002
Serum creatinine (mg/dL) 0.7 (0.3,1.3) 0.7 (0.2,3.6) 0.180 Na (mmol/L) 136.0(106.0,142.0) 134.0 (120.0,142.0) 0.002
PT-A (%) 33.9 ± 4.6 24.5 ± 7.1 < 0.001
INR 2.0 ± 0.3 3.1 ± 1.0 < 0.001
MELD 22.3 ± 3.4 28.1 ± 5.1 < 0.001
CLIF SOFA score 7 (3,9) 8(7,13) < 0.001
Mortality rates at day 28 11/123(8.9%) 23/82(28.1%) < 0.001 Mortality rates at day 90 19/123 (15.5%) 30/82 (36.6%) 0.001
MAP: mean arterial pressure. HE: hepatic encephalopathy. WBC: white blood cell. NEU: neutrophilic granulocyte. ALT: alanine aminotransferase. AST: aspartate aminotransferase. INR: international normalized ratio. PT-A: prothrombin activity. MELD: model of end-stage liver disease. CLIF SOFA: chronic liver failure-sequential organ failure assessment. All the parametric data were expressed as mean ± SD and nonparametric data were expressed as median (maxi-mum, minimum).
The impact of anti-HBe on the model
The mortality rate was 32.3% in patients with anti-HBe positive in model group and 16.5% in those with anti-HBe negative (p = 0.008). Anti-HBe status did not affect the predictive accuracy of HBV-ACLF dynamic model (AUC in anti-HBe positive was 0.789 and negative, 0.89, χ2 =
2.92, p = 0.0872), the corresponding values of AUC in vali-dation group were 0.856 vs. 0.878 (χ2 = 0.05, p = 0.8158).
Comparison between HBV-ACLF dynamic model
and other models
The AUC values corresponding with MELD,
Validation of HBV-ACLF dynamic model
The baseline variables and their changes at day 7 in vali-dation group were listed in table 1 and 2. Compared with model group, the proportion of patients with HE, ascites and Anti-HBe positive were higher; while levels of creati-nine, MELD and MELD-Na were lower. The changes of the values at day 7 were not significantly different between the derivation group and validation group. But the 28-day and 90-day mortality rates (30.3% and 37.0%) of validation group were significantly higher than those of derivation group. The AUC of the model was 0.79 (0.73-0.86) in vali-dation group, which was higher than MELD (p = 0.0068) and ΔMELD-Na (p = 0.0042), CILF-SOFA (P = 0.022) and ΔCILF-SOFA (p = 0.0029); but not higher than MELD-Na (p = 0.0500) and MELD (p=0.7148) (Figure 2B). When the cut off value was 6.18, the 90-day mortality
of patients with R value below and above than 6.18 was 24.3%(28/115) and 66%(33/50) respectively (p = 0.000) (Figure 3B).
The prognostic ability of the model in group B
The patients were divided into group A (met APASL criteria only, n = 123) and group B (met both APASL and EASL criteria n = 82) (Table 5). Both the MELD score and the CLIF-SOFA score were significantly higher in group B and the 90-day mortality rate were 36.6% (group A 15.5%, p = 0.001). It’s obviously that group B patients were more serious than group A.
We compared our model to other models in group B who met both APASL and EASL criteria. AUC of our model, MELD, MELD-Na, CLIF-SOFA, ΔMELD,
ΔMELD -Na, and ΔCLIF-SOFA was 0.79, 0.45, 0.52, 0.53,
Figure 4. Figure 4. Figure 4.
Figure 4. Figure 4. Comparison of the prognostic accuracy of HBV related acute-on-chronic liver failure dynamic model and chronic liver failure-sequential organ failure assessment in group B. A... Group B in derivation group. B. B. B. B. B. Group B in validating group. ACLF: acute on chronic liver failure. MELD: model of end-stage liver stage. CLIF SOFA: chronic liver failure-sequential organ failure assessment. C. C. C. C. Comparison of AUCs between HBV-ACLF dynamic model and other prognos-C. tic models. AUC: The area under receiver operating characteristic curve.
Group B of derivation p value vs. Group B of validating p value vs.
cohort AUC (95% CI) HBV-ACLF Model cohort AUC (95% CI) HBV-ACLF Model
HBV-ACLF -
-0.79(0.69,0.89) 0.83(0.74,0.91) Model
MELD 0.45(0.32,0.58) 0.0001 0.71(0.60,0.82) 0.0562 MELD-Na 0.52(0.39,0.65) 0.0002 0.74(0.63,0.84) 0.1077 CLIF-SOFA 0.53(0.40,0.66) 0.0000 0.72(0.61,0.83) 0.1172
ΔMELD 0.65(0.53,0.77) 0.0298 0.78(0.69,0.88) 0.4571
ΔMELD-Na 0.59(0.46,0.72) 0.0235 0.59(0.49,0.71) 0.0033
ΔCLIF-SOFA 0.71(0.60,0.83) 0.0588 0.58(0.46,0.71) 0.0003 A
A A A
A BBBBB
C C C C C
Sensitivity
1.0
0.8
0.6
0.4
0.2
0.0
0.0 0.2 0.4 0.6 0.8 1.0
1 - Specificity
Sensitivity
1.0
0.8
0.6
0.4
0.2
0.0
0.0 0.2 0.4 0.6 0.8 1.0
1 - Specificity
HBV-ACLF Model M E L D
M E L D - N a C L I F S O F A
Δ MELD
Δ MELD-Na
Δ CLIFSOFA Reference Line
HBV-ACLF Model M E L D
M E L D - N a C L I F S O F A
Δ MELD
Δ MELD-Na
0.65, 0.59 and 0.71, respecively. p value was all less than 0.05, except CLIF- SOFA (p = 0.0588) (Figure 4A).
In the group B of validation group, the AUC of our HBV-model was still the highest (0.83,0.74-0.91), and sig-nificantly higher than the AUC of MELD-Na (p = 0.0033) and ΔCLIF- SOFA (p =0.0003), but not higher than MELD (p = 0.0562),MELD-Na (p =0.1077), CLIF-SOFA (p = 0.1172) and ΔMELD(p = 0.4571) (Figure 4B).
DISCUSSION
There are ~300 million HBV chronic carriers world-wide, with 75% of them in the Asia-Pacific area. Chronic hepatitis B is the leading cause of liver disease-related mortality.11 Two prospective studies found that 15-37% of
patients with HBV infection had spontaneous acute exac-erbation within 4 years.12,13 Some of the patients had
sud-den onset of ACLF and the mortality rate for these patients was as high as 30%-70%.14-16 Liver transplantation is
cur-rently still the most reliable therapeutic modality.2
Selec-tion of liver transplantaSelec-tion mainly relies on evaluaSelec-tion of prognosis. However, there is currently no ideal model to predict prognosis in patients with ACLF. The present pro-spective cohort study established a prognostic model for patients with HBV-related ACLF being treated with NAs. The main parameters were bilirubin and PT-A and their changes after 1 week, platelet count, and anti-HBe. The special aspects of this model were: a single cause of ACLF; the impact of antiviral therapy on prognosis was taken into account; and changes in liver function were used to reflect effectiveness of treatment.
The parameters in our model were different from those in the CLIF Acute-on-Chronic Liver Failure in Cirrhosis (CANONIC) study, which was carried out by the Euro-pean Association for the Study of the Liver and Chronic Liver Failure Consortium.1 The main reason may be the
difference in patient selection. The diagnostic criteria for ACLF in the CANONIC study were based on the CLIF-SOFA score, which was also the main prognostic factor. In contrast, PT-A and bilirubin abnormalities were the main parameters in the APASL criteria and were the main char-acteristics in our patients. In our cohort only 8(3.9%) pa-tients had renal dysfunction at admission, and other organ failure, such as pulmonary failure, was also rare. The main parameters in our model were therefore PT-A and bi-lirubin. Furthermore, 60.3% of patients in the CANON-IC study had alcoholic hepatitis. Severe alcoholic hepatitis caused an increase in white blood cell (WBC) count, therefore, WBC count was also an important prognostic factor. The present study showed that the average WBC count was only 7.7 x 10⁹/L and was not correlated with
prognosis. The different diagnostic criteria and cause of ACLF between the CANONIC and present studies were
the main reason for inclusion of different prognostic pa-rameters in the two models. The CLIF-SOFA score sys-tem was not applicable to patients with HBV-related ACLF.
Many studies17-19 showed that both ETV and LAM
could improve the survival rate of HBV-related ACLF pa-tients, and the effectiveness were similar.20 This is the
same as our statistics. The mortality rates were 22.2% in entecavir treated patients and 25.2% in lamivudine treated cases in 90 days (p = 0.618).
One of the features of HBV-related ACLF was that the status of HBV infection has an impact on prognosis. The present study showed that patients who were positive for anti-HBe had worse prognosis. The reasons might be as follows:
• These patients had a relatively longer clinical course when compared to anti-HBe negative patients.21
• The rate of cirrhosis was lower in anti-HBe negative group than that in anti-HBe positive group.21
• One of the mechanisms of ACLF in patients with HBV infection is basal core promoter and precore muta-tion.22-24
With these mutations, HBeAg expression is decreased or becomes negative, while expression of HBV core anti-gen is increased, which in turn may induce a strong im-mune response and hepatocyte damage.
Platelet count was another prognostic factor in our study which agrees with previous studies of ACLF14,25-27
and ALF.28 Stravitz, et al. studied 1,598 cases of ALF and
found that all patients have thrombocytopenia in the 1-7 days after admission. But platelets were significantly lower in 1 to 7 days after admission in patients with outcomes of death or liver transplantation than in those with spontane-ous recovery. The decrease in platelets during days 1 to 7 after admission was proportional to the grade of hepatic encephalopathy, requirement for vasopressor and renal re-placement therapy. They speculated that systemic inflam-matory response syndrome (SIRS) activates platelets, yields microparticles, and results in clearance of platelet remnants and subsequent thrombocytopenia. This mecha-nism may also act in ACLF-induced thrombocytopenia. In ACLF patients with underlying chronic liver disease, the baseline platelet count is also associated with hypersplen-ism and decreased thrombopoietin synthesis.29 In
addi-tion, platelets contain abundant growth factors, such as serotonin,30 which are important promoters of liver
re-generation.
Thrombocytopenia may thus contribute to insufficient liver regeneration. Furthermore, platelet consumption31
Microcir-culatory dysfunction in the liver further causes hypoxia and hepatocyte necrosis.31 These speculations may explain
the mechanism of thrombocytopenia in ACLF but need to be studied further.
ACLF is a disease that progresses quickly. The disease severity at the beginning and its progress both impact the prognosis. Ha and colleagues found that aggravation of he-patic encephalopathy and the increase of MELD score at day 7 are the indicators of poor prognosis.32 Huo, et al.
have demonstrated that MELD was superior to the basic
ΔMELD and CTP scores.33 Chamuleau, et al. have also
confirmed that dynamic models are better than baseline ones in predicting prognosis of acute liver failure.34
Gus-tot, et al.35 found that assessment of ACLF patients at 3-7
days after admission was much better than assessment on admission when defining the need for liver transplanta-tion. We compared our model to other models such as MELD, MELD-Na and CLIF-SOFA and found that even the changes at day 7 were not considered, our model is still better than or equal to others. In patients who initially present to a smaller hospital, they are usually transferred to a larger tertiary-care centre after days or weeks of onset. Thus the time of admission to the larger centre may not necessarily reflect the entire natural history.
Accordingly, dynamic rather than baseline assessment of ACLF may be more important in this rapidly progres-sive condition. Our study also showed that the AUC of the dynamic model was significantly higher than that of the baseline model.
In conclusion, our multicenter, prospective cohort study demonstrated that the dynamic model was superior to the baseline model in patients with HBV-induced ACLF undergoing treatment. Our dynamic model was su-perior to MELD and MELD-Na models. The present study may be helpful for clinicians in the management of patients with HBV-related ACLF treated with NAs.
ABBREVIATIONS
• ACLF: acute-on-chronic liver failure. • ALT: alanine aminotransferase. o
• APASL: Asian Pacific Association for Study of the Liver.
• AUC: area under the curve.
• CANONIC: chronic liver failure (CLIF) Acute-on-Chronic Liver Failure in cirrhosis.
• CLIF: chronic liver failure.
• CLIF-SOFA: chronic liver failure-sequential organ failure assessment.
• EASL: European Association for Study of the Liver. • HBV: hepatitis B virus.
• HE: hepatic encephalopathy. • INR: international normalized ratio.
• MAP: mean arterial pressure.
• MELD: model of end-stage liver disease. • NEU: neutrophilic granulocyte.
• PT-A: prothrombin activity. • WBC: white blood cell.
GRANT SUPPORT
National Science and Technology Major Project (Grant No. 2016ZX10002008-04; PI: Zhongping Duan), the National Science and Technology Major Project (Grant No. 2016ZX10004906-014; PI: Jing Zhang), Beijing Municipal Sci-ence and Technology Project (Grant No. Z141100002114022; PI: Jing Zhang) Science and Technology New Star Pro-gramme of Beijing Fengtai District (PI: Wei Lin).
REFERENCES
1. Moreau R, Jalan R, Gines P, Pavesi M, Angeli P, Cordoba J, Durand F, et al. Acute-on-chronic liver failure is a distinct syndrome that develops in patients with acute decompensa-tion of cirrhosis. Gastroenterology 2013; 144: 1426-37. 2. Sarin SK, Kumar A, Almeida JA, Chawla YK, Fan ST, Garg
H, de Silva HJ, et al. Acute-on-chronic liver failure: consen-sus recommendations of the Asian Pacific Association for the study of the liver (APASL). Hepatol Int 2009; 3: 269-82. 3. Galbois A, Das V, Carbonell N, Guidet B. Prognostic scores
for cirrhotic patients admitted to an intensive care unit: which consequences for liver transplantation? Clin Res Hepatol Gastroenterol 2013; 37: 455-66.
4. Wan Z, Wu Y, Yi J, You S, Liu H, Sun Z, Zhu B, et al.Combining serum cystatin C with total bilirubin improves short-term mortality prediction in patients with HBV-related acute-on-chronic liver failure. PLoS One 2015; 28: e0116968.
5. Xie F, Yan L, Lu J, Zheng T, Shi C, Ying J, Shen R, et al. Ef-fects of nucleoside analogue on patients with chronic hepa-titis B-associated liver failure: meta- analysis. PloS one
2013; 8: e54773.
6. Zhang L, Hao CQ, Liu JF, Wang M. Meta-analysis of the short-term effects of lamivudine treatment for severe chron-ic hepatitis B. Virol J 2013; 10: 134.
7. Zhang L, Hao CQ, Liu JF, Wang M. The efficacy and safety of nucleos(t)ide analogues in the treatment of HBV-related acute-on-chronic liver failure: a meta -analysis. Ann Hepatol
2013; 12: 364-72.
8. Moore KP, Wong F, Gines P, Bernardi M, Ochs A, Salerno F, Angeli P, et al. The management of ascites in cirrhosis: re-port on the consensus conference of the International As-cites Club. Hepatology 2003; 38: 258-66.
9. Runyon BA; AASLD.Introduction to the revised American Association for the Study of Liver Diseases Practice Guide-line management of adult patients with ascites due to cirrho-sis 2012. Hepatology 2013; 57: 1651-3.
10. Ferenci P, Lockwood A, Mullen K, Tarter R, Weissenborn K, Blei AT. Hepatic encephalopathy- Definition, nomenclature, diagnosis, and quantification: Final report of the Working Par-ty at the 11th World Congresses of Gastroenterology, Vien-na, 1998. Hepatology 2002; 35: 716-21.
12. Kanno A, Suzuki H, Miyazaki Y, Sato S, Otsuki M, Goto Y, Ohori H. Severe acute exacerbation in chronic hepatitis B vi-rus infection in Sendai, Japan. Tohoku J Exp Med 1988; 155: 363-71.
13. Chen CH, Lin CL, Hu TH, Hung CH, Tseng PL, Wang JH, Chang JY, et al. Entecavir vs. lamivudine in chronic hepatitis B patients with severe acute exacerbation and hepatic de-compensation. J Hepatol 2014; 60: 1127-34.
14. Garg H, Sarin SK, Kumar M, Garg V, Sharma BC, Kumar A. Tenofovir improves the outcome in patients with spontane-ous reactivation of hepatitis B presenting as acute-on-chronic liver failure. Hepatology 2011; 53: 774-80.
15. Garg V1, Garg H, Khan A, Trehanpati N, Kumar A, Sharma BC, Sakhuja P, et al. Granulocyte colony-stimulating factor mobilizes CD34(+) cells and improves survival of patients with acute-on-chronic liver failure. Gastroenterology 2012; 142: 505-12.
16. Garg H, Kumar A, Garg V, Sharma P, Sharma BC, Sarin SK. Clinical profile and predictors of mortality in patients of acute-on-chronic liver failure. Dig Liver Dis 2012; 44: 166-71.
17. Chen T, He Y, Liu X, Yan Z, Wang K, Liu H. Nucleoside ana-logues improve the short-term and long-term prognosis of patients with hepatitis B virus-related acute-on-chronic liver failure. Clin Exp Med 2012; 12(3): 159-64.
18. Ma K, Guo W, Han M, Chen G, Chen T, Wu Z. Entecavir treat-ment prevents disease progression in hepatitis B virus-related acute-on-chronic liver failure: Establishment of a novel logisti-cal regression model. Hepatol Int 2012;6(4):735-43.
19. Sun LJ, Yu JW, Zhao YH, Kang P, Li SC. Influential factors of prognosis in lamivudine treatment for patients with acute-on-chronic hepatitis B liver failure. J Gastroenterol Hepatol
2010; 25(3): 583-90.
20. Zhang X, An Y, Jiang X, Xu M, Xu L, Chen S, Xi Y. Entecavir Versus Lamivudine therapy for patients with chronic hepati-tis B-associated liver failure: a meta-analysis. Hepat Mon
2014; 14: e19164.
21. Pan CQ, Zhang JX. Natural history and clinical consequenc-es of hepatitis B Virus infection. Int J Med Sci 2005; 2: 36-40. 22. Xu Z, Ren X, Liu Y, Li X, Bai S, Zhong Y, Wang L, et al. As-sociation of hepatitis B virus mutations in basal core promot-er and precore regions with sevpromot-erity of livpromot-er disease: an investigation of 793 Chinese patients with mild and severe chronic hepatitis B and acute-on-chronic liver failure. J Gas-troenterol 2011; 46: 391-400.
23. Xiao L, Zhou B, Gao H, Ma S, Yang G, Xu M, Abbott WG, et al. Hepatitis B virus genotype B with G1896A and A1762T/ G1764A mutations is associated with hepatitis B related acute-on-chronic liver failure. J Med Virol 2011; 83: 1544-50. 24. Ren X, Xu Z, Liu Y, Li X, Bai S, Ding N, Zhong Y, et al.
Hepa-titis B virus genotype and basal core promoter/precore mu-tations are associated with hepatitis B-related acute-on-chronic liver failure without pre-existing liver cir-rhosis. J Viral Hepat 2010; 17: 887-95.
25. Zheng MH, Shi KQ, Fan YC, Li H, Ye C, Chen QQ, Chen YP. A model to determine 3-month mortality risk in patients with acute-on-chronic hepatitis B liver failure. Clin Gastroenterol Hepatol 2011; 9: 351-6.
26. Sun QF, Ding JG, Xu DZ, Chen YP, Hong L, Ye ZY, Zheng MH, et al. Prediction of the prognosis of patients with acute-on-chronic hepatitis B liver failure using the model for end-stage liver disease scoring system and a novel logistic regression model. J Viral Hepat 2009; 16: 464-70.
27. Naiki T, Nakayama N, Mochida S, Oketani M, Takikawa Y, Su-zuki K, Tada S, et al. Novel scoring system as a useful mod-el to predict the outcome of patients with acute liver failure: Application to indication criteria for liver transplantation.
Hepatol Res 2012; 42: 68-75.
28. Stravitz RT, Ellerbe C, Durkalski V, Reuben A, Lisman T, Lee WM. Acute Liver Failure Study Group. Thrombocytopenia is associated with multi-organ system failure in patients with acute liver failure. Clin Gastroenterol Hepatol 2016; 14: 613-20.
29. Lee WM. Recent developments in acute liver failure. Best Pract Res Clin Gastroenterol 2012; 26: 3-16.
30. Lesurtel M, Graf R, Aleil B, Walther DJ, Tian Y, Jochum W, Gachet C, et al. Platelet-derived serotonin mediates liver re-generation. Science 2006; 312: 104-7.
31. Hugenholtz GC, Adelmeijer J, Meijers JC, Porte RJ, Stravitz RT, Lisman T. An unbalance between von Willebrand factor and ADAMTS13 in acute liver failure: Implications for hemos-tasis and clinical outcome. Hepatology 2013; 58: 752-61. 32. Ha JM, Sohn W, Cho JY, Pyo JH, Choi K, Sinn DH, Gwak GY,
et al. Static and dynamic prognostic factors for hepatitis-B-related acute-on-chronic liver failure. Clin Mol Hepatol 2015; 21: 232-41.
33. Huo TI, Wu JC, Lin HC, Lee FY, Hou MC, Lee PC, Chang FY, et al. Evaluation of the increase in model for end-stage liver disease (Delta MELD) score over time as a prognostic pre-dictor in patients with advanced cirrhosis: risk factor analy-sis and comparison with initial MELD and Child-Turcotte-Pugh score. J Hepatol 2005; 42: 826-32.
34. Chamuleau RA, Wlodzimirow KA, Abu-Hanna A. Incorporat-ing dynamics for predictIncorporat-ing poor outcome in acute liver fail-ure patients. World J Gastrointest Surg 2012; 4: 281-3. 35. Gustot T, Fernandez J, Garcia E, Morando F, Caraceni P,
Alessandria C, Laleman W, et al. Clinical course of acute-on-chronic liver failure syndrome and effects on prognosis.
Hepatology 2015; 62: 243-52.
Correspondence and reprint request: Samuel S. Lee, M.D.
Liver Unit, University of Calgary, Calgary, Canada. Tel.: 1 403-220-8457, Fax: 1 403-592-5090