Thromboelastography Parameters in
Patients with Acute on Chronic Liver Failure
Sandeep-Goyal,* Shekhar-Jadaun,* Saurabh-Kedia,* Subrat Kumar-Acharya,* Sharat-Varma,† Baibaswata-Nayak,* Bhaskar-Thakur,‡ Shalimar* * Department of Gastroenterology, All India Institute of Medical Sciences, New Delhi, India.
† Department of Pediatric Hepatology and Gastroenterology, Max Hospital, New Delhi, India. ‡ Department of Biostatistics, All India Institute of Medical Sciences, New Delhi, India.
November-December, Vol. 17 No. 6, 2018: 1042-1051
The Official Journal of the Mexican Association of Hepatology, the Latin-American Association for Study of the Liver and
the Canadian Association for the Study of the Liver
Manuscript received: Manuscript received: Manuscript received: Manuscript received:
Manuscript received: March 16, 2018. Manuscript accepted:Manuscript accepted:Manuscript accepted:Manuscript accepted:Manuscript accepted: July 06, 2018.
DOI:10.5604/01.3001.0012.7205 A B S T R A C T A B S T R A C T A B S T R A C T A B S T R A C T A B S T R A C T
Introduction and aim. Introduction and aim.Introduction and aim. Introduction and aim.
Introduction and aim. Patients with acute on chronic liver failure (ACLF) have abnormal conventional coagulation tests- platelet count and international normalized ratio (INR). Thromboelastography (TEG) is a rapid, point-of-care assay, more comprehensive than platelet count and INR as it assesses for platelet adequacy(number and function), coagulation factors and clot retraction. The aim of the study was to evaluate the TEG parameters in patients with ACLF, chronic liver disease having acute decompensation (AD) and healthy subjects (HC). Material and methods.Material and methods.Material and methods.Material and methods.Material and methods. TEG parameters were assessed in patients with ACLF and AD within 24 h of admission. Consecutive patients were included in the study over 12 months. Healthy subjects were recruited as controls. Re
ReRe Re
Results.sults.sults.sults.sults. 179 patients were included- 68 ACLF, 53 AD and 58 HC. The mean values of INR in ACLF, AD and HC groups were 2.9 ± 1.4, 1.6 ± 0.4 and 1.1 ± 0.2; P < 0.001. Among TEG parameters - maximum amplitude (MA) was low in ACLF and AD patients as compared with HC (53.8 ± 15, 58.3 ± 13.9 mm and 67.2 ± 12.1 mm, respectively; P < 0.001). Lysis at 30 min (LY30) was high in ACLF patients, as compared to AD and HC (8.6 ± 14.1%, 5.0 ± 9.5% and 4.9 ± 9.8%, respectively; P = 0.060). There were no differences in r time, k time, and alpha angle between groups; normal in >90% patients. There was no difference in TEG parameters between different ACLF grades, whereas CCTs were more deranged with increasing grades of ACLF. Conclusion.Conclusion.Conclusion.Conclusion.Conclusion. Despite abnormal conventional coagulation tests, TEG parameters in ACLF patients are essentially normal, except reduced maximum amplitude. Future studies are needed to explore the utility of TEG in clinical management of ACLF patients.
Key words. Key words.Key words. Key words.
Key words. Acute decompensation. Cirrhosis. Liver failure. Hemostasis. Conventional coagulation parameters.
INTRODUCTION
Acute on chronic liver failure (ACLF) is a syndrome characterized by acute hepatic failure in patients with an underlying chronic liver disease (CLD).1 It is frequently associated with one or more extra-hepatic organ failures (OFs), namely kidney, brain, circulation and pulmonary.1 ACLF is graded according to prolongation of the INR and number of OFs, and increasing mortality is observed with higher grades.2-4
Patients with both acute and chronic liver disease have abnormal conventional coagulation tests (CCTs) - pro-thrombin time (PT) / international normalized ratio (INR) and platelet counts, and are classically considered
to be in a state of “autoanticoagulation”. Recently, this concept has been challenged- the thrombin generation in patients with liver disease is normal when tested in condi-tions accounting for the contribution of the anticoagulant pathways.5 Moreover, there is increased risk of thrombo-sis in patients with CLD.6
TEG parameters in patients with ACLF and compare with those in chronic liver disease and acute decompensation and healthy controls.
MATERIAL AND METHODS
In this prospective study, done between June 2015 and June 2016, we included all patients admitted in the Department of Gastroenterology at the All India Insti-tute of Medical Sciences, New Delhi, India with ACLF as per the CANONIC study criteria.1 Exclusion criteria were: transfusion of blood products within 48 h prior to admission, therapy with anti-platelet drugs/ anticoagulants and history of a primary disease with coagulation disturbance (paroxysmal nocturnal hemo-globinuria, polycythemia, idiopathic thrombocytope-nia or hemophilia), pregnancy or post-partum period, and concomitant chronic kidney disease. Age and sex matched healthy controls (HC) and patients of CLD with acute decompensation and no ACLF (AD) were recruited in the comparison groups. The study was ap-proved by the institute ethics committee (IEC/T-203/ 05.05.15) and registered at ClinicalTrial.gov registry (NCT02757170). Informed consent was obtained from patients or from their nearest relatives in cases with altered sensorium.
Definitions
CLD was diagnosed based on liver biopsy or a com-bination of conventional endoscopic and imaging crite-ria. Infection10 and hepatic encephalopathy (HE)11 were defined and graded as per widely accepted criteria. The OFs were assessed as per the CLIF-OF scoring system and CLIF-C ACLF score calculated as described.12 AD was defined as acute development of any of the follow-ing-ascites, encephalopathy, gastrointestinal bleeding or bacterial infection. ACLF was defined and graded as per the CANONIC study.1 Healthy controls were defined as volunteers who did not have underlying liver disease. In addition, Model for End Stage Liver Disease (MELD),13 MELD-Na,14 acute physiology and chronic health evaluation (APACHE) II15 scores were calculated at baseline.
Workup for Etiology of
Acute Hepatic Insult and Underlying CLD
All patients were evaluated for hepatitis A, B, C and E infection, autoimmune hepatitis, Wilson disease and alco-holism, using standard criteria. The etiologies of CLD and superadded acute hepatic insult were identified using ac-cepted criteria.16,17
Management Protocol
A uniform management protocol was followed for ACLF.2,17 Patients with underlying HBV infection were started on oral antiviral drugs (Entecavir or Tenofovir). Strict abstinence was maintained for patient’s actively con-suming alcohol. Patients who developed spontaneous bac-terial peritonitis and hepatorenal syndrome were managed as per recommendations. Renal replacement therapy and ventilator support were provided when appropriate. Ap-propriate treatment for HE was instituted. Blood sugars and electrolytes were maintained with intravenous or oral supplementation as required.
Assessment with conventional coagulation tests,
TEG and data collection
Within 24 h of admission, CCTs and TEG were per-formed and analyzed in the standard format. In summary, within 4 min of drawing the sample, 360 μL (approx. 6 drops) of blood was pipetted out in a plastic cup of the TEG machine. Sample was processed for 60 min and fol-lowing parameters were recorded: (1) reaction (r) time: defined as the time between the start of the test and the initial fibrin formation, (2) kinetic (k) time: defined as the time from initial fibrin formation to reach an amplitude of 20 mm, (3) alpha (a) angle: this measures the speed at which fibrin builds up and cross linking takes place, (d) maximum amplitude (MA): measures the ultimate strength of the fibrin clot, (e) lysis at 30 min (LY30): defined as the percentage decline in amplitude at 30 min
Figure 1. Figure 1. Figure 1. Figure 1.
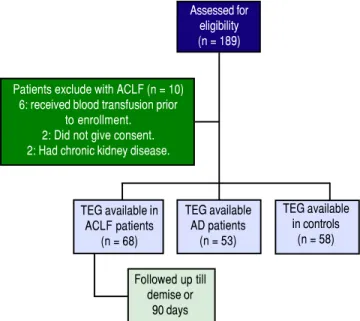
Figure 1. Enrollment and follow-up of patients. Patients exclude with ACLF (n = 10)
6: received blood transfusion prior to enrollment. 2: Did not give consent. 2: Had chronic kidney disease.
Assessed for eligibility (n = 189)
TEG available in ACLF patients
(n = 68)
TEG available AD patients
(n = 53)
TEG available in controls
(n = 58)
Followed up till demise or
vival of ACLF patients. P value ≤ 0.05 was considered as statistically significant. Data analysis was done using STA-TA version 14 (StataCorp, Texas, USA) and Medcalc soft-ware (version15.11.4, MedCalc Softsoft-ware, Ostend, Belgium).
RESULTS
Prospectively, 78 patients with ACLF, 53 with AD and 58 HC were enrolled. 68 of the 78 ACLF patients satisfied the inclusion and exclusion criteria (Figure 1). The rea-sons for exclusion for the remaining 10 were- 6 patients received blood products (fresh frozen plasma and/or platelets) within previous 24 h of admission, 2 had chronic kidney disease and 2 refused consent.
Descriptive characteristics of included patients
The mean age (±SD) in the ACLF group was 42.6 ± 13.8 years; 56/68 (82.4%) were males. The clinical and labo-ratory details are provided in table 1. Alcohol consump-post MA, this represents the degree of fibrinolysis
(0-15%). We compared the values of CCTs and TEG parameters in ACLF, AD and HC groups. In addition, we categorized the values as abnormal according to the values previously described in healthy Indian population.18
Statistical Analysis
The normally distributed variables were expressed as mean ± standard deviation (SD) and continuous variables with skewed distribution as median (inter-quartile range). Categorical data was presented as frequency and propor-tions. Comparison of continuous and normally distributed variables between more than two groups was done using one-way Analysis of Variance (ANOVA) with Bonferroni correction for multiple comparison tests. Variables with skewed distribution were compared using the Kruskal-Wallis ANOVA test followed by the Mann-Whitney U test with adjusted P values. The comparison of continuous var-iables between two groups was done using independent
t-test. Categorical variables were analyzed using chi-square test. Kaplan-Meier curves were used to estimate the
sur-Table 1. Comparison of demographic, clinical and laboratory characteristics of patients with acute on chronic liver failure (n = 68), acute decompensation (n = 53) and healthy controls (n = 58).
Parameters ACLF (n = 68) AD (n = 53) HC (n = 58) P value
Age, years 42.6 ± 13.8 44.8 ± 14.1 42.5±12.1 0.870
Sex (M:F), n (%) 56 (82.4%) : 12 39 (73.6) : 14 46 (79.3) : 12 0.501
(17.6) % (26.4) % (20.7) %
Hemoglobin, g/dL 9.1±2.1 9.5±2.6 13.7±2.4 < 0.001†,‡
WBC Count, per mm3 13519.7±7708.3 7684.9 ±4887.9 8652.4 ±2201.9 < 0.001*,†,‡
Platelets(x 103), per mm3 106 ±70 111 ±69 222 ±66 < 0.001†,‡
Blood urea, mg/dL 75.1±54.0 42.4±38.4 25.7±6.6 < 0.001*,†
Creatinine, mg/dL 2.18±2.24 1.18±1.31 0.78±0.1 < 0.001*,†
Sodium, mEq/L 136.2 ±9.5 130.5 ±6.8 138.7 ±4.6 0.115
Potassium, mEq/L 4.1±0.9 4.3±0.9 4.6±0.7 < 0.01†
Total bilirubin, mg/dL 13.8±10.7 2.3±2.3 0.6±0.4 < 0.001*,†,‡
Aspartate aminotransferase, IU/L 178.5 ±246.5 82.8±114.0 29.2±11.3 < 0.001*,†,‡
Alanine aminotransferase, IU/L 130.1 ±316.0 46.8±59.1 31.3±19.3 < 0.001*,†
Serum alkaline phosphatase, U/L 287.3 ±175.1 306.7 ±291.5 216.4 ±103.0 0.713
Serum albumin, g/dL 2.6±0.5 3.2±0.8 4.7±0.6 < 0.001*,†,‡
Arterial Ammonia, μmol/L 96.1±29.1 -
-Prothrombin time, seconds 33.2±17.3 17.4±5.3 12.4±2.2 < 0.001*,†,‡
Activated partial thromboplastin time, s 56.8±23.2 38.1±13.9 31.2±5.4 < 0.001*,†,‡
International normalized ratio 2.9±1.4 1.6±0.4 1.1±0.2 < 0.001*,†,‡
r time, minutes 5.1±2.7 5.4±2.7 4.8±2.5 0.572
k time, minutes 3.3±2.3 3.2±1.7 3.2±1.5 0.920
Alpha Angle, degree 54.6±13.1 52.6±14.3 54.2±11.0 0.667
Maximum amplitude, mm 53.8±15.0 58.0±13.9 67.2±12.1 < 0.001†,‡
Lysis at 30 min, % 8.6±14.1 5.0±9.5 4.2±8.0 0.060
MELD score 29.6±9.1 14.1±6.9 < 0.001*
MELD-Na score 32.0±8.6 16.2±7.6 < 0.001*
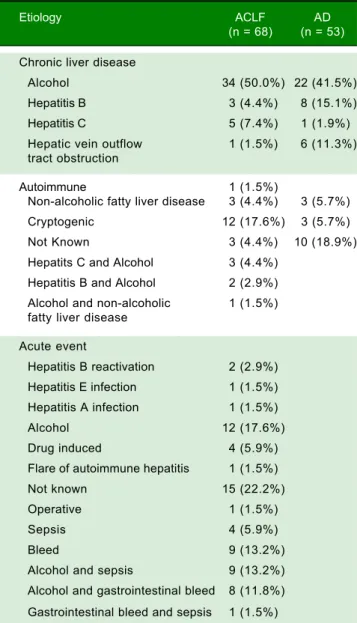
Table 2. Etiologies of acute precipitating event and underlying
chronic liver disease in patients with acute on chronic liver fail-ure and cirrhosis with acute decompensation without acute on chronic liver failure.
Etiology ACLF AD
(n = 68) (n = 53)
Chronic liver disease
Alcohol 34 (50.0%) 22 (41.5%)
Hepatitis B 3 (4.4%) 8 (15.1%)
Hepatitis C 5 (7.4%) 1 (1.9%)
Hepatic vein outflow 1 (1.5%) 6 (11.3%) tract obstruction
Autoimmune 1 (1.5%)
Non-alcoholic fatty liver disease 3 (4.4%) 3 (5.7%)
Cryptogenic 12 (17.6%) 3 (5.7%)
Not Known 3 (4.4%) 10 (18.9%)
Hepatits C and Alcohol 3 (4.4%) Hepatitis B and Alcohol 2 (2.9%) Alcohol and non-alcoholic 1 (1.5%) fatty liver disease
Acute event
Hepatitis B reactivation 2 (2.9%) Hepatitis E infection 1 (1.5%) Hepatitis A infection 1 (1.5%)
Alcohol 12 (17.6%)
Drug induced 4 (5.9%)
Flare of autoimmune hepatitis 1 (1.5%)
Not known 15 (22.2%)
Operative 1 (1.5%)
Sepsis 4 (5.9%)
Bleed 9 (13.2%)
Alcohol and sepsis 9 (13.2%) Alcohol and gastrointestinal bleed 8 (11.8%)
Gastrointestinal bleed and sepsis 1 (1.5%)
All values are expressed as n (%). ACLF: acute on chronic liver failure. AD: cirrhosis with acute decompensation without ACLF.
tion was the most common etiological factor in both ACLF (50.0%) and AD (41.5%) (Table 2). The mean se-rum bilirubin, aspartate aminotransferase and alanine ami-notransferase levels were significantly higher in ACLF group as compared with AD and healthy controls. The mean ± sd APACHE II score, MELD score and MELD-Na score in ACLF patients were 19.5 ± 9.3, 29.6 ± 9.1 and 32.0 ± 8.6 respectively. In ACLF patients, various OFs-kidney, circulatory, respiratory, liver, cerebral and coagu-lation, as per the CLIF criteria, were seen in 36 (52.9%),
23 (33.8%), 20 (29.4%), 37 (54.4%), 32 (47.1%) and 39 (57.4%) cases respectively.
Comparison of CCT parameters in ACLF, AD and HC groups
Mean PT, aPTT and INR were significantly prolonged in ACLF group as compared to AD and HC patients (P < 0.001) for all comparisons. The details of individual pa-rameters are shown in table 1.
Comparison of
TEG parameters in ACLF, AD patients and HC with normal defined ranges
The maximum amplitude (MA) was lower in ACLF and AD patients as compared to HC. There was a trend to-wards higher LY30 value in ACLF patients as compared to HC (P = 0.060). There were no differences in r time, k time and alpha angle between ACLF, AD and HC groups (Tables 1 and 3).
Subgroup analysis of CCTs, TEG parameters within the ACLF group
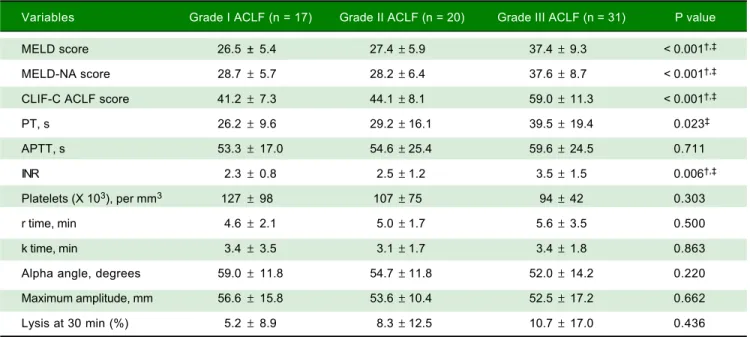
• CCTs and TEG in patients with different grades of ACLF. Within the ACLF group (n = 68), severity grades I, II and III were observed in 25.0%, 29.4% and 45.6% of the cohort. As expected, prognostic scores -MELD, MELD-Na and CLIF - C ACLF scores were significantly higher in patients with grade III ACLF as compared to those with grades I and II. There were no significant differences between various TEG parame-ters among patients with different ACLF grades. The details of the TEG parameters are shown in table 4. • CCTs and TEG parameters in ACLF patients
with sepsis. Sepsis was seen at presentation in 24 (35.2%) of patients. There were no significant differ-ences in various TEG parameters between patients with and without sepsis at time of presentation (Table 5). • CCTs and TEG parameters in ACLF patients
with acute kidney injury. Forty six (67.6 %) ACLF patients had acute kidney injury (AKI) at the time of presentation. A significant prolongation of r time was observed in patients with AKI as compared to those without AKI. There were no differences in the rest of the CCTs, platelet count and other TEG parameters (Table 6).
Table 3. Thromboelastography parameters in acute on chronic liver failure (n = 68), chronic liver disease (n = 53) and healthy controls
(n = 58).
Parameter ACLF (n = 68) AD (n = 53) HC (n = 58) P value
r time 0.600
Normal range (1.8 - 14.2 min) 62 (91.2%) 49 (92.5%) 56 (96.6%) Less than normal (< 1.8 min) 5 (7.4%) 4 (7.5%) 2 (3.4%)
More than normal (> 14.2 min) 1 (1.5%) 0 0
k time 0.504
Normal range (0.7 - 7.3 min) 65 (95.6%) 52 (98.1%) 58 (100.0%)
Less than normal (< 0.7 min) 1 (1.5%) 0 0
More than normal (> 7.3 min) 2 (2.9%) 1 (1.9%) 0
Alpha Angle 0.886
Normal range (27.3 - 72.3°) 64 (94.1%) 48 (92.3%) 55 (94.8%)
Less than normal (< 27.3°) 1 (1.5%) 1 (1.9%) 0
More than normal (> 72.3°) 3 (4.4%) 3 (5.8%) 3 (5.2%)
Maximal amplitude 0.382
Normal range (32.1 - 87.9 mm) 63 (92.6%) 52 (98.1%) 55 (94.8%) Less than normal (< 32.1 mm) 4 (5.9%) 1 (1.9%) 1 (1.7%)
More than normal (> 87.9 mm) 1 (1.5%) 0 2 (3.4%)
Lysis at 30 min 0.002
Normal (0 - 15%) 52 (76.5%) 45 (84.9%) 57 (98.3%)
Abnormal (> 15%) 16 (23.5%) 8 (15.1%) 1 (1.7%)
All values are expressed as n (%). ACLF: acute on chronic liver failure. AD: cirrhosis with acute decompensation, no ACLF. HC: healthy controls.
Table 4. Comparison of conventional coagulation parameters and TEG variables among patients with different grades of acute on chronic liver failure(ACLF).
Variables Grade I ACLF (n = 17) Grade II ACLF (n = 20) Grade III ACLF (n = 31) P value
MELD score 26.5 ± 5.4 27.4±5.9 37.4±9.3 < 0.001†,‡
MELD-NA score 28.7 ±5.7 28.2±6.4 37.6±8.7 < 0.001†,‡
CLIF-C ACLF score 41.2 ±7.3 44.1±8.1 59.0±11.3 < 0.001†,‡
PT, s 26.2 ±9.6 29.2±16.1 39.5±19.4 0.023‡
APTT, s 53.3 ±17.0 54.6±25.4 59.6±24.5 0.711
INR 2.3 ±0.8 2.5±1.2 3.5±1.5 0.006†,‡
Platelets (X 103), per mm3 127 ±98 107±75 94 ±42 0.303
r time, min 4.6 ±2.1 5.0±1.7 5.6±3.5 0.500
k time, min 3.4 ±3.5 3.1±1.7 3.4±1.8 0.863
Alpha angle, degrees 59.0 ±11.8 54.7±11.8 52.0±14.2 0.220
Maximum amplitude, mm 56.6 ±15.8 53.6±10.4 52.5±17.2 0.662
Lysis at 30 min (%) 5.2 ±8.9 8.3±12.5 10.7±17.0 0.436
All values are expressed at mean ± SD (unless otherwise mentioned). ACLF: acute on chronic liver failure. MELD: model for end stage liver disease score. MELD-NA: meld-sodium score. CLIF-C ACLF: CLIF consortium ACLF score. PT: prothrombin time. APTT: activated partial thromboplastin time. INR: international normalized ratio. * Significant between ACLF grade I and II, † significant between ACLF grade II and III; ‡ significant between ACLF
Table 7. Comparison of conventional coagulation tests and TEG parameters in acute on chronic liver failure patients with and without gastrointestinal bleed at the time of admission.
Parameters GI bleed (n = 25) No - GI bleed (n = 43) P value
PT, sec 28.8 ± 13.3 35.8 ± 19.0 0.119
aPTT, sec 51.8 ± 22.2 61.1 ± 23.6 0.164
INR 2.6 ± 1.1 3.1 ± 1.4 0.220
Platelets(x 103), per mm3 99 ± 48 111 ± 80 0.516
r time, min 5.1 ± 2.5 5.1 ± 2.8 0.997
k time, min 2.8 ± 1.9 3.5 ± 2.5 0.386
Alpha Angle, degree 56.1 ± 14.3 53.7 ± 12.4 0.480
Amplitude, mm 51.1 ± 17.2 55.4 ± 13.5 0.248
Lysis at 30 min, (%) 15.8 ± 18.4 4.4 ± 8.0 0.001
All values are expressed as mean ± SD. PT: prothrombin time. aPTT: activated partial thromboplastin time. INR: international normalized ratio.
Table 6. Comparison of conventional coagulation tests and TEG parameters in acute on chronic liver failure patients with and without acute kidney injury at the time of admission.
Parameters Acute kidney injury (n = 46) No kidney injury (n = 22) P value
PT, sec 35.4 ± 18.9 28.1 ± 11.6 0.123
aPTT, sec 58.7 ± 23.5 52.1 ± 22.7 0.376
INR 3.1 ± 1.5 2.6 ± 1.0 0.201
Platelets (x 103), per mm3 119 ± 53 101 ± 77 0.331
r time, min 5.7 ± 2.9 4.0 ± 1.7 0.016
k time, min 3.2 ± 2.6 3.3 ± 1.6 0.958
Alpha Angle, degree 54.7 ± 14.2 54.3 ± 10.6 0.901
Maximum amplitude, mm 53.4 ± 15.3 54.6 ± 14.6 0.754
Lysis at 30 min (%) 10.8 ± 15.9 4.1 ± 6.3 0.064
All values are expressed as mean ± SD. PT: prothrombin time. aPTT: activated partial thromboplastin time. INR: international normalized ratio.
Table 5. Comparison of conventional coagulation tests and thromboelastography parameters in acute on chronic liver failure patients
with and without sepsis at the time of admission.
Parameters Sepsis (n = 24) No sepsis (n = 44) P value
PT, s 35.3 ±20.2 32.19 ±15.8 0.499
aPTT, s 59.4 ±24.6 55.9 ±23.1 0.644
INR 3.1 ±1.5 2.9 ±1.3 0.644
Platelets (x 103), per mm3 111.4 ±71.8 98.6 ±69.1 0.479
r time, min 5.2 ±2.2 5.1 ±3.1 0.848
k time, min 3.9 ±3.1 2.9 ±1.7 0.106
Alpha angle, degree 51.7 ±12.7 56.1 ±13.2 0.188
Maximum amplitude, mm 49.8 ±13.5 56.0 ±15.5 0.107
Lysis at 30 min (%) 6.5 ±10.8 9.7 ±15.0 0.371
All values are expressed as mean ± SD. PT: prothrombin time. aPTT: activated partial thromboplastin time. INR: international normalized ratio.
observed in patients with bleed as compared to those without bleed (Table 7).
• Development of thrombosis and bleeding. Forty-five ACLF patients underwent central line insertion, 6 patients underwent transjugular liver biopsies, 1 pa-tient underwent lumbar puncture and all underwent diagnostic / therapeutic abdominal paracentesis. There
Overall Survival in ACLF patients
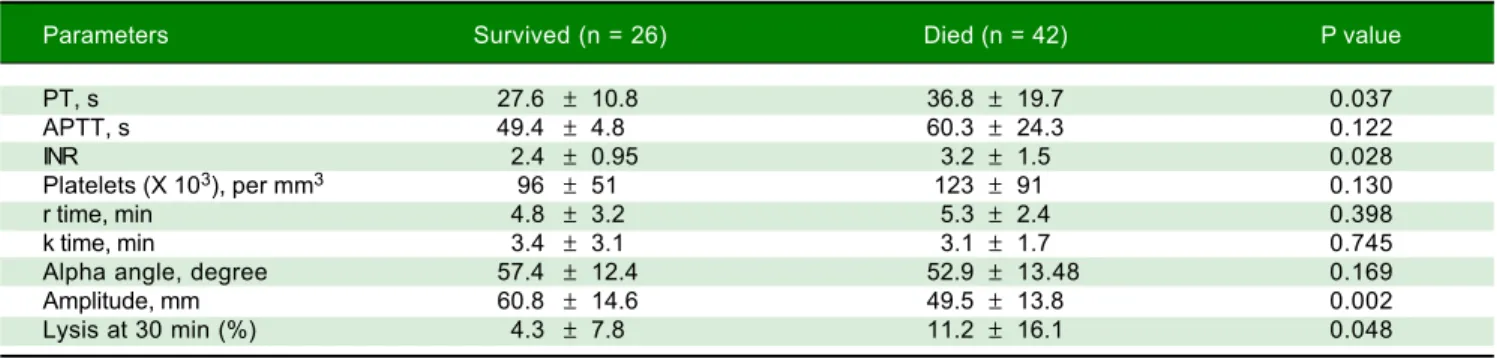
Patients with ACLF were followed till 90 days or until demise. The 30-days and 90-days mortality was 75% and 78%, respectively (Figure 2). Forty-two of 68 ACLF pa-tients (61.8%) died during hospital stay. Significant differ-ences were observed between the survivors and non-survivors in values of INR, MA and LY30 (Table 8). Non-survivors had significantly prolonged INR com-pared to survivors (3.2 ± 1.5 vs. 2.4 ± 0.95, respectively, P = 0.028). Non-survivors also had significantly higher LY30 compared to survivors (11.2 ± 16.1% vs. 4.3 ± 7.8%, respectively, P = 0.048). On the other hand, survivors had significantly higher MA than non-survivors (60.8 ± 14.6 vs.
49.5 ± 13.8, respectively, P = 0.002).
Table 8. Comparison of conventional coagulation tests and TEG parameters in acute on chronic liver failure patients who survived and died during hospital stay.
Parameters Survived (n = 26) Died (n = 42) P value
PT, s 27.6 ± 10.8 36.8 ± 19.7 0.037
APTT, s 49.4 ± 4.8 60.3 ± 24.3 0.122
INR 2.4 ± 0.95 3.2 ± 1.5 0.028
Platelets (X 103), per mm3 96 ± 51 123 ± 91 0.130
r time, min 4.8 ± 3.2 5.3 ± 2.4 0.398
k time, min 3.4 ± 3.1 3.1 ± 1.7 0.745
Alpha angle, degree 57.4 ± 12.4 52.9 ± 13.48 0.169
Amplitude, mm 60.8 ± 14.6 49.5 ± 13.8 0.002
Lysis at 30 min (%) 4.3 ± 7.8 11.2 ± 16.1 0.048
All values are expressed as mean ± SD. PT: prothrombin time. APTT: activated partial thromboplastin time. INR: international normalized ratio.
Figure 2. Figure 2. Figure 2. Figure 2.
Figure 2. Overall Survival of ACLF patients (n = 68).
DISCUSSION
In this large study, we observed that the TEG parame-ter of maximum amplitude was significantly abnormal in ACLF patients. In cases of co-existing AKI with ACLF, r-time was observed to be significantly altered. There were no differences in r-time, k-time, or alpha angle between ACLF, AD patients and healthy subjects. The TEG param-eters were similar among patients with different grades of ACLF.
Among the CCTs, PT/INR and aPTT were significant-ly prolonged in patients with ACLF (Table 1). Hemostasis in chronic liver disease is characterized by re-calibration of the equilibrium between pro- and anti-coagulant fac-tors, as production of both is affected. Recent studies have reported no differences in thrombin production in pres-ence of thrombomodulin in ACLF patients as compared to healthy controls.19,20 The underlying anti-coagulant al-terations in cirrhosis include quantitative and functional defects in platelets, decreased factor production, dys-fi-brinogenemia and elevated t-PA, among others. The levels of von Willebrand factor (vWF) and factor VIII are in-creased,21 whereas all other procoagulant and anticoagulant factors are reduced.22,23 Though there exists a restored bal-ance, it is fragile due to an inherent lack of compensatory reserve to preserve this balance in circumstances of stress e.g. ACLF.19
There is a need to assess the global hemostasis in such circumstances, which can be achieved by viscoelastic tests like TEG, as these are more comprehensive than the CCTs. TEG is now widely used prior to cardiac surgery and liver transplant surgery to assess for coagulation defects.24,25 Recent literature suggests that it has a role in guiding blood product transfusions in cirrhosis patients prior to therapeutic procedures.26 This strategy is associated with significantly lesser number of blood product transfusions as compared 100
90
80
70
60
50
40
30
20
Survival probability (%)
0 30 60 90
Time in days
Number at risk
to patients who receive transfusions as guided by CCTs (transfusions guided by INR and platelet count). This sug-gests that TEG parameters may assess the overall coagula-tion in ACLF better than the CCTs.
We found abnormal TEG parameters- in the form of low amplitude (MA) and increased LY30- in patients with ACLF as compared with healthy controls (Table 3). These findings suggest that the clot strength is less and fibrinoly-sis is increased in patients with ACLF. Similar observa-tions were made by Pietri, et al. in cirrhotics undergoing liver transplantation.27 Studies assessing serial TEG meas-urements have also reported hypocoagulability to be asso-ciated with early rebleeding in cirrhotic patients.28 In our study, among patients with AKI at presentation, there was an increase in r time, whereas there were no other abnor-malities in CCTs and other TEG parameters. Renal fail-ure has been shown to alter hemostasis. Our findings are corroborated by another study comparing 70 end stage re-nal disease (ESRD) patients with normal patients: except for significant increase in r time (reflecting rate of fibrin formation) in ESRD, normal CCTs and TEG parameters were found.29
We did not observe any differences in TEG parameters between ACLF patients with and without sepsis. These findings are in contrast to those reported previously in cirrhosis patients with infection. Papatheodoridis, et al.
reported derangement in all TEG parameters after onset of infection, and parameters returned to normal ranges after resolution of infection.30 We did not measure serial TEG parameters in our study, so we cannot extrapolate our results to this situation.
Overall survival was poor- 78% of our ACLF patients died within 90 days. The reasons for such high mortality included the fact that 75% of patients were grade 2 or 3 ACLF, which are associated with high mortality.1,17 Although MA was not significantly different between the patients with various grade of ACLF, there was a trend towards gradual reduction with increasing grades (Table 4). MA is affected by platelet count which is frequent in patients with CLD and portal hypertension.7 INR and LY30 were higher and MA was lower in non-survivors as compared to survivors. There were no differences in r-time, k-r-time, or alpha angle among survivors and non-survivors. Moreover, patients with ACLF are at risk of bleeding or disseminated intravascular coagulation; whether these complications can be predicted by TEG parameters cannot be answered from the present study: future studies with sequential assessment of TEG param-eters are needed. Recent data suggests that TEG can be used as a guide to transfuse blood products prior to inva-sive procedures in cirrhosis.26 Our data suggests that
most ACLF patients have normal TEG parameters, with no differences in parameters across various ACLF grades. Our interpretations about clot strength are based on the thromboelastography reports only, in absence of any gold standard tests. Future clinical trials are needed to define the utility of TEG in guiding blood product transfusion in ACLF patients.
The unique aspects of our study are inclusion of a large number of ACLF patients, its comparison with AD and healthy controls and analysis of coagulation derange-ments in patients with and without OF using TEG. Lim-itations include non-estimation of coagulation factors, proteins C and S, antithrombin III and fibrin degradation products, so we are unable to assess the exact roles of these factors in coagulation dysfunction in ACLF pa-tients. Fibrinogen and platelets both contribute to the clot strength. We did not assess fibrinogen levels, thus cannot comment on the interplay between fibrinogen and platelets in assessment of clot strength. Also, the study was cross sectional and we did not assess serial TEG pa-rameters to assess its predictive value in development of complications.
In conclusion, TEG parameters in ACLF patients are essentially normal, except reduced maximum amplitude. Future studies are needed to explore the utility of TEG in clinical management of ACLF patients.
ABBREVIATIONS
• AASLD: American Association for the Study of Liver Diseases.
• ACLF: acute on chronic liver failure. • aPTT: activated partial thromboplastin time. • CCTs: conventional coagulation tests. • CLD: chronic liver disease.
• CTP: Child-Turcotte-Pugh.
• EASL: European Association for the Study of the Liver. • INR: International normalized ratio.
• OF: organ failure. • PT: prothrombin time. • TEG: thromboelastography.
CONFLICT OF INTEREST
The authors declares that there is no conflict of interest regarding the publication of this article.
CONFIRMATION
ACKNOWLEDGEMENTS
Mr. Amar Negi for maintenance of Acute on Chronic Liver Failure data base.
REFERENCES
1. Moreau R, Jalan R, Gines P, Pavesi M, Angeli P, Cordoba J, Durand F, et al. Acute-on-chronic liver failure is a distinct syndrome that develops in patients with acute decompensa-tion of cirrhosis. Gastroenterology 2013; 144: 1426-37. 2. Shalimar, Kumar D, Vadiraja PK, Nayak B, Thakur B, Das P,
Datta Gupta S,et al. Acute on chronic liver failure because of acute hepatic insults: Etiologies, course, extrahepatic or-gan failure and predictors of mortality. J Gastroenterol Hepatol 2016; 31: 856-4.
3. Shi Y, Yang Y, Hu Y, Wu W, Yang Q, Zheng M, Zhang S,et al. Acute-on-chronic liver failure precipitated by hepatic inju-ry is distinct from that precipitated by extrahepatic insults.
Hepatology 2015; 62: 232-42.
4. Shalimar, Saraswat V, Singh SP, Duseja A, Shukla A, Eapen CE, Kumar D, et al. Acute-on-chronic liver failure in India: The Indian National Association for Study of the Liver con-sortium experience. J Gastroenterol Hepatol 2016; 31:
1742-9.
5. Tripodi A, Salerno F, Chantarangkul V, Clerici M, Cazzan-iga M, Primignani M, Mannuccio Mannucci P, et al. Evi-dence of normal thrombin generation in cirrhosis despite abnormal conventional coagulation tests. Hepatology
2005; 41: 553-8.
6. Søgaard KK, Horváth-Puhó E, Grønbaek H, Jepsen P, Vilstrup H, Sørensen HT. Risk of venous thromboembolism in patients with liver disease: a nationwide population-based case-control study. Am J Gastroenterol 2009; 104:
96-101.
7. Tripodi A, Primignani M, Chantarangkul V, Viscardi Y, Dell’Era A, Fabris FM, Mannucci PM. The coagulopathy of cirrhosis assessed by thromboelastometry and its correlation with conventional coagulation parameters. Thromb Res 2009; 124: 132-6.
8. Stravitz RT. Potential applications of thromboelastography in patients with acute and chronic liver disease. Gastroenterol Hepatol 2012; 8: 513-20.
9. Stravitz RT, Lisman T, Luketic VA, Sterling RK, Puri P, Fuchs M, Ibrahim A,et al. Minimal effects of acute liver injury/acute liver failure on hemostasis as assessed by thromboelastog-raphy. J Hepatol 2012; 56: 129-36.
10. Shalimar, Kedia S, Gunjan D, Sonika U, Mahapatra SJ, Nayak B, Kaur H,et al. Acute Liver Failure Due to Hepatitis E Virus Infection Is Associated with Better Survival than Other Etiol-ogies in Indian Patients. Dig Dis Sci 2017; 62: 1058-66.
11. Riegler JL, Lake JR. Fulminant hepatic failure. Med Clin North Am 1993; 77: 1057-83.
12. Jalan R, Saliba F, Pavesi M, Amoros A, Moreau R, Ginès P, et al. Development and validation of a prognostic score to pre-dict mortality in patients with acute-on-chronic liver failure. J Hepatol 2014; 61: 1038-47.
13. Malinchoc M, Kamath PS, Gordon FD, Peine CJ, Rank J, ter Borg PC. A model to predict poor survival in patients under-going transjugular intrahepatic portosystemic shunts. Hepa-tology 2000; 31: 864-71.
14. Biggins SW, Kim WR, Terrault NA, Saab S, Balan V, Schiano T, Benson J, et al. Evidence-based incorporation of serum
sodium concentration into MELD. Gastroenterology 2006;
130: 1652-60.
15. Knaus WA, Draper EA, Wagner DP, Zimmerman JE. APACHE II: a severity of disease classification system. Crit Care Med
1985; 13: 818-29.
16. O’Shea RS, Dasarathy S, McCullough AJ, Practice Guideline Committee of the American Association for the Study of Liv-er Diseases, Practice ParametLiv-ers Committee of the AmLiv-eri- Ameri-can College of Gastroenterology. Alcoholic liver disease.
Hepatology 2010; 51: 307-28.
17. Shalimar, Kedia S, Mahapatra SJ, Nayak B, Gunjan D, Thakur B, Acharya SK, et al. Severity and Outcome of Acute-on-Chronic Liver Failure is Dependent on the Etiology of Acute Hepatic Insults: Analysis of 368 Patients. J Clin Gastroen-terol 2017; 51: 734-41.
18. Subramanian A, Albert V, Saxena R, Agrawal D, Pandey RM. Establishing a normal reference range for thromboelas-tography in North Indian healthy volunteers. Indian J Pathol Microbiol 2014; 57: 43-50.
19. Fisher C, Patel VC, Stoy SH, Singanayagam A, Adelmeijer J, Wendon J, Shawcross DL,et al. Balanced haemostasis with both hypo- and hyper-coagulable features in critically ill pa-tients with acute-on-chronic-liver failure. J Crit Care 2018;
43: 54-60.
20. Lisman T, Kleiss S, Patel VC, Fisher C, Adelmeijer J, Bos S, Singanayagam A,et al. In vitro efficacy of pro- and antico-agulant strategies in compensated and acutely ill patients with cirrhosis. Liver Int 2018. doi:10.1111/liv.13882 [Epub ahead of print].
21. Lisman T, Bongers TN, Adelmeijer J, Janssen HLA, de Maat MPM, de Groot PG, Leebeek FW,et al. Elevated levels of von Willebrand Factor in cirrhosis support platelet adhesion despite reduced functional capacity. Hepatology 2006; 44: 53-61.
22. Tripodi A, Primignani M, Chantarangkul V, Dell’Era A, Clerici M, de Franchis R, Colombo M,et al. An imbalance of pro- vs anti-coagulation factors in plasma from patients with cirrho-sis. Gastroenterology 2009; 137: 2105-11.
23. Muciño-Bermejo J, Carrillo-Esper R, Uribe M, Méndez-Sánchez N. Coagulation abnormalities in the cirrhotic patient.
Ann Hepatol 2013; 12: 713-24.
24. Royston D, von Kier S. Reduced haemostatic factor transfu-sion using heparinase-modified thrombelastography during cardiopulmonary bypass. Br J Anaesth 2001; 86: 575-8. 25. Wang S-C, Shieh J-F, Chang K-Y, Chu Y-C, Liu C-S, Loong
C-C, Chan KH,et al. Thromboelastography-guided transfu-sion decreases intraoperative blood transfutransfu-sion during or-thotopic liver transplantation: randomized clinical trial.
Transplant Proc 2010; 42: 2590-3.
26. De Pietri L, Bianchini M, Montalti R, De Maria N, Di Maira T, Begliomini B, Gerunda GE,et al. Thrombelastography-guided blood product use before invasive procedures in cirrhosis with severe coagulopathy: A randomized, controlled trial.
Hepatology 2016; 63: 566-73.
27. De Pietri L, Bianchini M, Rompianesi G, Bertellini E, Begliomini B. Thromboelastographic reference ranges for a cirrhotic patient population undergoing liver transplantation. World J Transplant 2016; 6: 583-93.
28. Chau TN, Chan YW, Patch D, Tokunaga S, Greenslade L, Burroughs AK. Thrombelastographic changes and early re-bleeding in cirrhotic patients with variceal re-bleeding. Gut
1998; 43: 267-71.
as-sessed by thromboelastography in patients with end-stage renal disease. Thromb Haemost 2011; 106: 67-74.
30. Papatheodoridis GV, Patch D, Webster GJ, Brooker J, Barnes E, Burroughs AK. Infection and hemostasis in de-compensated cirrhosis: a prospective study using thrombel-astography. Hepatology 1999; 29: 1085-90.
Correspondence and reprint request: Shalimar, M.D., D.M.
Room Number 127, First Floor, Human Nutrition Unit, Department of Gastroenterology, All India Institute of Medical