Granulocyte-colony stimulating factor
prevents the development of hepatic steatosis in rats
Yi-Sun Song*,|| Hyun-Woo Joo,*,|| In-Hwa Park,* Guang-Yin Shen,† Yonggu Lee,†,§Jeong Hun Shin,† Hyuck Kim,‡ Kyung-Soo Kim*,†
* Graduate School of Biomedical Science and Engineering, Hanyang University, Seoul, South Korea. † Department of Internal Medicine, Hanyang University College of Medicine, Seoul, South Korea. ‡ Department of Thoracic and Cardiovascular Surgery, Hanyang University College of Medicine, Seoul, South Korea.
§ Department of Cardiology, Sung-Ae Hospital, Seoul, South Korea. || Yi-Sun Song and Hyun-Woo Joo contributed equally to this work.
ABSTRACT
Background and aims. Previously, we reported that granulocyte-colony stimulating factor (G-CSF) improves hepatic steatosis in experimental animals. It may also have preventive effects on the development of hepa-tic steatosis. Therefore, we investigated the preventive effects of G-CSF by using a high-fat diet (HFD) rat
model. Materials and methods. Twelve rats were fed HFD and 6 rats were fed control diet from 10 weeks
of age. Once little steatosis was confirmed in the liver (after 10 weeks of feeding the HFD; at 20 weeks of
age), HFD rats were randomly divided into two groups and treated with either G-CSF (100 μg kg-1 day-1 for 5
consecutive days every other week; HFD/G-CSF rats) or saline (HFD/saline rats) for 10 weeks at 20 weeks of age. All rats were sacrificed at 30 weeks of age. Histology was examined by hematoxylin and eosin (H-E) and
Oil Red O staining, and the expression levels of genes of associated with lipogenesis and β-oxidation
enzy-mes were determined by qRT-PCR. Results. Histological examinations revealed that HFD/G-CSF rats had
sig-nificantly lower lipid accumulation in their hepatocytes than did HFD/saline rats (p < 0.05). HFD/G-CSF rats also showed lower expression levels of genes associated with lipogenesis and higher expression levels of
genes associated with β-oxidation than HFD/saline rats (p < 0.05). Conclusion. In conclusion, we found that
G-CSF prevented development of hepatic steatosis in an HFD rat model. The preventive effect may be
asso-ciated with the regulation of gene expression involved in hepatic lipogenesis and β-oxidation.
Key words. High-fat diet. Lipogenesis. β-oxidation.
Correspondence and reprint request: Kyung-Soo Kim, M.D., Ph.D.
Department of Internal Medicine, Hanyang University College of Medicine, 17 Haengdang-dong, Sungdong-ku, Seoul, 133-792,
South Korea.
Tel.: +82-2-2290-8312. Fax: +82-2-2298-9183 E-mail: [email protected]
Manuscript received: August 18, 2014. Manuscript accepted: September 04, 2014.
INTRODUCTION
Non-alcoholic fatty liver disease is the most com-mon cause of chronic liver disease and is frequently associated with metabolic syndrome components such as obesity, diabetes mellitus, and insulin re-sistance.1,2 Hepatic steatosis, an early stage of non-alcoholic fatty liver disease, involves accumulation of fat in the liver in the absence of significant alco-hol consumption.3 Hepatic steatosis develops as a result of triglyceride synthesis owing to an increase
in free fatty acid (FFA) uptake and de novo lipogen-esis, and an imbalance between oxidation and anti-oxidation in the liver.4
Granulocyte-colony stimulating factor (G-CSF) is widely used to mobilize the release of bone marrow-derived stem cells into peripheral circulation.5 In many recent animal studies, G-CSF has been shown to be an effective treatment for a variety of liver dis-eases including hepatic steatosis,6 steatohepatitis,7 and fibrosis.8 Recently, we reported that G-CSF amel-iorates hepatic steatosis in the Otsuka Long-Evans Tokushima fatty rat model, and reduces the expres-sion of hepatic lipogenic genes such as sterol regula-tory element-binding protein (SREBP)-1c, and that of encoding enzymes such as fatty acid synthase (FAS) and acetyl-CoA carboxylase (ACC).6 We hypothesized that G-CSF might also prevent the development of hepatic steatosis in experimental animals.
he-blood were measured at 2-week intervals between 10 and 30 weeks of age. The animals were sacrificed under anesthesia at 30 weeks of age, and liver tis-sues were collected.
Biochemical analysis
Blood samples were collected from the tail vein af-ter 8 h of fasting. Serum was obtained by centrifuga-tion and stored at -70 oC. Serum glucose, total cholesterol, triglyceride, alanine aminotransferase (ALT), aspartate aminotransferase (AST) and FFA were measured with an Olympus AU400 auto ana-lyzer (Olympus GmbH, Hamburg, Germany).10 Insu-lin resistance was estimated by homeostasis model assessment of insulin resistance (HOMA-IR) by us-ing the followus-ing formula:11
Histological examination
To examine morphology, livers were fixed with a 10% formalin solution, embedded in paraffin and cut into 4 μm thick sections for hematoxylin and eosin (H-E) staining. Accumulation of hepatic steatosis was determined by Oil Red O staining.12 For Oil Red O staining, livers were snap-frozen, embedded in op-timum cutting temperature, and sectioned on a cryo-stat microtome (4 μm thick). Slides were rinsed briefly in 60% isopropanol, incubated for 15 min in filtered Oil Red O solution, rinsed again in 60% iso-propanol, and counterstained with Mayer’s hema-toxylin for 1 min.13 Five fields in each slide were selected at random from the individual sections. The Oil Red O-positive area was calculated using Image-Pro Plus software (Media Cybernetics, Silver Spring, MD, USA). Hepatic steatosis was calculated
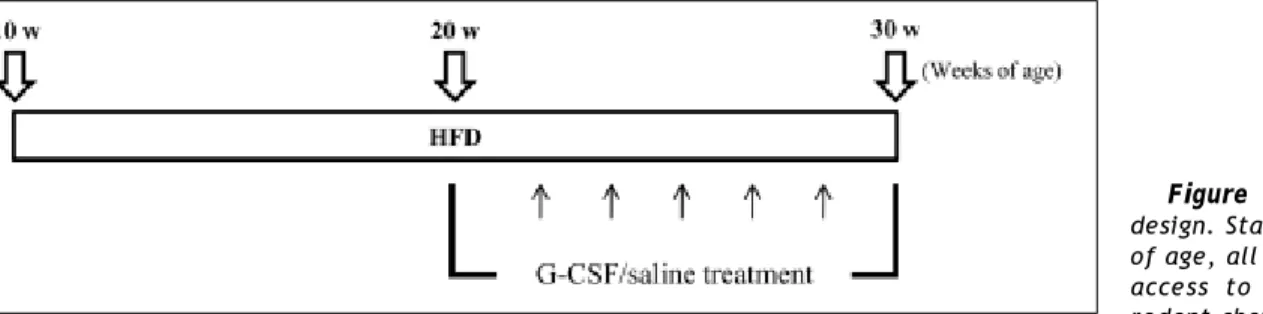
Figure 1. Experimental design. Starting at 10 weeks of age, all animals had free access to either standard rodent chow (SD; n = 6) or a high-fat diet (HFD; n = 12) for 20 weeks. HFD rats were given either saline (HFD/saline; n = 6) or G-CSF (HFD/G-CSF; n = 6) intra-peritoneally on 5 consecutive days every other week between 20 and 30 weeks of age.
patic steatosis rat model and explored potential mechanisms underlying the beneficial effects. Specif-ically, we examined the expression of various hepat-ic lipogenhepat-ic and β-oxidative genes and the presence of G-CSF receptor (G-CSFR) in liver tissues.
MATERIAL AND METHODS
Animals
Male Sprague-Dawley rats (Koatech, Kyungki-do, South Korea), 6 weeks of age and weighing 150-200 g, were used in this experiment. All the rats were housed under conditions of controlled temperature (23 ± 2 °C) and humidity (55 ± 5%) with a 12-h ar-tificial light/dark cycle in the specific pathogen-free facility of the Hanyang University Medical School Animal Experiment Center. These experiments were performed in compliance with the ARRIVE guide-lines for research,9 and were approved by the Han-yang University Institutional Animal Care and Use Committee.
Animal model and experimental design
The experimental protocol is outlined schemati-cally in figure 1. Starting at 10 weeks of age, all ani-mals had free access to either standard rodent chow (SD, n = 6) with 5.4% fat content (Lab Rodent Chow; 38057; Purina Korea Inc., Kyungki-do, South Korea) or HFD (n = 12) with 60% fat con-tent (Research Diets; D12492; New Brunswick, NJ, USA) for 20 weeks. The HFD rats were divided ran-domly into two groups and injected with human re-combinant G-CSF (HFD/G-CSF; 100 μg/kg/day; Leucostim, Dong-A Pharmaceutical, Seoul, South Korea; n = 6) or saline (HFD/saline; n = 6) intra-peritoneally on 5 consecutive days every other week between 20 and 30 weeks of age. Body weight and
fasting insulin x fasting plasma (μU/mL) glucose (mmol/L)
as a percentage of the ratio of the area of Oil Red O-stained lipid droplets to the total tissue area.
Quantitative real-time polymerase chain reaction (Q-PCR)
Total RNA was extracted from liver tissue by us-ing Qiazol reagent (Qiagen, Valencia, CA, USA) fol-lowing the manufacturer’s instructions. RNA concentrations were measured with a Nanodrop ND-2000 spectrophotometer (Thermo Fisher Scien-tific Inc., Wilmington, DE, USA), and RNA purity was determined by measuring the ratios of A260 to A280, which ranged from 1.8 to 2.0.
For real-time PCR, complementary DNA (cDNA) synthesized from 3 μg of RNA was reverse-tran-scribed with Moloney murine leukemia virus re-verse transcriptase (Invitrogen Co., Carlsbad, CA, USA). mRNA expression was quantified using a Light Cycler® 480 System (Roche, Basel, Switzer-land) with a FastStart DNA Master SYBR Green I kit (Roche Diagnostics, Indianapolis, IN, USA). The genes were selected SREBP-1c, FAS, liver X receptor (LXR), ACC, AMP-activated protein kinase (AMPK)-1α, and peroxisome proliferator-activated receptor (PPAR)-γ. The primers used in the analyses are shown in table 1. The following experimental run protocol was used: incubation for 10 min at 95 °C followed by 45 cycles of 10 s at 95 °C, 10 s at 60 °C, and 8 s at 72 °C and a final dissociation step at 65 °C
for 15 s. The crossing point (Cp) of each PCR was automatically determined by the Light Cycler® pro-gram. All samples were run in duplicate. A relative change ratio was determined using the ratio of the mRNA for the selected gene to that of glyceralde-hyde-3-phosphate dehydrogenase (GAPDH).
Western blotting for G-CSFR
Liver samples were homogenized with protein lysis buffer (Pro-prep; iNtRON, Seongnam, South Korea). Samples containing 50 μg proteins were loaded onto SDS-PAGE gels (5% stacking and 10% separating gels) after being boiled for 10 min and transferred to nitrocellulose membranes (0.45 μm pore size, Bio-Rad, Hercules, CA, USA). After block-ing in 5% skim milk solution for 60 min, the mem-branes were incubated with primary antibodies against G-CSFR (1:500; Santa Cruz Biotechnology Inc., Santa Cruz, CA, USA) or GADPH (1:2,000; Cell Signaling Technology, Boston, MA, USA) over-night at 4°C and washed three times (3 x 10 min) with TBST. The membranes were then incubated with HRP-conjugated anti-rabbit antibody (1:2,000; Jackson Immunoresearch, West Grove, PA, USA) for 1 h at room temperature. GAPDH was used as a protein loading control. Positive protein bands were visualized using an ECL kit (GenDEPOT, Barker, TX, USA), and the results were quantified with an image analyzer (Image lab 3.0, Bio-Rad).
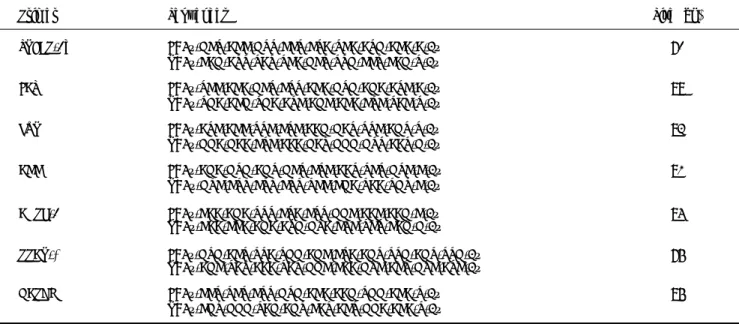
Table 1. Sequences of primers.
Primer Sequences Size (bp)
SREBP-1c F: 5´-GCT-ACC-GTT-CCT-CTA-TCA-ATG-ACA-A-3´ 81 R: 5´-CAG-ATT-TAT-TCA-GCT-TTG-CCT-CAG-T-3´
FAS F: 5´-TCC-ACA-GCT-CTT-ACA-GTG-AGA-ATC-A-3´ 99 R: 5´-TGA-ACG-TGA-ATC-AGC-ACA-CTC-TAC-T-3´
LXR F: 5´-ATC-ACC-TTC-CTC-AAG-GAT-TTC-AGT-T-3´ 93 R: 5´-GGA-GAA-CTC-AAA-GAT-GGG-GTT-AAT-G-3´
ACC F: 5´-AGA-GTG-AGT-GCT-CTC-AAT-TCT-GTC-C-3´ 92 R: 5´-GTC-CTT-CTT-CTT-TCC-CGA-TAA-TGT-C-3´
AMPK-1α F: 5´-CAA-AGA-TTT-CTA-CTT-GGC-AAC-AAG-C-3´ 95 R: 5´-CAA-CCA-AGA-ATG-GTA-CTC-TCT-CAG-G-3´
PPAR-γ F: 5´-GTG-ACT-TTA-TGG-AGC-CTA-AGT-TTG-AGT-TTG-3´ 86 R: 5´-AGC-TAT-AAA-TAT-GGC-CAA-GTC-ACT-GTC-ATC-3´
GAPDH F: 5´-CCT-TCT-CTT-GTG-ACA-AAG-TGG-ACA-T-3´ 96 R: 5´-CGT-GGG-TAG-AGT-CAT-ACT-GGA-ACA-T-3´
Statistical analysis
Data are expressed as mean ± standard deviation (SD), except for histological data which are ex-pressed as mean ± standard error of the mean (SE). Comparisons between groups were made using one-way analysis of variance (ANOVA) followed by a
post hoc Tukey’s test. Data were analyzed using Stu-dent’s t-tests (for single comparisons) or one-way ANOVA (for multiple comparisons), and post hoc multiple comparisons were made with the Tukey’s test (equal variances assumed). Values of p < 0.05 were considered statistically significant. All statisti-cal analyses were performed using SPSS statistics 21.0 for Windows (IBM, New York, USA).
RESULTS
Body weight and biochemical analysis
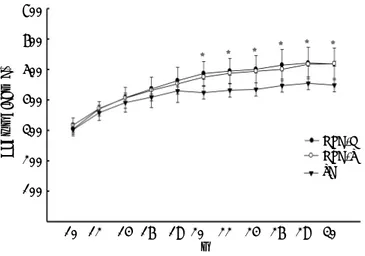
Body weight increased during the 30 weeks of the experiment in all groups, but was significantly high-er (p < 0.05) in the HFD groups compared with the SD control group. Body weight did not differ signifi-cantly between the HFD groups (Figure 2). Glucose levels were similar in the HFD/G-CSF and HFD/sa-line groups during the 30 weeks of the experiment (data not shown). At the end of the experiment, to-tal cholesterol was lower in the HFD/G-CSF group compared to that in the HFD/saline group (96.75 ± 11.59 mg/dL vs. 127.50 ± 16.34 mg/dL, p < 0.05), and was equal to that in the SD control group (117.00 ± 4.90 mg/dL). HOMA-IR was lower in the HFD/G-CSF group than in the HFD/saline group (1.28 ± 0.15 vs. 1.69 ± 0.19, p < 0.05), and was equal to that in the SD control group (1.50 ± 0.05). FFA was lower in the HFD/G-CSF group compared to that in the HFD/saline group (635.00 ± 56.85 μEq/L vs. 757.80 ± 76.39 μEq/L, p < 0.05), and was
equal to that in the SD control group (568.00 ± 60.75 μEq/L). Finally, triglyceride, AST, and ALT levels were similar in the three groups (Table 2).
Histology
All histological data were evaluated by an inde-pendent blinded investigator. The development of he-patic steatosis was confirmed by H-E and Oil Red O staining. Mild steatosis was evident in liver hepato-cytes after 10 weeks on the HFD. At the end of the experiment, severe micro- and macrovesicular stea-tosis and hepatocyte ballooning were evident in the livers of the HFD/saline group after treatment, whereas fibrosis, collagen deposition, and inflamma-tory cell infiltration were still not evident. In con-trast, fat accumulation was lower in the livers of the HFD/G-CSF group, which were no different from those of the SD control group (Figure 3A). The area of lipid droplets, as visualized by Oil Red O staining,
Figure 2. Changes in body weight over time. SD, standard diet; HFD-G, high-fat diet treated with G-CSF; HFD-S, high-fat diet treated with saline. All data are expressed as mean ± SD. * p < 0.05 vs. SD control group.
Table 2. Biochemical analysis.
SD HFD-G HFD-S
Glucose (mg/dL) 108.50 ± 5.89 117.67 ± 8.02 119.00 ±3.94* Total cholesterol (mg/dL) 117.00 ± 4.90 96.75 ± 11.59† 127.50 ±16.34
Triglycerides (mg/dL) 13.50 ± 2.52 12.60 ± 2.51 15.75±2.87 AST (U/L) 83.50 ± 12.06 123.50 ± 19.20 127.80 ±12.11 ALT (U/L) 72.75 ± 8.96 63.60 ± 3.91 75.00±7.75 FFA (uEq/L) 568.00 ± 60.75 635.00 ± 56.85† 757.80 ±76.39*
HOMA-IR 1.50 ± 0.05 1.28 ± 0.15† 1.69±0.19
AST: aspartate aminotransferase. ALT: alanine aminotransferase. FFA: free fatty acid. HOMA-IR: homeostasis model assessment of insulin resistance. HOMA-IR = fasting insulin (μU/mL) x fasting plasma glucose (mmoL/L)/22.5. SD: standard diet. HFD-G: high-fat diet treated with G-CSF. HFD-S: high-fat diet treated with saline. All data are expressed as mean ± SD. * p < 0.05 vs. SD control rat. † p < 0.05 vs. HFD-S group (n = 4-6).
Body weight (g)
700
600
500
400
300
200
100
10 12 14 16 18 20 22 24 26 28 30 w
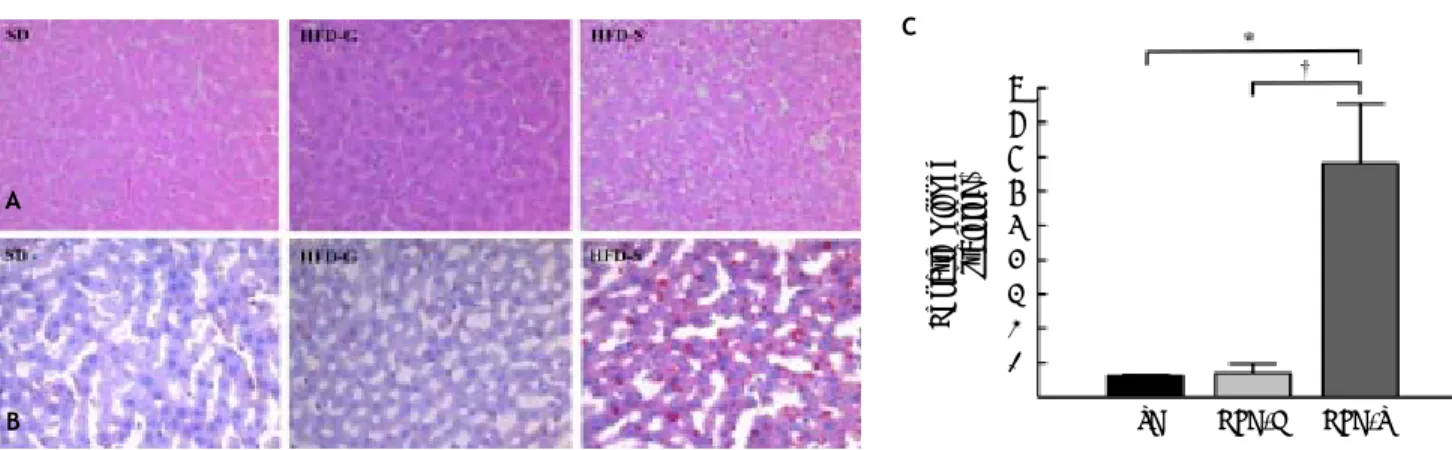
Figure 3. Histological changes in liver tissue. A. Stained with hematoxylin and eosin (H-E). B. Stained with Oil Red O (magnifi-cation x 200). In Oil Red O-stained sections, red vesicles indicate lipid droplets. The mean percent area occupied by Oil Red O-stained lipid droplets was calculated for five randomly selected fields of each liver section. SD: standard diet. HFD-G: high-fat diet treated with G-CSF. HFD-S: high-fat diet treated with saline. All data are expressed as mean ± SE. * p < 0.05 vs. SD control group. † p < 0.05 vs. HFD-S group.
Figure 4. Expression of genes related to lipogenesis and β-oxidation. Levels of sterol regulatory element-binding protein (SREBP)-1c (A), fatty acid synthase (FAS) (B), liver X receptor (LXR) (C), acetyl-CoA carboxylase (ACC) (D), AMP-activated pro-tein kinase (AMPK)-1α (E), and peroxisome proliferator-activated receptor (PPAR)-γ (F) mRNA in the liver were measured by real-time PCR. Mean values from the livers of four separate animals are shown. PCR was performed in duplicate. The transcript levels were normalized by comparison with GAPDH expression. SD: standard diet. HFD-G: high-fat diet treated with G-CSF. HFD-S: high-fat diet treated with saline. All data are expressed as mean ± SE. * p < 0.05 vs. SD control group. † p < 0.05 vs. HFD-S group.
was significantly lower in the HFD/G-CSF group compared to that in the HFD/saline group (0.70 ± 0.28% vs. 6.81 ± 1.74%, p < 0.01) and did not sig-nificantly differ from that in the SD control group (0.62 ± 0.04%) (Figure 3B and 3C).
Expression of lipogenesis and ββββ-oxidation genes
SREBP-1c, FAS, LXR, ACC, AMPK-1α, and PPAR-γ mRNA levels in the liver were measured us-ing real-time PCR. The level of SREBP-1c mRNA
A
B
SREBP mRNA level (%)
5
4
3
2
1
SD HFD-G HFD-S
FAS mRNA level (%)
5
4
3
2
1
SD HFD-G HFD-S
LXR mRNA level (%)
5
4
3
2
1
SD HFD-G HFD-S
ACC mRNA level (%)
2.0
1.5
1.0
0.5
SD HFD-G HFD-S
AMPK 1
α
mRNA level (%)
3.0 2.5 2.0 1.5 1.0 0.5
SD HFD-G HFD-S
PPAR
γ
mRNA level (%)
3.0
2.5 2.0 1.5
1.0 0.5
SD HFD-G HFD-S
A B C
D E F
Hepatic Oil Red (% staining)
9 8 7 6 5 4 3 2 1
was significantly lower in the HFD/G-CSF group compared to that in the HFD/saline group (117.87 ± 52.09% vs. 324.76 ± 76.47%, p < 0.05), and was equal to that in the SD control group (100.00 ± 55.40%) (Figure 4A). The level of FAS mRNA was significantly lower in the HFD/G-CSF group than in the HFD/saline group (185.73 ± 50.20% vs. 404.21 ± 164.59%, p < 0.05), and was equal to that in the SD control group (100.00 ± 54.21%) (Figure 4B). The level of LXR mRNA was significantly lower in the HFD/G-CSF group compared to that in the HFD/saline group (157.00 ± 31.02% vs. 310.26 ± 103.16%, p < 0.05), and was equal to that in the SD control group (100.00 ± 18.10%) (Figure 4C). No significant differences in the level of ACC mRNA were observed between the HFD/G-CSF and HFD/ saline groups (Figure 4D). The level of AMPK-1α
mRNA was significantly higher in the HFD/G-CSF group than in the HFD/saline group (145.18 ± 69.42% vs. 45.56 ± 21.13%, p < 0.05), and not significantly different from that in the SD control group (100.00 ± 29.61%) (Figure 4E). The level of PPAR-γ mRNA was significantly higher in the HFD/G-CSF group compared to that in the HFD/sa-line group (175.99 ± 39.20% vs. 72.25 ± 36.64%, p < 0.05), and not significantly different from that in the SD control group (100.00 ± 27.43%) (Figure 4F).
G-CSFR expression in liver tissue
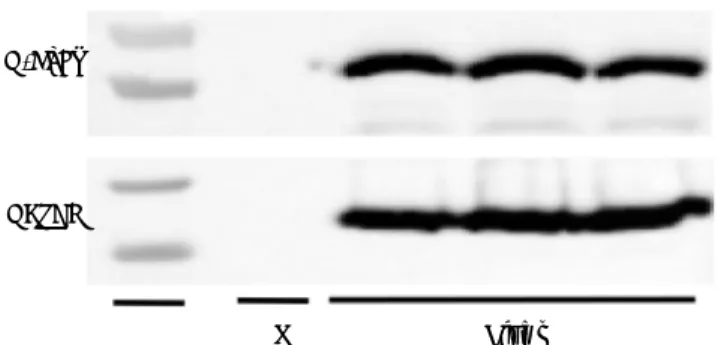
G-CSFR expression in liver tissues was confirmed by the detection of the G-CSFR protein by western blot analysis (Figure 5). Based on these findings, we cannot exclude the possibility that G-CSF directly affects hepatic steatosis via receptor-mediated sign-aling.
DISCUSSION
We showed that G-CSF treatment prevented the development of hepatic steatosis induced by HFD in our rat model. Moreover, G-CSF decreased expres-sion of hepatic lipogenic genes such as SREBP-1c, FAS, and LXR, and increased expression of the β -ox-idative genes AMPK-1α and PPAR-γ in the livers of rats.
Previously, we reported that G-CSF ameliorates hepatic steatosis at 4 weeks after only a single round of G-CSF treatment;6 however, the preventive effect of G-CSF in the development of hepatic steato-sis has not been reported. In this study, we showed that G-CSF prevented the development of hepatic st-eatosis by continuously administering G-CSF to model rats before they developed steatosis. Histolog-ically, we confirmed that G-CSF treatment prevents the development of macrovesicular steatosis and hepatocyte ballooning associated with steatosis, without any body weight reduction.
We used an HFD-induced hepatic steatosis rat model. Hepatic steatosis studies have used various mutant animal models, including db/db14 and ob/ob mice,15 and Otsuka Long-Evans Tokushima fatty rats.12 The HFD-induced hepatic steatosis rat model closely follows the progression pattern observed in obese humans.16 In addition, HFD can induce insu-lin resistance as well as hepatic steatosis.17
In the liver, insulin resistance stimulates the up-regulation of lipogenic genes, resulting in increased FFAs. FFAs can either be oxidized in the mitochon-dria to form ATP or esterified to produce triglycer-ides.18 Imbalances between FFA synthesis and oxidation result in hepatic steatosis.19 We previously speculated that reduced expression of lipogenic genes such as SREBP-1c, FAS, and ACC is associat-ed with a therapeutic effect of G-CSF on hepatic steatosis.6 In this study, we confirmed an increase in β-oxidative gene expression as well as a reduction in lipogenic gene expression in response to G-CSF treatment.
Higher HFD-induced oxidative stress activates SREBP-1c, which plays a key role in hepatic steato-sis development.20 In addition, SREBP-1c activation increases FAS and ACC expression and leads to in-sulin resistance.20 LXR regulates lipogenic genes including SREBP-1c, FAS, and ACC, leading to de novo lipogenesis.21 Activation of AMPK suppresses SREBP-1c and ACC expression, leading to increases in mitochondrial fatty acid oxidation in the liv-er.22,23 Activation of PPAR-γ increases AMPK ex-pression. In addition, previous studies have
Figure 5. Expression of G-CSF receptor (G-CSFR) in liver tissue. Levels of G-CSFR protein in the liver were detected by western blot. GAPDH was used as a loading control. A no-template negative control is also shown (N). M: marker.
M N Liver
G-CSFR
demonstrated that PPAR-γ, activated by rosiglita-zone, ameliorates hepatic steatosis and increases fat-ty acid oxidation.24,25 In this study, G-CSF led to inactivation of lipogenic genes and activation of mi-tochondrial fatty acid oxidative genes in the hepatic steatosis rat model.
We observed reduced circulating FFA and insulin resistance. A reduction in circulating FFA reduces the input of FFA to hepatocytes. Because insulin in the liver accelerates FFA synthesis, improvement of insulin resistance leads to a reduction in hepatic steatosis.26 In addition, LXR and SREBP-1c reduc-tions are associated with improvements in insulin resistance.27,28 A previous study showed that the ab-sence of SREBP-1 improves insulin resistance in mice.29 In our study, G-CSF improved insulin resist-ance and reduced LXR and SREBP-1c expression. In addition, SREBP-1c inactivation by AMPK amelio-rates insulin resistance and hepatic steatosis.30 In our animal model, G-CSF treatment reduced insulin resistance. We speculate that the preventive effect of G-CSF on hepatic steatosis in HFD rats is related to the improvement of insulin resistance and reduction of LXR and SREBP-1c expression.
Previous studies suggest several possible mecha-nisms underlying the general effect of G-CSF on liv-er diseases. Jin, et al.8 reported that the therapeutic effect of G-CSF in an acute hepatic injury mouse model is most likely due to mobilization of bone mar-row mononuclear cells. Moreover, bone marmar-row-de- marrow-de-rived cells mobilized by G-CSF contribute to liver regeneration.31 In addition, Ji, et al.32 reported that G-CSF may act on liver cells through G-CSFR. In our study, G-CSFR was found in rat liver tissue. Thus, G-CSF may have a direct protective effect on hepatic steatosis by signaling via G-CSFR. Further studies are required to clarify whether G-CSF acts directly on hepatic steatosis as well as to explore the possibility of both receptor- and non-receptor-mediated mechanisms.
This study had several limitations. First, eluci-dating the major mechanisms underlying the pre-ventive effect of G-CSF on hepatic steatosis will require further investigation into the bone marrow-dependent effects of CSF. Second, the optimal G-CSF treatment including dose, timing, frequency, and duration remains to be established for clinical application. Third, we did not analyze the elevated GGT level, which is characteristic of NAFLD.33 It is necessary to clarify hepatic steatosis in future stud-ies. Finally, the number of animals examined in this study was low. Further studies should involve a larger number of animals.
In summary, G-CSF prevented the development of hepatic steatosis and induced down-regulation of he-patic lipogenic genes and up-regulation of β-oxidative genes. We speculate that the preventive effect of G-CSF on hepatic steatosis is related to the control of lipogenic and β-oxidative gene expression. In addition, we previously confirmed the therapeutic effect of G-CSF on hepatic steatosis.6 Evidence supporting the preventive and therapeutic effects of G-CSF on hepatic steatosis points to an important new clinical approach for the treatment of hepatic steatosis with G-CSF, which merits examination in human clinical trials.
ABBREVIATIONS
• ACC: acetyl-CoA carboxylase.
• ALT: alanine aminotransferase.
• AMPK: AMP-activated protein kinase.
• AST: aspartate aminotransferase.
• FAS: fatty acid synthase.
• FFA: free fatty acid.
• GAPDH: glyceraldehydes-3-phosphate
dehydro-genase.
• G-CSF: granulocyte-colony stimulating factor.
• G-CSFR: granulocyte-colony stimulating factor
receptor.
• GGT: gamma-glutamyl transferase.
• HFD: high-fat diet.
• HOMA-IR: homeostasis model assessment of
in-sulin resistance.
• LXR: liver X receptor.
• PPAR: peroxisome proliferator-activated
recep-tor.
• SREBP: strerol regulatory element-binding
pro-tein.
REFERENCES
1. Lewis JR, Mohanty SR. Nonalcoholic fatty liver disease: a review and update. Dig Dis Sci 2010; 55: 560-78.
2. Lazo M, Clark JM. The epidemiology of nonalcoholic fatty li-ver disease: a global perspective. Semin Lili-ver Dis 2008; 28: 339-50.
3. Day CP, James OF. Hepatic steatosis: innocent bystander or guilty party? Hepatology 1998; 27: 1463-6.
4. Koo SH. Nonalcoholic fatty liver disease: molecular mecha-nisms for the hepatic steatosis. Clin Mol Hepatol 2013; 19: 210-5.
5. Zohlnhöfer D, Ott I, Mehilli J, Schömig K, Michalk F, Ibrahim T, Meisetschläger G, et al. Stem cell mobilization by granu-locyte colony-stimulating factor in patients with acute myocardial infarction: a randomized controlled trial. JAMA 2006; 295: 1003-10.
7. Spahr L, Lambert JF, Rubbia-Brandt L, Chalandon Y, Fros-sard JL, Giostra E, Hadengue A. Granulocyte-colony stimu-lating factor induces proliferation of hepatic progenitors in alcoholic steatohepatitis: a randomized trial. Hepatolo-gy 2008; 48: 221-9.
8. Jin SZ, Meng XW, Sun X, Han MZ, Liu BR, Wang XH, Sun LY, et al. Granulocyte colony-stimulating factor enhances bone marrow mononuclear cell homing to the liver in a mouse model of acute hepatic injury. Dig Dis Sci 2010; 55: 2805-13.
9. Kilkenny C, Browne WJ, Cuthi I, Emerson M, Altman DG. Improving bioscience research reporting: the ARRIVE gui-delines for reporting animal research. Vet Clin Pathol 2012; 41: 27-31.
10. Fan YM, Raitakari OT, Kahonen M, Hutri-Kahonen N, Juo-nala M, Marniemi J, Viikari J, et al. Hepatic lipase promo-ter C-480T polymorphism is associated with serum lipids levels, but not subclinical atherosclerosis: the Cardio-vascular Risk in Young Finns Study. Clin Genet 2009; 76: 46-53.
11. Matthews DR, Hosker JP, Rudenski AS, Naylor BA, Trea-cher DF, Turner RC. Homeostasis model assessment: insu-lin resistance and beta-cell function from fasting plasma glucose and insulin concentrations in man. Diabetologia 1985; 28: 412-9.
12. Song YS, Fang CH, So BI, Park JY, Lee Y, Shin JH, Jun DW, et al. Time course of the development of nonalcoholic Fatty liver disease in the Otsuka long-evans Tokushima Fatty rat. Gastroenterol Res Pract 2013; 2013: 342648. 13. Grip O, Janciauskiene S, Lindgren S. Pravastatin
down-re-gulates inflammatory mediators in human monocytes in vi-tro. Eur J Pharmacol 2000; 410: 83-92.
14. Choi SS, Diehl AM. Hepatic triglyceride synthesis and no-nalcoholic fatty liver disease. Curr Opin Lipidol 2008; 19: 295-300.
15. Garcia-Ruiz I, Rodriguez-Juan C, Diaz-Sanjuan T, del Hoyo P, Colina F, Munoz-Yague T, Solis-Herruzo JA. Uric acid and anti-TNF antibody improve mitochondrial dysfunction in ob/ob mice. Hepatology 2006; 44: 581-91.
16. Buettner R, Scholmerich J, Bollheimer LC. High-fat diets: modeling the metabolic disorders of human obesity in ro-dents. Obesity 2007; 15: 798-808.
17. Buettner R, Parhofer KG, Woenckhaus M, Wrede CE, Kunz-Schughart LA, Scholmerich J, Bollheimer LC. Defi-ning high-fat-diet rat models: metabolic and molecular effects of different fat types. J Mol Endocrinol 2006; 36: 485-501.
18. Browning JD, Horton JD. Molecular mediators of hepatic steatosis and liver injury. J Clin Invest 2004; 114: 147-52. 19. Postic C, Girard J. The role of the lipogenic pathway in
the development of hepatic steatosis. Diabetes Metab 2008; 34: 643-8.
20. Sozio MS, Liangpunsakul S, Crabb D. The role of lipid meta-bolism in the pathogenesis of alcoholic and nonalcoholic hepatic steatosis. Semin Liver Dis 2010; 30: 378-90.
21. Cha JY, Repa JJ. The liver X receptor (LXR) and hepatic li-pogenesis. The carbohydrate-response element-binding protein is a target gene of LXR. J Biol Chem 2007; 282: 743-51.
22. Viollet B, Foretz M, Guigas B, Horman S, Dentin R, Bertrand L, Hue L, et al. Activation of AMP-activated protein kina-se in the liver: a new strategy for the management of me-tabolic hepatic disorders. J Physiol 2006; 574: 41-53. 23. Zhou G, Myers R, Li Y, Chen Y, Shen X, Fenyk-Melody J,
Wu M, et al. Role of AMP-activated protein kinase in me-chanism of metformin action. J Clin Invest 2001; 108: 1167-74.
24. Yang SJ, Choi JM, Chae SW, Kim WJ, Park SE, Rhee EJ, Lee WY, et al. Activation of peroxisome proliferator-activa-ted receptor gamma by rosiglitazone increases sirt6 ex-pression and ameliorates hepatic steatosis in rats. PLoS One 2011; 6: e17057.
25. Yamauchi T, Kamon J, Minokoshi Y, Ito Y, Waki H, Uchida S, Yamashita S, et al. Adiponectin stimulates glucose utili-zation and fatty-acid oxidation by activating AMP-activa-ted protein kinase. Nat Med 2002; 8: 1288-95.
26. Marchesini G, Brizi M, Morselli-Labate AM, Bianchi G, Bu-gianesi E, McCullough AJ, Forlani G, et al. Association of nonalcoholic fatty liver disease with insulin resistance. Am J Med 1999; 107: 450-5.
27. Shimomura I, Bashmakov Y, Ikemoto S, Horton JD, Brown MS, Goldstein JL. Insulin selectively increases SREBP-1c mRNA in the livers of rats with streptozotocin-induced diabetes. Proc Natl Acad Sci 1999; 96: 13656-61.
28. Laffitte BA, Chao LC, Li J, Walczak R, Hummasti S, Joseph SB, Castrillo A, et al. Activation of liver X receptor impro-ves glucose tolerance through coordinate regulation of glucose metabolism in liver and adipose tissue. Proc Natl Acad Sci 2003; 100: 5419-24.
29. Yahagi N, Shimano H, Hasty AH, Matsuzaka T, Ide T, Yos-hikawa T, Amemiya-Kudo M, et al. Absence of sterol regula-tory element-binding protein-1 (SREBP-1) ameliorates fatty livers but not obesity or insulin resistance in Lep(ob)/Lep(ob) mice. J Biol Chem 2002; 277: 19353-7. 30. Li Y, Xu S, Mihaylova MM, Zheng B, Hou X, Jiang B, Park O,
et al. AMPK phosphorylates and inhibits SREBP activity to attenuate hepatic steatosis and atherosclerosis in diet-in-duced insulin-resistant mice. Cell Metab 2011; 13: 376-88. 31. Gaia S, Smedile A, Omede P, Olivero A, Sanavio F, Balzola F,
Ottobrelli A, et al. Feasibility and safety of G-CSF adminis-tration to induce bone marrow-derived cells mobilization in patients with end stage liver disease. J Hepatol 2006; 45: 13-9.
32. Ji Y, Dahmen U, Madrahimov N, Madrahimova F, Xing W, Dirsch O. G-CSF administration in a small-for-size liver mo-del. J Invest Surg 2009; 22: 167-77.