Beyond the game: Three essays on how economics links to the industry of basketball
118
0
0
Texto completo
(2) BEYOND THE GAME: Three essays on how economics links to the industry of basketball. MARTA BROSED.
(3) UNIVERSITAT AUTÒNOMA DE BARCELONA BEYOND THE GAME: THREE ESSAYS ON HOW ECONOMICS LINKS TO THE INDUSTRY OF BASKETBALL by MARTA BROSED. A Thesis submitted to the. Department of Applied Economics UNIVERSITAT AUTÒNOMA DE BARCELONA for the degree of Doctor of Philosophy in Applied Economics. Supervisor MANUEL ESPITIA-ESCUER September, 2016.
(4) To Rodrigo.
(5) Contents. LIST OF TABLES AND FIGURES......................................................................................................... 6 ACKNOWLEDGEMENTS....................................................................................................................... 8 INTRODUCTION...................................................................................................................................10 MOTIVATION ....................................................................................................................................................... 10. WHY BASKETBALL?....................................................................................................................................... 12. OBJECTIVES, METHODOLOGY AND MAIN RESULTS ........................................................................................ 13 POLICY IMPLICATIONS ....................................................................................................................................... 17. PRODUCTIVITY IN PROFESSIONAL ..............................................................................................19 SPANISH BASKETBALL .....................................................................................................................19. 1.1. INTRODUCTION .................................................................................................................................... 20. 1.2. THEORETICAL FRAMEWORK ......................................................................................................... 21. 1.3. SPECIFYING THE PRODUCTION FUNCTION..............................................................................24 1.5. RESULTS AND DISCUSSION............................................................................................................... 33. 1.6. CONCLUSIONS AND POLICY IMPLICATIONS............................................................................. 41. MEASURING THE COMPETITIVE BALANCE IN THE NBA AND ITS CAUSALITIES ..........44. 2.1. INTRODUCTION .................................................................................................................................... 45. 2.2. LITERATURE REVIEW ......................................................................................................................... 46. 2.3. NBA COMPETITION SYSTEM AND ORGANIZATION............................................................... 48 2.4. MEASURING COMPETITIVE BALANCE ........................................................................................ 50. 2.4.1. THE CONCENTRATION RATIO ....................................................................................................... 50 2.4.2. THE HERFINDAHL- HIRSCHMAN INDEX .................................................................................. 51 2.4.3. THE GINI COEFFICIENT .................................................................................................................... 52. 2.4.4. NUMBER OF RELEVANT COMPETITORS ................................................................................. 53 2.5. DATA AND COMPETITIVE INTENSITY........................................................................................ 56. 2.6. CAUSALITY BETWEEN COMPETITIVE BALANCE AND DEMAND..................................... 64 2.7. CONCLUDING OBSERVATIONS ....................................................................................................... 73. APPENDIX ......................................................................................................................................................... 75. DIVERSIFICATION STRATEGIES IN NBA TEAMS .....................................................................77. 4.
(6) 3.1. INTRODUCTION .................................................................................................................................... 78. 3.2. MEASURING THE DIVERSIFICATION ........................................................................................... 81 3.3. DIVERSIFICATION INDEX FOR NBA TEAMS ..............................................................................84. 3.4. MEASURING DIVERSIFICATION EFFECTS ................................................................................. 88. 3. 4.1. PROBABILITY OF PLAY-OFF .......................................................................................................... 88 3.4.2. ANALYSIS IN TERMS OF EFFICIENCY......................................................................................... 94. 3.5. CONCLUSION .......................................................................................................................................... 99. APPENDIX ...................................................................................................................................................... 101. REFERENCES ...................................................................................................................................... 110. 5.
(7) List of tables and figures TABLE 1.1 Descriptive statistics by seasons ................................................................................ 32. TABLE 1. 2. Efficiency and potential output for season 2008/09 .......................................... 34 TABLE 1.3. Efficiency and potential output for season 2009/10 ........................................... 35 TABLE1. 4. Efficiency and potential output for season 2010/11 ........................................... 36 TABLE 1.5. Efficiency and potential output for season 2011/12 ........................................... 37 TABLE1. 6. Malmquist Index. Values and components for Spanish Basketball league ..... 40 TABLE1. 7. Malmquist Index and its components from........................................................... 41 TABLE 2.1. Descriptive statistics of Eastern Conference ......................................................... 57 TABLE 2.2. Descriptive statistics of Western Conference ........................................................ 57 TABLE 2.3. Herfindahl-Hirschman and distance to the ............................................................ 58. FIGURE 2.1. Herfindahl-Hirschman indexes and the gap regarding the homogeneous. distribution ................................................................................................................................... 60. FIGURE 2.2. Lorenz curve for East and West conferences ..................................................... 60 TABLE 2.4. Main indicators of concentration ............................................................................. 61 TABLE 2.5. Estimation of the semi-logarithmic model ............................................................. 62. TABLE 2.6. OLS Estimation results for panel for different concentration indexes .......... 63 FIGURE 2.3. Average attendance and NRC by conferences.................................................... 64. TABLE 2.7. Unit Root Test results ................................................................................................. 68 TABLE2.8. Optimal lag length ......................................................................................................... 68. TABLE 2.9. Estimation results for VAR model. ......................................................................... 70 TABLE 2.10. Estimation results for VAR model. ....................................................................... 70 TABLE 2.A1. Significance of the differences on average .......................................................... 75 TABLE 2.A2. Hausman test for equation 6 .................................................................................. 76. TABLE .2.A3. Hausman test for equation 7 ................................................................................. 76. TABLE 3.1. NBA total values of the Gollop and Monahan index .......................................... 87 TABLE 3.2. East Conference values of the Gollop and Monahan index .............................. 87 TABLE 3.3. West Conference values of the Gollop and Monahan index ............................. 87 6.
(8) TABLE 3.4. Probit and Logit estimations (dependent variable: playoff=1 if team qualifies among the 8 firsts, playoff=0 otherwise) .............................................................................. 93. TABLE 3.5. Elasticity of each GM component ........................................................................... 93 TABLE 3.6. Dependent variable: Efficiency. Panel estimation results ................................... 97 TABLE 3.7. Panel estimation results with control variables.Dependent variable: efficiency. ........................................................................................................................................................ 98. TABLE 3.A1. Descriptive statistics of the variables used to calculate the GM index ....... 101 TABLE 3.A2. Descriptive statistics of the efficiency index by seasons ................................ 102 TABLE 3.A3. Dichotomous model estimation results. Dependent variable: probability of. playoff. EAST CONFERENCE .......................................................................................... 103. TABLE 3.A4. Elasticity of East Conference ............................................................................... 103 TABLE 3.A5. Dichotomous model estimation results. Dependent variable: probability of. playoff. WEST CONFERENCE ......................................................................................... 104. Table 3.A6. Elasticity of Western Conference ............................................................................ 104 TABLE 3.A7. Hausman Test for equation 12 ............................................................................ 105 TABLE 3.A8. Hausman Test for equation 13 ............................................................................ 105 TABLE 3.A9. Panel estimation results. Dependent variable: efficiency. EAST. CONFERENCE ...................................................................................................................... 106. TABLE 3.A10. Panel estimation results with control variables. Dependent variable:. efficiency. EAST CONFERENCE...................................................................................... 107. TABLE 3.A11. Panel estimation results. Dependent variable: efficiency. WEST. CONFERENCE ...................................................................................................................... 108. TABLE 3.A12. Panel estimation results with control variables. Dependent variable:. efficiency. WEST CONFERENCE..................................................................................... 109. 7.
(9) Acknowledgements Six year ago I decided to start a long and not easy way with a clear intention: to have the opportunity of some day become a professor. What I never imagine was the huge amount of things that the research was going to provide me in many senses. For this reason I want to say thank you in general to all the people who work everyday for the PhD students, giving us their time and knowledge without expecting anything in return. I have always felt a deep admiration for this profession, which has grown during this stage of my life. Particularly I want to thank Francesc Trillas for guiding me and giving me the idea of joining together two of my passions: Economics and sports. Thank all the members of the department of Applied Economics who helped me with their valuable comments and advices, especially Jordi Perdiguero and Josep Raymond. I know the effort they did because of the singularity of my topic. I accomplish this dissertation half way between Barcelona and Zaragoza, in particular, I gratefully acknowledge to Lucia Isabel García from the University of Zaragoza for her support, knowledge and willingness. And of course, Manuel Espitia Escuer, my supervisor, to whom I should be grateful for the rest of my life. Simply thank you for believing in me from the very beginning. In this dissertation not everything is Economy and many times I needed the point of view of basketball experts. I am very thankful to the coaches, players, general managers and agents that invested their time in listening to me. Their contributions have been vital for this study.. 8.
(10) Finally and foremost, behind everything I achieve is the support of my family. Thank you mum and dad for teaching me that I have to be hard worker to reach my objectives and for showing me your admiration. Thank you Miguelo, my brother, for showing me the course to follow and understanding my circumstances when I was more stressed with this Thesis. This work is dedicated to Rodri. Once again I start and finish something by your side, and in this occasion you have been an active part, helping me to see inside basketball, your profession, your life, what my Economy was not able to show me. This dissertation belongs to you.. MARTA BROSED LÁZARO SEPTEMBER 2016. 9.
(11) Introduction. INTRODUCTION “ I’ve missed more than 9000 shots in my career. I’ve lost almost 300 games. 26 times, I’ve trusted to take the game winning shot and missed. I’ve failed over and over and over again in my life. And that is why I succeed” -Michael JordanSport is one of the most important industries in the world because of the huge amount of people, factors, stakeholders, governmental institutions and money that involves. However it is unusual to find studies, which deal with sport as an economic sector and business, being guided just by the passion of the game. This thesis is made up of three essays on sports economics, basing on basketball as a scientific laboratory, where some of the most important issues about competition and management of teams are studied. The main goal is to provide useful conclusions and policy implications that eventually improve the functioning of the industry.. Motivation Sports Economics is a rather novel discipline, compared to other branches of Economics, whose results have a growing consideration within the academic world, sparking the interest of many researchers since the appearance of Simon Rottemberg’s seminal paper on baseball player’s labor market (1956). The wide availability of data set, both of individual or collective performance, is one of the keys that explain the inclusion of sports as an empirical 10.
(12) Introduction. laboratory and the rapid increase of the literature on the economics of professional team sports. The complexity of the sports labor market, transfers or the link between demand and competitiveness or salaries and performance have motivated a great amount of studies. Not to mention the peculiarities of the sport as an industry, where the existence of competitors in necessary and required for achieving success and the maximization of the utility depends not only on financial healthy but also on sports outcomes. However, even though it is true that the cost-benefit analysis of the relationship. between. doing. sport. and. wellness-health. are. usually. accomplished, there are fewer contributions about the economic impact of sport as a relevant industry, in spite of its inclusion in the market is an indisputable evidence. Therefore, the main objective of the present work is to delve into the theoretical and empirical analysis of some of the most relevant questions of the competitive field, relying on one of the team sports with the biggest market such as basketball. Professional sport occupies a public position. Around the world there are hundreds of thousands of people supporting a team (whether football, basketball or baseball) buying shirts and merchandising products, as well as tickets for the games or the rights for private broadcasts. According to Deloitte the Big Four Leagues of EEUU generates an annual benefit of 17.000 millions of dollars and or even in Spain the Professional Football League represents the 1.7% of the national GDP, creates 85.000 direct jobs and provides 9.000 millions to the economy, without adding the business around the sports bets. This relevance fosters the growth of sports economics as a discipline that, although being relatively recent, has an important production of papers over the last 60 years.. 11.
(13) Introduction. Considering these figures, as Cairns, Jennett and Sloane (1986) relate, it seems evident that the management of sport and the decision-making of the sports institutions need to be subjected to economic analysis, whether relating to capital acquisitions (such as certain sign up), design of the competition system (whose improvements rely on the increase of the competitive balance) or determining the features of the member of the team according to the institutional objectives. Very often the goals of the organizations are misleading between the economic and sports ones, since they should be efficient in economic terms but at the same time to reach sporting success, giving prestige to the owners. In other words, maximizing the utility, either profit or wealth (Neale, 1964).. This fact encourages a decision-making. without a clear objective or motivation, which could be dealt by using the typical instruments of the economic theory. This need of applying the economic knowledge to the sports management is more intense when it comes to face budgetary restrictions.. WHY BASKETBALL? Among all the collective sports, we focus on basketball. The main reason is the statistical richness since every single movement and action is counted and analyzed by experts working in the sector. This fact makes easier the empirical stage and the application of the methodology. The amount of data increases remarkably when we talk about National Basketball Association (from now NBA) stats, where we find and endless range of data, what explains the changes that the original project of this dissertation suffers from. The first idea was to focus the whole work on European basketball, comparing different leagues but analyzing in detail the Spanish Professional League (ACB). This objective is especially interesting because of the viability problems lived by the league nowadays, not only in financial terms but also in. 12.
(14) Introduction. terms of competition design and competitive balance. It is worth remembering that the main financial resource of basketball clubs until the crisis had been the money invested by construction companies, banks, insurance companies and public institutions, conveying instability to the structure of the league and being even more important to get and efficient return from the scarce resources. However the lack of data referred to demand and quality variables of the European leagues caused a change in the analytical objective of the empirical part of this dissertation in such a way that chapters 2 and 3 it are focused on NBA, where the contractual arrangements induce team owners to monitor players, and the statistical tradition is wider. The final motivation of the three chapters presented in this work is to delve into some crucial aspects of sports such as production function, efficiency, competitive balance and heterogeneity of the inputs included in the team, from an economic perspective. In all of them this dissertation tries to contribute to the literature on the sports economics with new variables and experiments, as well as to debate about the most spread theories and assumptions.. Objectives, methodology and main results The first chapter analysis the efficiency and the evolution of the Total Productivity in Spanish First division Basketball teams during their productive process, just considering the performance on the field. The discussion about what is the production function and the inputs and outputs of the sports teams is widely spread among researchers. There is a growing literature on the. 13.
(15) Introduction. production function of the sports teams where two ways of measuring the output are found: output measured by team performance or by contrast the game in itself weighted by revenues derived from it, idea supported by Rottenberg (1956) and Neale (1964) among others. This paper is in line with the first theory, where the team is a technical unit whose performance is the output of the productive process and the differences appear in terms of inputs used. In the empirical part we will use the non-parametric techniques of optimization, measuring efficiency with respect to the best observations of the sample through a data envelopment analysis (DEA). This technique is the more suitable for sports given that it does not consider a specific functional form for the frontier as well as the absence of errors. The results provide not only the efficiency indexes, but also the potential output in terms of wins achieved seasonally, which could be compared to the real outcome of the teams. In a second stage, the Malmquist Index based on DEA results, assesses the existence of movements of the efficiency frontier or which is the same, the existence of technical progress. Our findings show that the more efficient is the team, the best sports outcomes. We also find that there is a linkage between the use of resources and the qualification at the end of the season. Given the resources used by the inefficient teams, the number of wins should have been higher and therefore not all the teams finish qualified where expected according to their availability of resources. So the main conclusion would be that team’s final position depends more on its efficient use of resources than on its potential. The second part addresses the issue of the competitive balance comparing the two conferences in which are divided the NBA teams, and its relationship. 14.
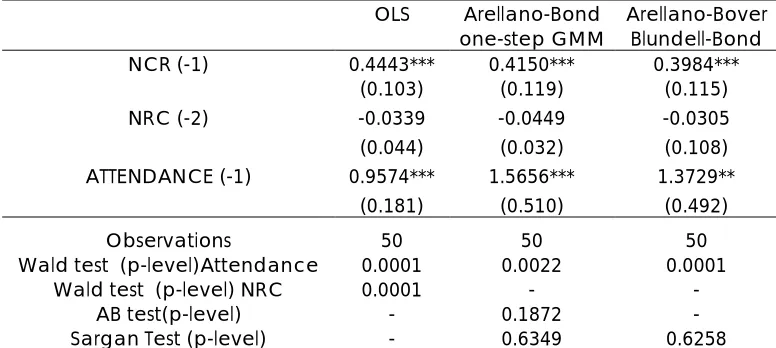
(16) Introduction. with demand, which is not clear in the literature. This is one of the issues more discussed among researchers since there are a great amount of rules that modify the market in order to ensure certain level of demand. Therefore this paper is divided in two parts. The first part seeks to identify the level of competitive balance of the whole basketball league by comparing both conferences1 with the aim of determining if the division of teams fosters the competition. The main contribution of this part of the work is the use of the Number of Relevant Competitors (NRC) as indicator of competitive balance substituting the traditional indexes of concentration. This NRC is inspired by the outcomes achieved on the market’s natural structure and derived from the application of Gibrat’s Law (1931) made by Buzzel (1981), which recognizes a correlation between the sizes or which is the same, between the market shares of the firms, taking the leader firms as reference. There are many advantages in using NRC as indicator of competitive balance instead of the typical ones when it comes to sports competitions since it avoids problems generated by the zero-sum nature of the league. The main result in this part is the high level of competitiveness presented by the NBA, an expected result considering the set of regulatory rules adopted by the league. However the distribution of teams between conferences is not optimal whose main consequence is a higher difficulty to reach the play-off stage in the Eastern conference than in Western. The relationship between competitive balance and demand is conducted in the second part of the chapter II, or which is the same, it is proved not only the correlation between uncertainty of the outcome and willingness to attend the sports event, well known as Rottenberg’s hypothesis, but also the sense of this correlation by using the Granger causality test. This is a relevant issue, 1There. are 30 teams competing in the NBA but the number of games played against each other depends on the Conference where they belong. This system was designed to avoid the big distances among cities making the league more dynamic.. 15.
(17) Introduction. whose research is very spread among academics, since there are many rules adopted by the league, which alter the market conditions, justified in terms of competitive balance and increase of the demand. The first finding is the lack of variability of the attendance along the time series, being very common the sold-out in almost every game. The immediate conclusion is the level of attendance is not explained by sporting arguments. We also show that, contrary to the expected, it is the attendance what determines the level of competitiveness. Finally, chapter 3 tackles the configuration of the teams in terms of optimal level of diversification providing experimental evidence on the relationship between outcomes achieved and heterogeneity of the inputs, that is, players of the team. Generally speaking, there are two philosophies widely spread about the design of sports teams, especially basketball teams: all the players are ready and able to perform every task during the game or otherwise, there are as many specialists in the team as tasks which means that every member plays an accurate role. The objective in this part of the dissertation is to determine what is the most effective of them since it can be an underlying factor of success. The achievement of a reliable answer of this topic would provide configuration rules to the general managers. Once again this paper is divided in two parts. Firstly we focus on the assessment of the diversification level taking the Gollop and Monahan index (1991) as reference but adapted to the case of NBA teams. Its three components (number of players used, the distribution of the time played among players and the level of effort or responsibility of each player in every task) provide much more information with respect to sporting strategies. The second part of the chapter III approaches the effects of the diversification on the outcomes measured by two alternatives: the probability of playing the play-off stage and the efficiency achieved by the teams. In both. 16.
(18) Introduction. cases we test the fulfillment of three hypothesis, which enclose the vast majority of the information required to draw conclusions, by using binary and panel data techniques respectively. The main findings are related to the sign of the impact of each component. The number of players has a negative effect over the probability of playing play-off and the level of efficiency considering that its increase responds normally to injuries or bad results. The asymmetry of time performed by each member improves the sports outcome and the effect of the heterogeneity is in the same line, which means that the specialization of the players is relevant to achieve the best qualification according to the institutional objectives of the teams. All in all, the three pieces contained in this dissertation address the relationship between economy and sports, but every paper can be read independently considering the different analysis accomplished in each of them.. Policy implications In conclusion, this dissertation tries to contribute to the sports economics researchwith regard to some of the most debated issues: efficiency in sports teams, competitive balance and optimal level of heterogeneity in teams’ design by using basketball as reference. Based on our empirical results we consider have found some interesting lessons to take into account. The media, experts, fans and even owners and stakeholders tend to focus only in sports results to assess the success of a team in a certain season. But we. 17.
(19) Introduction. show how a deeper knowledge of the reason behind teams’ sports results provide a more realistic evaluation, helping to improve them in the future by a better management of the resources. Considering the Total Factor Productivity, in a long run it is advisable to experience a technical progress that allows operating with a less utilization of resources. Regarding the relationship between competitive balance and attendance, contrary to what has been forecasted, this is unclear and not totally proved, in such a way that we recommend to review many of the rules adopted for the sake of the demand, seeking new variables that represents in a better way the reality of the current sports industry whose dimension has grown remarkably. Finally our findings in chapter III allow us to make some recommendations with respect to the shaping of the teams and their management of it, or which is the same, with respect to the general managers and coaches tasks. The more diversifier is the team, the better qualification it achieves. Therefore in NBA, as far as we have analyzed, regarding the general manager decisions it is advisable to design teams basing on specialist players who will perform almost exclusively the most suitable actions for them. In the same line, with relation to coaches decisions they should propose an unbalanced distribution of the time played among the members of the team as well as to draw movements where the specialists eventually perform the action to which are the more appropriated players on the court.. 18.
(20) Chapter1: Productivity in Professional Spanish Basketball. Chapter 1 PRODUCTIVITY IN PROFESSIONAL SPANISH BASKETBALL. ABSTRACT. The aim of this article is to study the efficiency and the evolution of the Total Factor Productivity in the Spanish First division basketball teams, taking into account only the performance on the field, which will allow us to link sporting performance to business management. To that purpose we estimate both, efficiency and Malmquist Indexes, based on teams productive activity and their ability to win. The methodology presented is a Data Envelopment Analysis (DEA) applied to the timeline of four seasons (2008/09, 2009/10, 2010/11 and 2011/12). The potential output of each team is also obtained. In order to make a better use of scarce resources, this paper provides recommendations and policy implications. JEL: L83, L20 Keywords: basketball; efficiency; data envelopment analysis; Malmquist Index. 19.
(21) Chapter1: Productivity in Professional Spanish Basketball. 1.1. INTRODUCTION Most frequently sports firms mislead the two major objectives that they have to fulfill, since they need financial health and at the same time sporting success, maximizing the utility of the firm (Neale, 1964). In many occasions this duality incites a decision making without a clear aim and motivation, not to mention the special way of looking at the professional sports firms in a competitive market. By using the tools that economic theory puts at business world disposal ,these inefficiencies could be solved. Considering the framework of the sports firms, it would be justified to provide them with an economic analysis to determine their productive aspects. However, terms such as production, production frontier or efficiency have an ambiguous meaning relative to sports management, since there is no agreement about the final objectives and the available means of production. In order to clarify the operating system of the sports bodies, this paper follows the portrayal model of the firm suggested by Fandel (1991) and adapted by Espitia-Escuer and García-Cebrián (2004) for the case of football, in which the market supplies with several inputs and resources to the firm, in shape of physical and human capital. The physical capital is found in facilities and technical progress, through the development of training techniques and the improvement of the physical qualities. However, the biggest expenditures are assigned to hire players and coaches. These resources are converted into sports results thanks to the productive process carried out during weekly workouts and games. The more efficient the team is, the less resources are used to obtain satisfactory results. Sportive results coming from the productive activity are useful to obtain revenues shaped in sales of sports 20.
(22) Chapter1: Productivity in Professional Spanish Basketball. entertainment.. According to Guzman (2006), by correctly organizing. resources and adapting the financial structure, sports clubs achieve good levels of efficiency and a sustainable growth. Taking the Spanish basketball case as reference, this study tries to give an answer to questions such as teams perform in their potential limit or otherwise they should obtain a bigger number of wins; there is technological progress in basketball; what aspects of the game deserve the attention of the mangers to organize the staff in a efficient manner. The motivation behind this sports discipline and this league is firstly the availability of data, since statistics play an important role in sporting and management decisions. And secondly, the troubling financial situation in the Spanish industry. The existing empirical studies make reference to NBA basketball mainly, so there is a gap in the application to European basketball, which works in a very different manner in many aspects. This article is organized as follow. The next section covers a review of the reference literature about efficiency in sports and the theoretical framework in which is developed this work. The third section is related to methodological aspects, that is, the specification of a production function, measurements of efficiency and a brief presentation of the Malmquist Index. The fourth and fifth sections describe the database and the obtained results respectively. Finally, the last section emphasizes the most important conclusions.. 1.2. THEORETICAL FRAMEWORK Sports economics is a relatively recent yet growing discipline and during the last 60 years has generated an important flow of articles, sparking interest 21.
(23) Chapter1: Productivity in Professional Spanish Basketball. among academics. The professional teams, even satisfying the required features to be treated as any other entity, present a number of peculiarities, which motivate an especial literature. This is considered in several articles such as Neale (1964), El-Hodiri and Quirk (1971), Cairns, Jennett and Sloane (1986). After Rottenberg, several studies have estimated the impact of the play factors in the final outcome of the game and the efficiency for a wide range of sports; Carmichael, Thomas and Ward (2001) and Carmichael y Thomas (1995) formulate a production function and obtain the production frontier of soccer and rugby respectively; Mazur (1994) and Ruggiero, Handley and Gustafson (1996) evaluate technical efficiency in baseball; Hadley, Poitras; Ruggiero and Knowles (2000) analyse the performance of American football teams with regard to their potential.; Schofiel (1998) estimates a production function of cricket; Dawson, Dobson and Gerrard (2000), Espitia-Escuer, and García-Cebrián (2004), Boscá et al. (2006) and Haas (2003) in relation to soccer. There are also many works that deal with the efficiency of basketball teams, normally focused on NBA team’s performances and the impacts of the game features in the American league. The literature presents a wide disparity of approaches depending on the time interval (during either one season or several of them), the technical unit analysed (teams or players) or the selected output (wins, % of wins, probability of winning). The pioneering article in the NBA production frontier was written by Zak et al. (1979), where inputs are ratios measuring performance of one team, dependent on their rival’s, over final outcome. Teams are efficient when they achieve their maximum potential taking into account the rival´s potential. The documents of Hofler and Payne (1997 and 2001) take a step by increasing the sample until 29. 22.
(24) Chapter1: Productivity in Professional Spanish Basketball. teams, generating a panel data for 7 seasons, therefore inputs and outputs are absolute value, with no ratios, this way avoiding multicolineality problems. This work not only manages to estimate the impact of the features of the game in the final result, but also adjusts to the impact of the coaches and player quality, which supposed a innovation to that moment. Berri (1999) introduces fixed effects in a two steps model, which links player´s statistics to total wins, and subsequently measure the marginal product of the players instead of marginal product of the inputs as Zak et al. (1979) and Hofler and Payne (2001) had already made. The innovations provided by this article are the use of a different methodology and a different analysis unit. It uses European basketball, specifically the Spanish league, which is considered the most powerful league after NBA and whose connection with academic studies is quite limited to date. It has to be noted that, despite being the same sport, there are considerable differences between American and European basketball, in terms of rules or in the way the spectacle is conceived. Finally we try to incorporate the play-off stage, which is not an easy task but really interesting because of the importance of this stageof the competition. Spanish professional basketball is going through a worrisome situation from a financial point of view. Many teams are involved in financial problems, with an added danger of insolvency. During past economic growth, the development of the market and the power of the teams with bigger economic capacity, pushed modest teams to assume investments whose incomes were not able to bear. Hence, during the seasons 2008/09, 2009/10 and 2010/11 F.C. Barcelona and Real Madrid concentrated 33%, 35% and 37% of the expenses in sports staff respectively. If the sample is expanded with Baskonia and Unicaja, the four teams accumulate 52%, 54% and 55%. Considering the. 23.
(25) Chapter1: Productivity in Professional Spanish Basketball. assumption that the income of a basketball club depends on obtained results, the best way to improve the financial situation is through a better utilization of resources detected by calculating the efficiency levels.. 1.3. SPECIFYING THE PRODUCTION FUNCTION The features and statistic richness of basketball allow to analyze it as any other productive activity, for which a production function is required. Rottenberg (1956) was pioneer on shaping the production function of a sports activity. After that, the first empirical estimations came from the hand of Scully (1974), Medoff (1976), Zech (1981) and specifically with Zak et al. (1979) what was the first attempt to consider the production function in professional basketball. A basketball team is a technical unit that produces output from a combination of inputs. Let the productive process in basketball be specified as: 𝑌𝑌𝑖𝑖 = 𝑓𝑓(𝑋𝑋𝑖𝑖 ), 𝑖𝑖 = 1,2,…,n,. (1). Where 𝑌𝑌𝑖𝑖 is the team 𝑖𝑖output (generally % of wins, probability of win or,. as in this case, number of total wins) and 𝑋𝑋𝑖𝑖 is our vector of inputs. These. inputs are responsible for measuring the activities produced by the players and coaching staff during the competition.. According to Førsund, Lovell and Schmidt (1980) and Esteban-García and Coll-Serrano (2003), there are two estimation methods implemented to build a production frontier, depending on the functional form, thus requiring. 24.
(26) Chapter1: Productivity in Professional Spanish Basketball. the link of inputs and outputs; parametric or non-parametric methods. The former provides information on the relative importance of each one of the inputs in obtaining output and being necessary to establish how the error term distributes itself. This work assumes that every team have access to homogeneous technology and all the professionals of the industry know it. This technology refers to strategies, technical resources, physical training, sports planning, etc. For this reason, the use of non-parametric techniques of optimization specifically the model known as DEA- suits this study more effectively. The main reasons are its larger flexibility and the absence of specification errors, since the adoption of a specific functional form in the relation between outputs and inputs is not necessary, nor a distribution of the efficiency. Another advantage presented by this methodology is the possibility to manage multi-output or multi-input situations, even expressing them in different units. Deterministic frontiers assess the efficiency with regard to the best observations of the sample, which corresponds to optimization process. Those organizations situated on the frontier are considered efficient, while distances between observations and this isoquant are a measure of inefficiency of the corresponding firm. In both processes -regular phase and play off- the proposed linear programming problem is the following: 𝑀𝑀𝑀𝑀𝑀𝑀 𝜙𝜙𝑖𝑖𝑡𝑡 (𝑦𝑦𝑖𝑖𝑡𝑡 , 𝑥𝑥𝑖𝑖𝑡𝑡 ) (2) 𝜆𝜆𝑋𝑋𝑡𝑡 ≤. 𝑠𝑠. 𝑡𝑡 𝑖𝑖 = 1, … , 𝑚𝑚. 𝜙𝜙𝜙𝜙𝑖𝑖𝑡𝑡. 𝜆𝜆𝑌𝑌𝑡𝑡 ≥ 𝑦𝑦𝑖𝑖𝑡𝑡 𝜆𝜆 ≥ 0 25.
(27) Chapter1: Productivity in Professional Spanish Basketball. where𝑥𝑥𝑖𝑖𝑡𝑡 and 𝑦𝑦𝑖𝑖𝑡𝑡 represent the vector of inputs used and outputs produced. respectively by the unit 𝑖𝑖 whose efficiency is being measured, while 𝑋𝑋𝑡𝑡 is the. matrix of the n productive factors used by all the teams in the sample and 𝑌𝑌𝑡𝑡 is. the matrix of products obtained by them. The weights of the optimum combination are represented by the vector of parameters 𝜆𝜆, and finally 𝜙𝜙 is. the efficiency level for the team under analysis in period t taking into account the optimum weights, so that when φ=1, the analysed firm is on the isoquant and such is its efficiency that it results impossible to achieve a bigger quantity of output given the inputs. Or dually, it is impossible to obtain the same volume of production decreasing all resources. In the same way when 𝜙𝜙 <. 1 the firm is operating under inefficiency equal to (1-φ) since it could be possible to attain the same output quantity by reducing the consumption of all the resources in that proportion.. The DEA model proposed considers constant returns to scale, since the whole competition is analysed and not game-by-game, so the compensation factor exists in order to eliminate punctual differences in terms of required inputs, which appear in certain games. For instance, when a team plays against another offensive-minded team, that style of play gives you considerably more time on attack and, as a result, more possibilities of scoring. However, the contrary occurs when a team meets a defensive-minded one. This model is characterized by an input orientation, in such a way that, given a level of output, efficiency firms will be those that are able to obtain the same output decreasing the level of input.. The adoption of one. orientation or another is irrelevant for the task of identifying inefficiencies but our choice will determine the interpretation of the results. Otherwise, the output orientation will help us to obtain the potential output given such level of inputs, allowing us to compare the real results with those that should have been achieved by each inefficient team in order to clarify the results. 26.
(28) Chapter1: Productivity in Professional Spanish Basketball. With the aim of assessing trends in Total Factor Productivity of Spanish basketball teams, we will use the Malmquist Index also based on DEA results, taking advantage of the available information from several years. This study will allow us to draw conclusions about the existence of technical progress, or which is the same, the existence of increasing returns to scale and some movement of the efficient frontier. There are several productivity index decompositions in the literature, but among all of them in this paper we will use the proposal of Grosskopf(1993) and Coelli, Rao and Battese (1998). Both define The Malmquist Index by using distance functions between two data points and two different periods (t and t+1) that describe a multi-input and multi-output production technology without the need to specify a behavioural objective: 𝑀𝑀𝑖𝑖 �𝑦𝑦𝑖𝑖𝑡𝑡 , 𝑥𝑥𝑖𝑖𝑡𝑡 , 𝑦𝑦𝑖𝑖𝑡𝑡+1 , 𝑥𝑥𝑖𝑖𝑡𝑡+1 �. 1/2. 𝜙𝜙𝑖𝑖𝑡𝑡 (𝑦𝑦𝑖𝑖𝑡𝑡+1 , 𝑥𝑥𝑖𝑖𝑡𝑡+1 ) 𝜙𝜙𝑖𝑖𝑡𝑡+1 (𝑦𝑦𝑖𝑖𝑡𝑡+1 , 𝑥𝑥𝑖𝑖𝑡𝑡+1 ) = � ∗ � 𝜙𝜙𝑖𝑖𝑡𝑡 (𝑦𝑦𝑖𝑖𝑡𝑡 , 𝑥𝑥𝑖𝑖𝑡𝑡 ) 𝜙𝜙𝑖𝑖𝑡𝑡+1 (𝑦𝑦𝑖𝑖𝑡𝑡 , 𝑥𝑥𝑖𝑖𝑡𝑡 ). (3). where𝜙𝜙𝑖𝑖𝑡𝑡 (𝑦𝑦𝑖𝑖𝑡𝑡+1 , 𝑥𝑥𝑖𝑖𝑡𝑡+1 ) represents the distance or technical efficiency for the. period t+1 with regard to the period t technology. In other words, is the distance of an observation (of input vector and output vector) in period t+1 to the frontier in period t. A value of 𝑀𝑀𝑖𝑖 greater than one will indicate positive. TFP growth from period t to t+1, while a value less than one indicates a TFP decline.. Note that, similarly to Coelli et al. (1998), Malmquist Indexes. calculated by this way are in reality a geometric mean of two productivity measures, coming from one of two periods as a benchmark. Equation 3 could be rewritten as two components: technological change and technical efficiency change:. 27.
(29) Chapter1: Productivity in Professional Spanish Basketball. 𝑀𝑀𝑖𝑖 �𝑦𝑦𝑖𝑖𝑡𝑡 , 𝑥𝑥𝑖𝑖𝑡𝑡 , 𝑦𝑦𝑖𝑖𝑡𝑡+1 , 𝑥𝑥𝑖𝑖𝑡𝑡+1 �. 1/2. 𝜙𝜙𝑖𝑖𝑡𝑡+1 (𝑦𝑦𝑖𝑖𝑡𝑡+1 , 𝑥𝑥𝑖𝑖𝑡𝑡+1 ) 𝜙𝜙𝑖𝑖𝑡𝑡 (𝑦𝑦𝑖𝑖𝑡𝑡+1 , 𝑥𝑥𝑖𝑖𝑡𝑡+1 ) 𝜙𝜙𝑖𝑖𝑡𝑡 (𝑦𝑦𝑖𝑖𝑡𝑡 , 𝑥𝑥𝑖𝑖𝑡𝑡 ) = � � � ∗ � 𝜙𝜙𝑖𝑖𝑡𝑡 (𝑦𝑦𝑖𝑖𝑡𝑡 , 𝑥𝑥𝑖𝑖𝑡𝑡 ) 𝜙𝜙𝑖𝑖𝑡𝑡+1 (𝑦𝑦𝑖𝑖𝑡𝑡+1 , 𝑥𝑥𝑖𝑖𝑡𝑡+1 ) 𝜙𝜙𝑖𝑖𝑡𝑡+1 (𝑦𝑦𝑖𝑖𝑡𝑡 , 𝑥𝑥𝑖𝑖𝑡𝑡 ). (4). where the first term refers to the technical efficiency change and compares the relative change in technical efficiency between t and t+1 with respect to the efficiency frontier of the analysed unit. A value greater than 1 indicates proximity to the production frontier, whereas a value less than 1 implies divergence. The second term is a measure of technological change or production frontier variation between two periods (t, t+1), being a value greater than 1 an indication of technological progress and a value less than 1 a sign of technological recession. This way, the technical change of the sector is reflected. 1.4. DATA. With the objective of evaluating the efficiency and productivity, it has. been built a panel data for 18 teams[1] taking part in ACB during the seasons 2008/09, 2009/10, 2010/11 and 2011/12. The reference database have been ACB data Statistics Services which is the official website for experts, completing with others tools of European and American scouting[2] The calculation of the Frontier assumes that every team try to maximize their production given the available inputs. The objective is to analyse the efficiency of the teams in their task of obtaining wins, therefore the output will be the total number of wins achieved according to Hofler and Payne (1997). Unlike the aforementioned authors which do not consider the play[1]In. Season 2008/09 the total number of team contestants was 17, so that some of the total and average results have to be compeered carefully.. [2] Scouting4u and Draftexpress, website of the scouting company NBA Draft Prospects, which makes tracking of all the players in European and American leagues.. 28.
(30) Chapter1: Productivity in Professional Spanish Basketball. off, we take notice of, during this process, not all the teams play the same number of games and there are teams that, without varying their human capital, have the possibility of achieving a larger number of wins. Given that we need to analyse both stages as a different and complementary output, it is made the decision of using multioutput. However, the fact that one team plays play-off, which represents undoubtedly a sports success, does not entail necessary an increase in its output, butsimultaneously it wastes inputs. This fact definitely would penalize, from the point of view of the efficiency, teams that have achieved to complete a remarkable regular phase qualifying between the 8 firsts. In the interest of providing consistency to the study, it has been decided to increase in 2 the number of wins of the 8 teams in play-off, which is exactly the minimum number of extra games they might play, avoiding this way the penalization in case of not achieving any win. This same procedure is applied in the following qualifying rounds until the finals. The selection process of inputs turns out to be the most delicate stage and at the same time, it provides richness to the study, since they have to be consistent with the own nature of the game and simultaneously, as any economic analysis based on production frontiers, they should help in finding reliable indicators of production flows. This selection requires a deep discussion since to there is no agreement about quantitative and qualitative indicators of the basketball skills of the human capital. As most of the sports, basketball is made of endless aspects that have influence upon the outcome, but they might not be reflected statistically. But a common aspect of all collective sports is that the only productive factor is a group of players organized under a style of playing and other strategies introduced by a technical staff. Those players develop a series of activities needed to achieve wins. To determine those relevant activities it has been required theoretical. 29.
(31) Chapter1: Productivity in Professional Spanish Basketball. foundations about the sports discipline, which contribute to specify the final production function. Apart from any proxy of the human capital (total number of player used throughout the season), which is a production resource present in all activity, we consider that inputs in basketball are the total possessions and those factors that allow the teams to increase them, that is, offensive and defensive rebounds. From a statistical point of view, what coaches understand by possessions is the addition of field throws (scored or missed), received faults and turnovers. In productive terms, a possession is the opportunity used by each team to make one basket, taking into account that the maximum time allowed by the regulations is 24 seconds. Some of these possessions finish into scored points, and those that are not scored, are considered defective product, which decreases the efficiency level since it consumes inputs. Otherwise, if two teams have achieved the same number of wins using a different amount of possessions means that the team which develops more possessions, did not obtain the same return from their productive process, maybe because the % of success or the defense performance were not good enough. Moreover, this productive factor takes charge of specifying the way teams play, their style and their strategies of performing, in such a way that it could be considered as a qualitative element. A team that chooses a productive strategy based on speed, is going to generate more chances of achieving basket, and depending on its % of success, the scores of its games will be higher, because at the same time this offensive team is going to force adversaries to play a larger number of possessions and more opportunities to score a basket. Similarly, an offensive rebound gives the team a new opportunity to score, that is, a new possession. But if the rebound is defensive, it has double. 30.
(32) Chapter1: Productivity in Professional Spanish Basketball. information in most cases: it means that the rival’s shoot has been defective due to a good and powerful defense, and at the same time, that the rebound provides another chance to score. Therefore, with these three factors we achieve to gather offensive and defensive aspects, the later indirectly, but also strategy of game. Descriptive statistics of variables are reported in Table 1.1. It should be noted that we contemplate several arguments to discount the inclusion of defensive factors as inputs following Espitia and García (2004, 2006). Mainly we consider that defensive plays are the result of tactical and technical weekly work. This is one possible way of organization in order to obtain the best outcome from the real inputs. An effective defense involves both, tactical work through the scouting of the rival’s offensive plays, and physical training with the aim of pushing through the physical exhaustion of the defence moves. In other words, if the analysed team has good defense, it will achieve a larger return of the available possessions by obtaining a positive balance in the rate scored /surrendered baskets. Moreover, there is not yet a reliable assessment method of defensive moves because they are not recorded in the statistics of each game, and the only proposal would be the use of reverse inputs, following Lewis and Sexton (2004). However this methodology is not suitable because in our case an increase in quality does not suppose a reduction in the quantity of product obtained, rather on the contrary. It has been dismissed also others inputs which are not directly bound to the production process of the team and however are influenced by random factors, as referee decisions; favour/against personal fouls, which is used as a proxy of a good offensive or bad defence, are an example of this influence.. 31.
(33) Chapter1: Productivity in Professional Spanish Basketball. TABLE1.1 Descriptive statistics by seasons SEASON 2008/09 Variable. Obs. Mean. Std. Dev.. Min. Max. Wins. 17. 18.94118. 10.73819. 8. 40. Possessions. 17. 3282.882. 305.6875. 2965. 3878. Players Offensive rebounds Defensive rebounds. 17. 12.88235. 1.69124. 11. 17. 17. 357.2941. 56.21584. 270. 503. 17. 769.7059. 87.67323. 665. 982. SEASON 2009/10 Variable. Obs. Mean. Std. Dev.. Min. Max. Wins. 18. 19.27778. 10.27164. 5. 43. Possessions. 18. 3385.278. 271.7604. 3098. 4009. Players Offensive rebounds Defensive rebounds. 18. 13.55556. 2.064325. 11. 18. 18. 354.1667. 44.14581. 279. 424. 18. 801.5556. 105.5837. 675. 1056. Obs. Mean. Std. Dev.. Min. Max. Wins. 18. 19.88889. 10.2377. 7. 43. Possessions. 18. 3399.056. 296.4828. 3072. 4180. Players Offensive rebounds Defensive rebounds. 18. 13.11111. 1.843554. 10. 17. 18. 373.0556. 49.98526. 301. 511. 18. 836.6667. 104.5326. 707. 1072. Obs. Mean. Std. Dev.. Min. Max. Wins. 18. 20.11111. 10.2262. 8. 45. Possessions. 18. 3266.833. 370.746. 3076. 4475. Players Offensive rebounds Defensive rebounds. 18. 13.55556. 2.12055. 10. 17. 18. 380.5556. 61.2413. 285. 498. 18. 870.7222. 119.216. 755. 1228. SEASON 2010/11 Variable. SEASON 2011/12 Variable. 32.
(34) Chapter1: Productivity in Professional Spanish Basketball. By using the actions during the game as inputs, we cover not only sporting aspects but also economic. Following the Fandel’s functional model of the firms (1991) and adapting it to sports firms, we must consider that the income of a basketball club is based on season tickets sales, match attendance and advertising and all these things are fundamentally dependent on previously obtained results. Therefore, in order to maximize profits it is required to minimize costs. One way to do this is through the elimination of wasted resources. 1.5. RESULTS AND DISCUSSION The results obtained from the solution of the linear programming problem applied to data of our sample for each season, are showed separately in tables 1.2, 1.3, 1.4 and 1.5. The above-mentioned results are presented ordered from bigger to lower Global Technical Efficiency within each season. This efficiency is split into two factors: Purely Technical Efficiency, which shows how well the productive unit analyzed is removing the maximum return from the available physical resources, and Scale Efficiency which calculates the size effect over the efficiency. It could be observed that the team with a major number of wins, which is FC. Barcelona, is efficient during the four seasons analyzed, independently of the results gap between them. In the same way it could be asserted that the aforementioned pattern is carried out inversely regarding those teams situated on the bottom of the rank and therefore those who lose the category. The last teams are also who perform farther away from their maximum potential during the total year. 33.
(35) Chapter1: Productivity in Professional Spanish Basketball. TABLE1.2. Efficiency and potential output for season 2008/09 Global Efficiency. Team. Pure Efficiency. Scale Efficiency. Actual Wins. Potential wins. FC.Barcelona. 1. 1. 1. 42. 42. Baskonia. 1. 1. 1. 42. 42. Unicaja. 1. 1. 1. 33. 33. 0.9. 1. 0.9. 25. 27.78. Real Madrid. 0.845. 0.949. 0.891. 32. 37.87. Gran Canaria. 0.841. 1. 0.841. 23. 27.35. Fuenlabrada. 0.806. 1. 0.806. 15. 18.62. Valencia. 0.703. 0.996. 0.706. 18. 25.6. Bilbao. 0.671. 1. 0.671. 17. 25.34. Manresa. 0.647. 0.998. 0.648. 14. 21.65. CB. Granada. 0.608. 1. 0.608. 12. 19.75. Estudiantes. 0.516. 0.993. 0.519. 11. 21.34. San Sebastian. 0.504. 1. 0.504. 11. 21.85. Sevilla. 0.454. 1. 0.454. 10. 22.05. Murcia. 0.421. 1. 0.421. 9. 21.4. Menorca. 0.368. 0.982. 0.375. 8. 21.77. Cai Zaragoza. 0.367. 0.978. 0.375. 8. 21.83. Average. 0.685. 0.994. 0.689. 19.41. 26.54. Joventut. However, it could be detected in some occasions, sporting results do not correspond with the efficiency ranking. For instance, in the season 2008/09, Real Madrid beat Joventut in the number of wins but nevertheless the last one presents a better result in terms of efficiency. The same case is applicable to Fuenlabrada who beats Bilbao and Valencia in efficiency obtaining a smaller number of wins[3]. Valencia in season 2009/10, despite of winning 25 games, which qualifies it in the fifth position, does not achieve a utilization of the resources according to its potential, in light of its efficiency index.. [3]Bilbao. is one of the eight teams competing in the play-off while Manresa or Fuenlabrada were not qualified. 34.
(36) Chapter1: Productivity in Professional Spanish Basketball. TABLE1.3. Efficiency and potential output for season 2009/10 Team. Global Efficiency. Pure Efficiency. Scale Efficiency. Actual wins. Potential wins. FC.Barcelona. 1. 1. 1. 44. 44. Baskonia. 1. 1. 1. 43. 43. Real Madrid. 0.96. 0.998. 0.962. 36. 37.5. Unicaja. 0.95. 1. 0.95. 26. 26.32. Sevilla. 0.826. 0.997. 0.828. 22. 26.63. Estudiantes. 0.785. 0.969. 0.81. 21. 26.75. Gran Canaria. 0.774. 1. 0.774. 19. 20.68. Joventut. 0.759. 1. 0.759. 15. 34.26. Valencia. 0.709. 1. 0.709. 25. 26.8. Bilbao. 0.701. 0.982. 0.714. 16. 21.41. CB. Granada. 0.685. 1. 0.685. 15. 20.45. San Sebastian. 0.64. 1. 0.64. 13. 23.45. Manresa. 0.579. 1. 0.579. 14. 22.47. Fuenlabrada. 0.558. 0.977. 0.572. 12. 23.32. Alicante. 0.528. 0.987. 0.535. 13. 24.64. Valladolid. 0.524. 0.979. 0.535. 13. 22.92. Obradoiro. 0.38. 1. 0.38. 8. 21.08. Murcia. 0.203. 0.952. 0.213. 5. 24.68. Average. 0.698. 0.991. 0.703. 20. 27.24. Nonetheless, we find that sometimes an efficient team is exceeded in terms of games wined by less efficient teams. In season 2010/11 Valencia managed to beefficient in spite of being the fifth considering the number of wins, which is due to Valencia completed such an excellent regular stage that it gives margin to maintain the levels of efficiency even without wining any game during the play-off. Contrarily, Unicaja and Bilbao in the same season are beaten by Valladolid in terms of efficiency, but achieving three wins more and competing for the play-off. Season 2011/12 presents the most worried case since Real Madrid, the second team in terms of wins, is overcome by Cai Zaragoza, which achieved 25 games less, of course without playing play-off. It should be emphasized that those teams, which behave in an inefficient way,. 35.
(37) Chapter1: Productivity in Professional Spanish Basketball. TABLE1.4. Efficiency and potential output for season 2010/11 Global Efficiency. Team. Pure Efficiency. Scale Efficiency. Wins. Potential Wins. FC.Barcelona. 1. 1. 1. 43. 43. Real Madrid. 1. 1. 1. 34. 34. Valencia. 1. 1. 1. 26. 26. Baskonia. 0.941. 1. 0.941. 30. 31.88. Gran Canaria. 0.918. 0.995. 0.923. 23. 25.05. Fuenlabrada. 0.907. 1. 0.907. 22. 24.26. Valladolid. 0.867. 1. 0.867. 18. 20.77. Unicaja. 0.865. 0.987. 0.877. 21. 24.28. Bilbao. 0.851. 0.985. 0.863. 34. 39.95. Sevilla. 0.84. 1. 0.84. 16. 19.06. Cai Zaragoza. 0.774. 1. 0.774. 16. 20.68. Average. 0.756. 0.935. 0.812. 19.89. 25.17. Estudiantes. 0.745. 0.971. 0.768. 16. 21.49. Joventut. 0.691. 1. 0.691. 14. 20.3. San Sebastian. 0.575. 0.988. 0.582. 12. 20.89. Manresa. 0.505. 1. 0.505. 10. 19.82. Alicante. 0.459. 1. 0.459. 9. 19.63. Menorca. 0.338. 1. 0.338. 7. 20.74. CB. Granada. 0.329. 0.944. 0.384. 7. 21.31. Average. 0.756. 0.990. 0.765. 19.889. 25.173. used to be repeated in different seasons. For instance, Valencia is inefficient again in the last season, according to the behaviour of the first two seasons. Another pattern repeated during the three seasons is the fact that purely efficiency takes value 1 in more than the 50% of the teams, resulting the scale efficiency the key to determine differences in efficiency. Moreover, both Obradoiro (2009/10) and Menorca (2010/11), loose the category being efficient, from the purely point of view. Although it is true that efficiency scale is not always responsible for the imbalances in the connection between number of wins and efficiency levels. The most clarifying case is Real Madrid. 36.
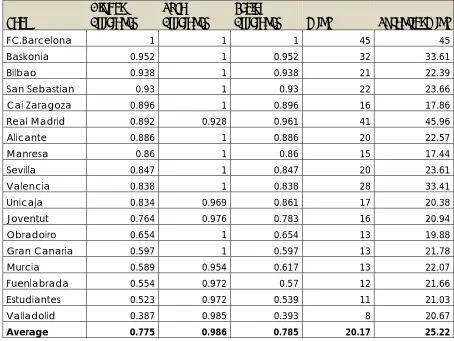
(38) Chapter1: Productivity in Professional Spanish Basketball. TABLE1.5. Efficiency and potential output for season 2011/12 Team FC.Barcelona. Global Efficiency. Pure Efficiency. Scale Efficiency. Wins. Potential Wins. 1. 1. 1. 45. 45. Baskonia. 0.952. 1. 0.952. 32. 33.61. Bilbao. 0.938. 1. 0.938. 21. 22.39. San Sebastian. 0.93. 1. 0.93. 22. 23.66. Cai Zaragoza. 0.896. 1. 0.896. 16. 17.86. Real Madrid. 0.892. 0.928. 0.961. 41. 45.96. Alicante. 0.886. 1. 0.886. 20. 22.57. Manresa. 0.86. 1. 0.86. 15. 17.44. Sevilla. 0.847. 1. 0.847. 20. 23.61. Valencia. 0.838. 1. 0.838. 28. 33.41. Unicaja. 0.834. 0.969. 0.861. 17. 20.38. Joventut. 0.764. 0.976. 0.783. 16. 20.94. Obradoiro. 0.654. 1. 0.654. 13. 19.88. Gran Canaria. 0.597. 1. 0.597. 13. 21.78. Murcia. 0.589. 0.954. 0.617. 13. 22.07. Fuenlabrada. 0.554. 0.972. 0.57. 12. 21.66. Estudiantes. 0.523. 0.972. 0.539. 11. 21.03. Valladolid. 0.387. 0.985. 0.393. 8. 20.67. Average. 0.775. 0.986. 0.785. 20.17. 25.22. (2011/12)who is beaten by four teams with less wins but which register total pure efficiency, while Real Madrid shows inefficiency. Regarding averages, it is remarkable that during season 2011/12 teams perform nearer from the frontier, which fits in a major number of average wins. Among all the inputs, possessions would have the greatest impact on the efficiency indexes, since the most efficient season (2011/12) records the fewer number of possessions on average but the larger figure in the rest of inputs. The standard deviation of the wins has been decreasing progressively over the analysed period, being in the last season noticeably lower, which. 37.
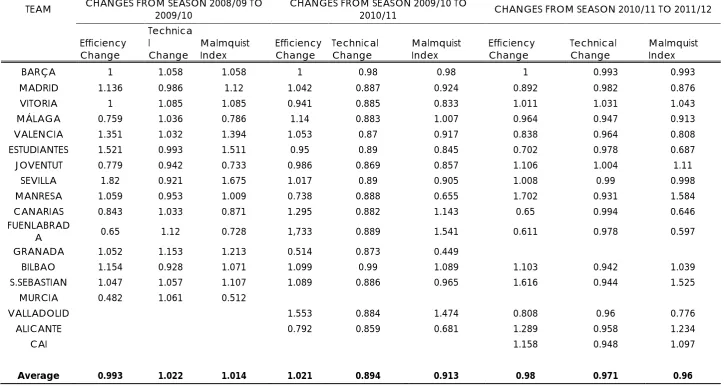
(39) Chapter1: Productivity in Professional Spanish Basketball. makes us think that budgetary reductions are leading to an homogenization and to an increase of the competitive balance. We also calculated the potential wins, i.e. the amount of wins each team could have achieved each season with an efficient use of its actual resources. From a first analysis of these results we deduce that, except season 2011/12, the champion (FC. Barcelona) is always the team with the highest potential. However, at the bottom of the table, none of the teams relegated should have been the lowest ranked taking into account their potential. In contrast, we also see teams that avoid the relegation by making a more efficient use of their resources than opponents. Table 1.6 describes the decomposition of Malmquist Index into efficiency change and technical change, and reports the change in total factor productivity for each unit from one year to the next. It can be seen that only in season 2009/10 Malmquist Index is more than the unit; in the last two seasons studied the value is inferior to the unit, which means that the total factor productivity of ACB teams is decreasing although the fall is smaller from one period to another. With regard to the evolution of efficiency and technical change, it is observed that on average, only in the second term the efficiency change increases, happening the same with technical change for the first season. The best team in terms of technological progress always plays play-off without expecting it, that is, without being one of the favourite teams for playing this stage of the championship. That is the case of Estudiantes, Fuenlabrada and San Sebastian. Otherwise, teams at the bottom of the ranking or teams that come from playing play-off and do not achieve such success in the next season, suffer the biggest decrease in the Malmquist Index. But in every case, teams relegated to the second division present a Malmquist Index, a technical change and efficiency change inferior to the average.. 38.
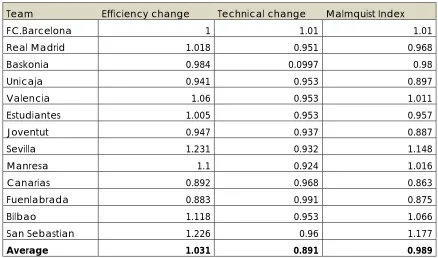
(40) Chapter1: Productivity in Professional Spanish Basketball. The main result is the fact that productivity change does not present a pattern in its behaviour concerning the movement of its components, which indicates that no component predominates in the TFP variations. Nevertheless, several individual cases should behighlighted , which deserve a deeper analysis. For instance, in seasons 2010/11 and 2011/12 there are teams undergoing a positive change in efficiency simultaneously with a greater technical decline, leading to a fall in TPF (FC.Barcelona and Sevilla in both seasons, Real Madrid, Valencia, and San Sebastian in 2010/11). Moreover, in season 2010/11 there is an increase in efficiency average and all the teams showed a negative technical change. Given that during the time period studied, TFP showed no clear evolution, both on average and by teams, it is worth taking the sample as a whole, and analysing the evolution from 2008/09 to 2011/12. The values for only those teams that played all the seasons in ACB are showed in Table 1.7. The Malmquist index is smaller than the unit; therefore, there is a productivity decrease despite the efficiency progress observed in the same period. Six teams present Total Factor Productivity growths (FC.Barcelona, Valencia, Sevilla, Manresa, Bilbao and san Sebastian), but only FC. Barcelona achieves also a positive technical change. In the light of these results, we could conclude that, in the time horizon analyzed, the impact of efficiency over the productivity evolution is not so important as the impact of technical change.. 39.
(41) Chapter1: Productivity in Professional Spanish Basketball. TABLE 1.6. Malmquist Index. Values and components for Spanish Basketball league TEAM. CHANGES FROM SEASON 2008/09 TO 2009/10 Efficiency Change. Technica l Malmquist Change Index. CHANGES FROM SEASON 2009/10 TO 2010/11 Efficiency Change. Technical Change. Malmquist Index. CHANGES FROM SEASON 2010/11 TO 2011/12 Efficiency Change. Technical Change. Malmquist Index. BARÇA. 1. 1.058. 1.058. 1. 0.98. 0.98. 1. 0.993. 0.993. MADRID. 1.136. 0.986. 1.12. 1.042. 0.887. 0.924. 0.892. 0.982. 0.876. VITORIA. 1. 1.085. 1.085. 0.941. 0.885. 0.833. 1.011. 1.031. 1.043. MÁLAGA. 0.759. 1.036. 0.786. 1.14. 0.883. 1.007. 0.964. 0.947. 0.913. VALENCIA. 1.351. 1.032. 1.394. 1.053. 0.87. 0.917. 0.838. 0.964. 0.808. ESTUDIANTES. 1.521. 0.993. 1.511. 0.95. 0.89. 0.845. 0.702. 0.978. 0.687. JOVENTUT. 0.779. 0.942. 0.733. 0.986. 0.869. 0.857. 1.106. 1.004. 1.11. SEVILLA. 1.82. 0.921. 1.675. 1.017. 0.89. 0.905. 1.008. 0.99. 0.998. MANRESA. 1.059. 0.953. 1.009. 0.738. 0.888. 0.655. 1.702. 0.931. 1.584. CANARIAS FUENLABRAD A GRANADA. 0.843. 1.033. 0.871. 1.295. 0.882. 1.143. 0.65. 0.994. 0.646. 0.65. 1.12. 0.728. 1,733. 0.889. 1.541. 0.611. 0.978. 0.597. 1.052. 1.153. 1.213. 0.514. 0.873. 0.449. BILBAO. 1.154. 0.928. 1.071. 1.099. 0.99. 1.089. 1.103. 0.942. 1.039. S.SEBASTIAN. 1.047. 1.057. 1.107. 1.089. 0.886. 0.965. 1.616. 0.944. 1.525. MURCIA. 0.482. 1.061. 0.512. VALLADOLID. 1.553. 0.884. 1.474. 0.808. 0.96. 0.776. ALICANTE. 0.792. 0.859. 0.681. 1.289. 0.958. 1.234. 1.158. 0.948. 1.097. 0.98. 0.971. 0.96. CAI Average. 0.993. 1.022. 1.014. 1.021. 0.894. 40. 0.913.
(42) Chapter1: Productivity in Professional Spanish Basketball. TABLE 1.7. Malmquist Index and its components from season 2008/09 to 2011/12 Team. Efficiency change. FC.Barcelona. Technical change. Malmquist Index. 1. 1.01. 1.01. Real Madrid. 1.018. 0.951. 0.968. Baskonia. 0.984. 0.0997. 0.98. Unicaja. 0.941. 0.953. 0.897. 1.06. 0.953. 1.011. Estudiantes. 1.005. 0.953. 0.957. Joventut. 0.947. 0.937. 0.887. Sevilla. 1.231. 0.932. 1.148. Manresa. 1.1. 0.924. 1.016. Canarias. 0.892. 0.968. 0.863. Fuenlabrada. 0.883. 0.991. 0.875. Bilbao. 1.118. 0.953. 1.066. San Sebastian. 1.226. 0.96. 1.177. Average. 1.031. 0.891. 0.989. Valencia. 1.6. CONCLUSIONS AND POLICY IMPLICATIONS In any sport, basketball in particular, the achievement of objectives without wasting resources, is essential for the sustainability of any organization, particularly when the economic situation is as discouraging as theSpanish current one. Performing on the field efficiently is the best way to increase the profits by generating savings, which minimize costs. Therefore, this study has measured the efficiency of the basketball Spanish first division (ACB) teams developing their productive activity for the achievement of wins and also the evolution of Total Factor productivity, between the seasons 2008/09 and 2011/12.. 41.
(43) Chapter1: Productivity in Professional Spanish Basketball. The analysis is based on the calculation of the Malmquist Index. The efficiency values (split into global technical efficiency, purely technical efficiency and scale efficiency) have been calculated through the use of Data Envelopment Analysis (DEA), which allows us to make a series of observations, comments and conclusions with regard to the management of the budgets and the relationship between efficiency and sports performance. We can conclude that generally speaking the efficient teams are those achieving the best sports outcomes, and those teams that are not efficient could have achieved the same amount of wins using fewer resources. Otherwise, given the resources used by the inefficient teams, the number of wins should have been higher, as shows the potential output calculated. Another remarkable result is that efficiency is linked with a larger number of wins on average and fewer amount of possessions used, since season 2011/12 is the best in terms of efficiency but records the least amount of possessions in comparison to the rest of the seasons. Therefore, we can conclude that, in order to obtain an effective use of the available resources, anadvisable strategy would be to develop a style of playing defined by a slow pace. Fewer possessions played will result in a higher level of efficiency.. Between 2008/09 and 2009/10 seasons there is an increase in Total Factor Productivity, while between 2010/11 and 2011/12 the productivity falls. Throughout the two first terms, changes in the Malmquist Index can be attributed to technical change, whereas in the last period the decrease is due to both, efficiency and technical change. The fact that there is not a pattern in the evolution of TFP and its components, led to the conclusion that neither efficiency changes nor technical changes predominate in the TFP variations, 42.
(44) Chapter1: Productivity in Professional Spanish Basketball. which could be a consequence of the fact that the isoquants referring to the different periods are cut. This explains also that the technical change experienced by all the analysed units is different for the same period. The results of this study are useful not only to improve teams’ economy, but also to analyse and make recommendations in regards to sporting performance. We have checked that all the relegated teams presents efficiency and Malmquist indexes under the average of the competition, and in most cases they presents the worse results. Contrary, those teams that unexpectedly compete in the play-off, always accomplish efficient results, making a quality improvement in different dimensions. Considering the evolution of the Total Factor Productivity between 2008 and 2012 as a whole, we observe a decline in productivity on average despite the improvements in efficiency. Only six teams present a Mamquist Index superior to the unit. Which is more, only the leader in terms of wins and championships achieved, i.e. FC. Barcelona, accomplishes a positive technical change. Therefore, the achievement of a positive shift in the production frontier appears to be vitally important for staying efficient during a long period. In a long run, teams should work with the aim of experiencing technical progress and reaching frontiers that represent less utilization of resources. After taking into account our findings we would recommend to pay attention of the use of possessions, to stress the importance of rebounds in the configuration of the team and do not use a large number of players (it should be pointed that most of the relegated teams used a number of players above average, supposedly making changes in order to improve the situation).. 43.
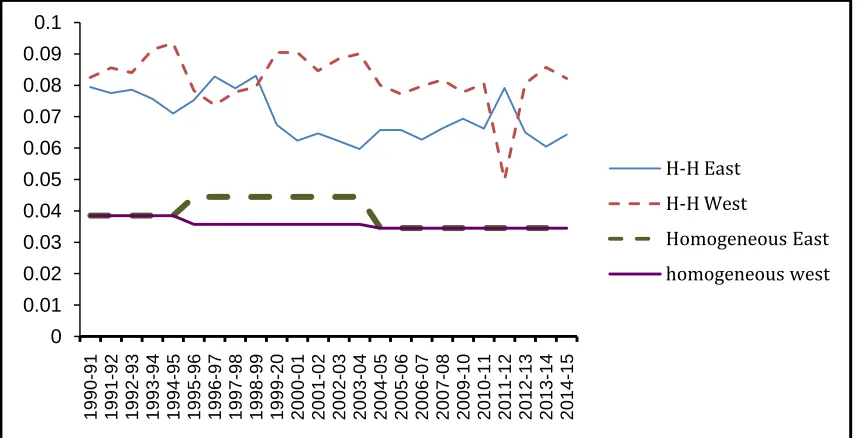
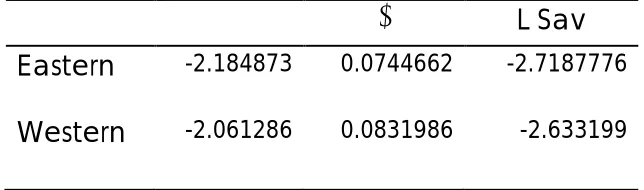
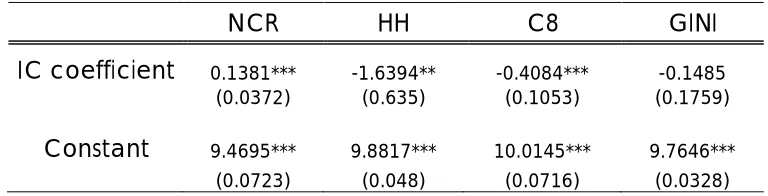
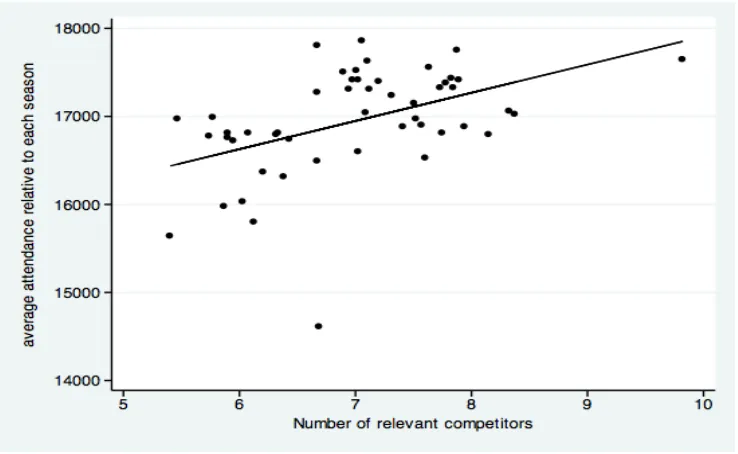
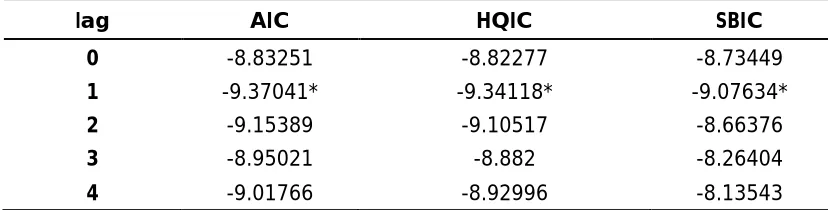
(45) Chapter 2: Measuring the competitive balance in the NBA and its causalities. Chapter 2 MEASURING THE COMPETITIVE BALANCE IN THE NBA AND ITS CAUSALITIES ABSTRACT The aim of this paper is to approach properly the way of measuring the competitive intensity, comparing both conferences of the NBA through 25 seasons, in order to analyze the causality between Competitive Balance and demand. The tools, coming from the industrial economics, are used to detect domain positions or oligopolistic structures. This work adds the NRC indicator (number of relevant competitors), inspired by the outcomes achieved on the market’s natural structure. The results show that both Conferences present a high level of competitive intensity being the Eastern Conference slightly more competitive, in spite of the regulation applied is identical. The second part consists in testing the causality between Competitive Balance and venues attendance by using the Granger Causality test methodology, proving that Competitive Balance is not an exogenous regressor of the NBA demand function estimation, while it is the attendance which has an impact on the competitive balance, contrary to the literature’s assumption, calling into a question the measures adopted by the NBA as institution to keep a high level of competitive balance for the sake of demand. Additional arguments are reported in the text. JEL: L83, L20. Keywords: basketball; competitive balance; number of relevant competitors; Granger Causality Test.. 44.
Figure

+7
Documento similar
1. S., III, 52, 1-3: Examinadas estas cosas por nosotros, sería apropiado a los lugares antes citados tratar lo contado en la historia sobre las Amazonas que había antiguamente
In the previous sections we have shown how astronomical alignments and solar hierophanies – with a common interest in the solstices − were substantiated in the
While Russian nostalgia for the late-socialism of the Brezhnev era began only after the clear-cut rupture of 1991, nostalgia for the 1970s seems to have emerged in Algeria
MD simulations in this and previous work has allowed us to propose a relation between the nature of the interactions at the interface and the observed properties of nanofluids:
Government policy varies between nations and this guidance sets out the need for balanced decision-making about ways of working, and the ongoing safety considerations
No obstante, como esta enfermedad afecta a cada persona de manera diferente, no todas las opciones de cuidado y tratamiento pueden ser apropiadas para cada individuo.. La forma
In the “big picture” perspective of the recent years that we have described in Brazil, Spain, Portugal and Puerto Rico there are some similarities and important differences,
To determine how public authorities should manage curbside and garage parking, Chapter 2 analyzes the impact of garage fee and curbside regulation characteristics (fee and types
