1
UNIVERSIDAD DE VALLADOLID
ESCUELA DE INGENIERIAS INDUSTRIALES
Grado en Ingeniería en Organización Industrial
Marketing Plan to introduce MILZU! in Spain
Autor:
Pescador Calleja, Alvar
Dr. Pedro Sanz Angulo
Universidad de RIGA
2 TFG REALIZADO EN PROGRAMA DE INTERCAMBIO
TÍTULO: Marketing Plan to Introduce MILZU! in Spain
ALUMNO: Alvar Pescador Calleja
FECHA: 23 de Mayo de 2016
CENTRO: Riga Technical University. Faculty of engineering economics and management
4
INDEX
1 INTRODUCTION TO MILZU. ... 7
1.1 DESCRIPTION OF MILZU ... 7
1.2 NEEDS ... 8
1.3 MISSION, VISSION AND VALUES ... 9
1.4 MARKETING PLAN AIMS ... 10
2 EXTERNAL ENVIRONMENT ANALYSIS ... 11
2.1 POLITICAL FACTORS ... 11
2.2 ECONOMIC FACTORS ... 16
2.3 SOCIAL FACTORS ... 21
2.4 TECHNOLOGICAL FACTORS ... 25
2.5 ENVIRONMENTAL FACTORS ... 26
2.7 LEGAL FACTORS ... 27
2.9 CULTURAL FACTORS ... 29
2.10 PESTEL SUMMARY ... 29
3 TARGET MARKET ANALYSIS. ... 31
3.1 WHERE IS MILZU! NOWADAYS ... 31
3.2 CEREALS MARKET OVERVIEW ... 32
3.2.1 GLOBAL CEREAL MARKET ... 32
3.2.2 SPANISH CEREALS MARKET ... 34
3.3 TENDENCIES IN CONSUMPTION HABITS... 35
3.3 TARGET MARKET SIZE (1) ... 38
3.4 INTRODUCTION CEREALS PROCEDURE ... 41
3.4.1 MARKET SHARE ... 42
3.4.2 NUMBER OF SHOPS ... 43
3.4.3 VARIETY OF BRAND ... 44
3.4.4 ONLINE POSITION ... 44
3.4.5 PRICE LEVEL ... 45
5
3.4.7 FINAL PARAMETRES ANALYSIS ... 47
3.5 TARGET MARKET SIZE (2) ... 49
3.6 MILZU! EXPANSION. ... 50
3.7 PORTER’S FIVE FORCES ANALYSIS. ... 53
3.8 COMPETITORS ANALYSIS IN SPAIN ... 55
4 SWOT ANALYSIS OF MILZU! ... 59
4.1 STRENGHTS ... 59
4.2 WEAKNESSES ... 60
4.3 OPPORTUNITIES ... 61
4.4 THREATS ... 61
4.5 SWOT SUMMARY ... 62
5 MARKETING MIX ... 63
5.1 PRODUCT ... 64
5.2 PRICE ... 70
5.3 PLACE ... 73
5.4 PROMOTION ... 77
5.5 PEOPLE ... 81
5.6 PROCESS ... 83
5.7 PHYSICAL EVIDENCE ... 84
5.8 PROTECTION ... 86
6 ECONOMIC PLAN ... 87
6.1 RELEVANT NUMBERS ... 87
6.1.1 POTENTIAL SALES ... 87
6.2 EXPENSES ... 88
6.3 REVENUES ... 91
6.4 INCOME STATEMENT ... 93
6.5 ECONOMIC VIABILITY ... 97
6
7 CONCLUSION. ... 99
8 ANNEXES... 101
8.1 BENEFITS IN CERALS INTAKE ... 101
8.2 DIFFERENT KINDS OF CEREALS ... 104
8.3 MARKET SIZE ... 105
8.4 SUPERMARKETS PARAMETERS ANALYSIS ... 107
8.5 MILZU! EXPANSION... 108
8.6 MILZU! EXPENSES ... 109
8.5 MILZU! REVENUES ... 111
8.6 INCOME STATEMENT ... 113
9 BIBLIOGRAPHY. ... 115
10 APPENDIX ... 117
10.1 TABLES ... 117
10.2 EQUATIONS ... 117
7
1 INTRODUCTION TO MILZU.
1.1 DESCRIPTION OF MILZU
As Author’s thesis found on the website of the company1, MILZU is a cereals
brand inspired by making some kinds of cereals. This company makes his products using some natural ingredients and with the objective that their products are as healthy as possible.
This company offers three different kinds of products:
For children.
For adults.
BIO.
Each product has its own features to help you satisfy the needs of customers.
Figure 1: Milzu! logo2
In reference to other website3, MILZU is the most delicious and healthiest power-cereal brand from Latvia, which tells this lands story and gathers its power by offering really powerful cereals for children and adults. MILZU inspires kids to grow big and strong, to search and acknowledge their inner talents. Adults are inspired to remember about their strengths, which makes them glad and happy.
1 http://www.Milzu.lv
8
1.2 NEEDS
The lifestyle of society in development countries offers a number of needs that can be covered with our products.
Nowadays Author’s thesis thinks that people live in a society where it has been produced, and is producing a great increase in consumption. This trend will continue to increase in the coming years.
In addition, concerns about body care and health status has increased to the point of being an important aspect in society.
For example, it has increased the number of people who want or like to go to the gym and this has led to the opening of new facilities4.
In the following picture Author’s thesis shows an increase in the number of people targeted to a gym in the last years.
Figure 2: Increase Gym users5
On the other hand, using this argument also Author’s thesis can conclude that he doesn’t not mind to spend a little more money in order to help his body to be healthy.
Author’s thesis knows that breakfast is the most important meal of the day and it should provide him more energy for all day.
4 http://www.uworkfit.com/entrenamiento/los-espanoles-y-el-gimnasio-2/
9
In this context MILZU has some products which help somebody because6:
Contains the outer grain-coat and such flour contains more fibre, proteins, vitamins, minerals.
With the addition of wholegrain oat flour abundant in fibre, especially, soluble fibre beta-glucans, which work well for intestinal microflora and optimise cholesterol metabolism.
Contains the insoluble and soluble fibre necessary for proper functioning of the body.
Contains B group vitamins (B1, B2, B5, B6, etc.). B group vitamins play an important role in metabolic processes, promoting energy release. B group vitamins stabilise the functioning of the nervous system.
Contains E vitamin – antioxidant that operates at cell level in the body and controls quantity of selenium.
Contains minerals such as phosphor, calcium, magnesium, iron, zinc, and copper – all fulfilling an important function in the body and serving as antioxidants.
Cocoa added in small amounts.
Some adult products contain rye, oats, cranberries, sea buckthorn, honey which are good for our body reducing cholesterol level, improving to move food through the digestive tract, creating feelings of satiety, minimising the risk of second type of diabetes…
In addition, this product is made of raw materials grown in Latvia and the Baltic region, and contains biologically active substances.
1.3 MISSION, VISSION AND VALUES
Milzu’s mission is contributing to nutrition, health and welfare of the people, by providing products of the highest quality for any time of day and for all stages of life, and managing the business in ways that create value for the company at the same time to society. As reflected in our website7, with its activities MILZU inspires both children
and adults. MILZU supports, safeguards and brings happiness with its products, communication, and good work for society and its customers.
Milzu’s vision is to become a company recognized as leader in nutrition, health and welfare at European level by consumers, employees, customers, suppliers and all
10
stakeholders related to the activity of the company. As Author’s thesis shown in their website8, today MILZU is the most delicious and healthiest power flake brand in Latvia, offering really powerful food for children and adults.
Author’s thesis thinks that Milzu’s values represent its identity as a group:
Continuous improvement: trying its customers to recognize them like the best cereals brand.
Healthy: using natural ingredients in our products.
Innovation: introducing new products which could help different kind of people.
Quality: looking for being better in European market.
Teamwork: joining experiences, efforts and ideas to reach our goals.
Environmental Concerns: respecting European standards.
1.4 MARKETING PLAN AIMS
Author’s thesis thinks that the aim of the marketing plan is provide to Spanish people another brand cereal which is good for their health at the same time. Author’s thesis shows in Annexes the different types of cereals for breakfast which companies could make and the different properties that provide to their consumers.
Author’s thesis shows in Annexes the benefits of cereals intake of which highlight the many different vitamins and minerals that provide to customers as well and thinks that deleting breakfast means to reduce the amount of nutrients necessary in the most important meal of the day.
Author’s thesis also thinks that Milzu might have a really good opportunity of business in Spain because of the cereals consumption of Spanish people and for its products called BIO because they are important for many people nowadays.
Then, Author’s thesis will analyse all the parameters which affect to Milzu expansion and is going to start with a General Analysis of Spain.
11
2 EXTERNAL ENVIRONMENT
ANALYSIS
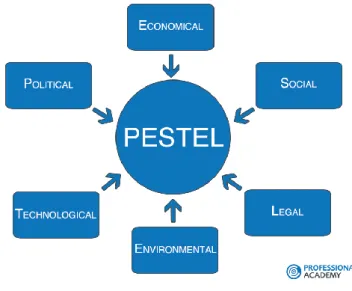
The external environment analysis is a marketing tool used to determine different aspects that affect the development of a product. These factors are Political, Economic, Social, Technological, Environmental and Legal. Also Author’s thesis can consider a cultural factor because it will be important for him.
This analysis examines one by one these general conditions affecting the environment and the consumers in which the project will be developed.
Figure 3: PESTEL9
2.1 POLITICAL FACTORS
Spain is a country with a democratic system established for thirty-seven years and a member of the European Union.
Author’s thesis opinion is that Economic crisis in Spain has prompted a general dissatisfaction to the citizens. The faith level of Spanish with politics parties and politicians reached lows. Economic hardship and the feeling that the system does not respond as it should have increase the protests. As a result, citizens participate more in
12
protests. In reference to a study10, Spanish people who recognise to take part in
authorised protests increased 26% last year.
Power is highly decentralized. It means that the autonomous communities have a high level of each power in each autonomous community. These powers are legislative, executive and fiscal:
1. Legislative Power.
The legislative power is bicameral. The Parliament, called Cortes Generales, is made up of:
- The Senate which has 264 seats. Its role is that of representing the territories (Autonomous Communities and Departments). The senators are elected by universal suffrage for 4 years.
- Congress of Deputies which has a minimum of 300 seats and a maximum of 400 (currently 350). The deputies are elected by universal suffrage for 4 years from departmental constituencies. There are allotted one minimum representation and the remaining is proportional to their population. To avoid splitting up which is harmful to the stability of the Chamber, the D’Hondt system is applied.
The executive wing of the government depends directly or indirectly on the parliament's support, often expressed by a vote of confidence. The legislative power belongs to the government and the two houses of parliament at the same time. The Prime Minister does not have the authority to dissolve the parliament directly, but he can recommend its dissolution to the king. The Spanish citizens enjoy considerable political rights.
The 17 Autonomous Communities also have a legislative power exercised by their unicameral Parliament within the limit of jurisdictions fixed by each of their Statutes.
2. Executive Power.
The King is the Head of the State and the commander-in-chief of the army. His role is mostly ceremonial. Following legislative elections, the leader of the majority party or the majority of the coalition is appointed Prime Minister by the Sovereign and then elected by the parliament for 4 years.
13
The Prime Minister is the head of the government. He is also called the President of the Government. He holds executive power which includes the execution of the law and the management of the routine affairs of the country. The Council of Ministers is appointed by the king on the recommendation of the Prime minister. There is also a Council of State which enjoys the role of the supreme consulting body of the government. But its recommendations are not binding.
The President of each Autonomous Community is from the majority party of the majority coalition winning elections of the Parliaments of the Regions which take place every 4 years. The President forms a government whose ministers are appointed under the title counsellor and seconded by a cabinet and director generals, etc. who are in charge of each Department heading the sectors for which the Autonomous Community has jurisdiction in substitution of the Spanish State.
3. Judiciary Power.
The judiciary is one power of the state which works using the law. It is responsible for giving justice in society through the application of legal norms in conflict resolution. Its organs of action are the courts exercising judicial power, which has to be impartiality and autonomy.
The Judiciary manages justice and decide which the law is, and makes the judicial function and guarantee respect for the rule of law when it should be interpreted. According to the classical theory of Montesquieu, the division of powers guarantees the freedom of citizens.
Under the separation of powers, it is born the so-called rule of law, in which public authorities are also subject to the rule of law. The judiciary must be independent in order to control the remaining powers, especially the executive, when it goes against the law.
The Spanish judiciary has Jurisdictional Organs, formed by National Court, Supreme Court and High Court. Each of them has an established competition.
Another demand of the Spanish people is the ability to choose between monarchy and republic. Currently, Spain is under a constitutional monarchy, where Felipe VI is the head of state.
14
which Author’s thesis can find an undeclared funding and some extra salaries of the politic party of the current government.
Figure 4: Spanish Newspapers reference Barcenas case11
The result has been a change of government. Firstly, elections to European Parliament were held in May 2015 and it was observed the change of the people’s thinking. It notes that in these elections a new political party that had great acceptance among citizens emerged. It is called “PODEMOS”.
Figure 5: European Spanish Elections Results12
15
Author’s thesis can see a change with respect to 2009. Author’s thesis thinks that Spanish Government have gone from a political bipartisanship to a distribution of seats in different political parties.
Secondly, General Spanish elections were held in December 2015 and the results finally showed us the end of bipartisanship. At that moment another new political party got great results. It is called “CIUDADANOS”.
Author’s thesis notice that last government lost its absolute majority and political representatives need to make some deals in order to form a new government.
Figure 6: General Spanish Elections Results13
As a member of the European Union, Spain is regulated by all European Standards and also has the euro as currency. The internal market of the European Union is a single market in which freely circulate goods, services, capital and people and in which European citizens can live, work, study or do business freely.
16 Figure 7: European Union14
2.2 ECONOMIC FACTORS
Last years both the Spanish and the European economies have seen us affected by a deep crisis that began in 2008. Today the economic situation has improved and European citizens are now coming out of the situation they were in.
After two long recessions, the economy has managed to link five quarters of growth has accelerated in recent months with a household consumption mainly and exports. It means that Gross Domestic Product (GDP) of Spain has increased at 3.4%, above the average growth of the rest of Europe stood at 1.9% 15.
17 Figure 8: Spain GDP Anual growth rate16
After six years of recession, the recovery initiated in the second half of 2013 continued to be reinforced in 2015, and growth exceeded 3% of GDP. Driven by domestic demand, growth was supported by households and investor confidence, related to job creation, deflation, improved credit terms, lower oil prices, the recovery in Europe, the depreciation of the euro and the implementation of reforms. Whilst remaining vigorous, activity is expected to slow slightly in 2016 (2.5%), with the positive effects of lower oil prices and the depreciation of the euro wearing off.
As illustrated by the consolidation of economic growth, imbalances continued to decrease in 2015. The bank consolidation programme has helped improve the financial sector; risk improved thanks to the sharp fall in borrowing costs in the bond market and the fiscal adjustment effort; export companies have been consolidated. The public deficit continued to shrink thanks to solid growth and low interest rates, a trend that is expected to continue in 2016. However, public debt continues to increase and is expected to exceed 100% of the GDP in 2016; the private sector debt remains a concern, and Spain is experiencing deflation. After five years of austerity, the 2016 budget plans to increase spending in education, health, culture, civil servants pay and state pension. The Government’s plan to reduce the deficit to 2.8% was considered unrealistic by the European Commission, that asked in vain for the budget to be re-written. Weakened by the austerity policies and corruption cases, the traditional political class has to face the increase in the anti-establishment vote. The end of the two-party system (with the rise of the Radical Left - Podemos) plunged the country into a period of political uncertainty that could affect economic recovery.
18
The Spanish unemployment rate has fallen due to the decrease in its active population and the creation of new temporary jobs, but still remains very high (20%). A third of employees earn a maximum of EUR 655 per month. In general, the crisis has had a negative impact on living conditions.
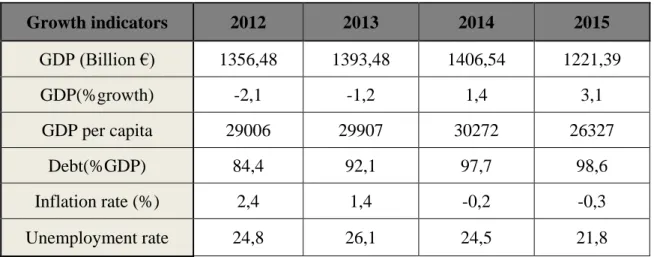
There are some economic indicators in the following table:
Growth indicators 2012 2013 2014 2015
GDP (Billion €) 1356,48 1393,48 1406,54 1221,39
GDP(%growth) -2,1 -1,2 1,4 3,1
GDP per capita 29006 29907 30272 26327
Debt(%GDP) 84,4 92,1 97,7 98,6
Inflation rate (%) 2,4 1,4 -0,2 -0,3
Unemployment rate 24,8 26,1 24,5 21,8
Table 1: Spanish Economic Indicators17
In reference to revenues distribution between different sectors, Author’s thesis knows that tourist sector is the most important because Spain is one of the most tourist destinations nowadays. More than a half of the Spanish GDP is obtained from this sector.
In addition to this section, Author’s thesis thinks that there is a good primary sector as well, which is mainly consisted in agriculture. Spain produces wheat, sugar beet, barley, tomatoes, olives, citrus, grapes and cork. The country is the largest producer of olive oil in the world and the third in wine. It is also the largest producer of lemons, oranges and strawberries. But mineral resources are limited.
In reference to secondary sector, which is considered as industry sector, sector is mainly dominated by clothes industries and processing of iron, steel and food.
If Author’s thesis breaks down employment by sector, this is the result:
17
19
SECTOR Primary Secondary Services
% EMPLOYMENT 4,2 19,5 76,3
% GROWTH -3,7 0,2 2
Table 2: Break down Employment18
Public debt in Spain has decreased in the last quarter of 2015 at 5.566 million euros and stood at 1,056,749 million. This figure means that the debt reached 98.78% of GDP in Spain. Comparing the debt to October 2014, Author’s thesis shows that in the last year, debt has grown in Spain € 895 per inhabitant. Public debt of Spain is one of the highest in the world. 19 In spite of the data, the forecasts made by the IMF in debt and
public deficit against the percentage of GDP last year are better than expected.
Figure 9: Forecast of IMF20
Public spending in Spain last year reached a total of 461.124 million euros, which represented 43.6% of its Gross Domestic Product in 2014, a lower percentage than the average of 48.1 % observed in the European Union and 49% among the euro countries. It means that Spain spent less than the average for the European Union in areas such as education (9.1%), Health (13.6%), social protection (39.7%) and defence (2.1%). The
18
https://es.santandertrade.com/analizar-mercados/espana/politica-y-economia?&actualiser_id_banque=oui&id_banque=0&memoriser_choix=memoriser
20
lower investment in health can cause people to crowd the public health service to welfare centres causing irreparable damage to the health of the population.21
Figure 10: Evolution of Public Spending in Spain22
As Author’s thesis shows in current news23, number of unemployed people in Spain
in the first month of 2016 is around 4 million. Unemployment rate in Spain is still high, but it is noteworthy that in 2015 the most significant drop in the number of unemployed people in the last years was recorded. Despite this good news, the new policy of open-ended contracts promoted by the government does not ensure a quality job.
Figure 11: Number of Unemployment people24
21
http://www.eleconomista.es/economia/noticias/6851903/07/15/El-gasto-publico-de-Espana-se-situo-por-debajo-de-la-media-de-la-eurozona-y-la-UE-en-2014.html
22 http://blogs.cincodias.com/.a/6a00d8341c760153ef0168eb3695cb970c-pi
23 http://www.elmundo.es/economia/2016/01/05/568b7959e2704e41598b459c.html
21
In reference to a report25, relations between Spain and Latvia are improving both
importation and exportation of products. In following table, there are some data that they have been happened during last years:
YEAR EXPORTATION (€) IMPORTATION (€)
2006 49.605.283 77.000.274
2007 74.639.549 139.388.894
2008 90.373.761 101.637.499
2009 51.617.552 74.508.302
2010 71.440.354 80.037.300
2011 58.869.756 95.920.583
2012 51.034.890 156.111.378
2013 51.183.676 142.494.903
2014 118.798.371 151.258.765
Table 3: Exportation and Importation between Latvia and Spain26
2.3 SOCIAL FACTORS
The Spanish society is impoverished. There is greater poverty as a result of the decline in poverty. The vulnerability of social groups such as children is increasing. There is also a new type of poverty: energetic. The number of families which cannot afford to pay the electricity bill is increasing. The work is no longer safeguard poverty. Even if people have a job, they do not necessarily have enough to live on. Companies have increased exploited social advantages over doing the government's employment reforms. This means that there is increasing social inequality.
In addition, another of Spain's problems is the high rate of youth unemployment. Many people who finish their studies may not work in your area of study is Spain. So there is a massive emigration to other countries with more industry and employment, such as Germany, France and UK.
22 Figure 12: Unemployment and Dropout rates27
Spain has around 44.77 million Spanish citizens. In 2014 life expectancy in Spain increased to 82.98 years. That year life expectancy for women was 85.71 years, higher than that of men was 80.17 years. Spain has risen in the list of 191 countries for which published the life expectancy and has changed from the position 6 in 2013 to 4 in 2014. This means that its citizens have very high life expectancy in relation to other citizens of the world.28
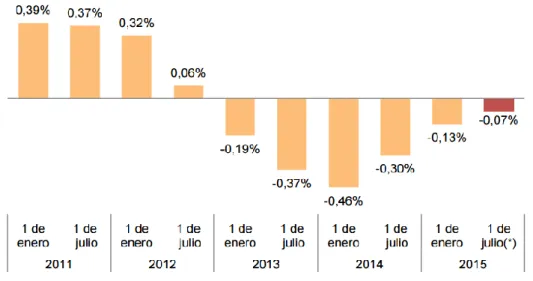
According to the Spanish National Institute of Statistics, the resident population in Spain stood at 46,600,949 inhabitants at 1January 2015, representing a decrease of 170,392 people compared with 2014.
Figure 13: Evolution of the Spanish Population (1995-2015)29
27http://circulodeempresarios.org/sites/default/files/estaticos/tasa_de_desempleo_juvenil_y_abandon
o_escolar-asi_esta_la_economia-abril_2014-circulo_de_empresarios.png
23
In relative terms, the population was reduced by 0.13 % during 2014, compared to the decrease of 0.46% recorded during 2013. The population rate has increased. The Spanish Economic crisis has transformed the high population growth in the country. The end of the economic crisis causes the ratio decreased but still keep losing Spanish inhabitants due to emigration to other countries still happening.
Figure 14: Population Annual Growth Evolution30
Spain is the fifth most populated country in European Union; However, its population density (92 inhab/Km2) is lower than most of Western European countries. The population density varies considerably from one area to another and is distributed in the following way:
Figure 15: Spanish Population density31
24
Spanish territory is organized into 17 autonomous communities and two autonomous cities. In reference to the number of inhabitants in each city, and the most populated cities are Madrid, Barcelona, Valencia and Seville.
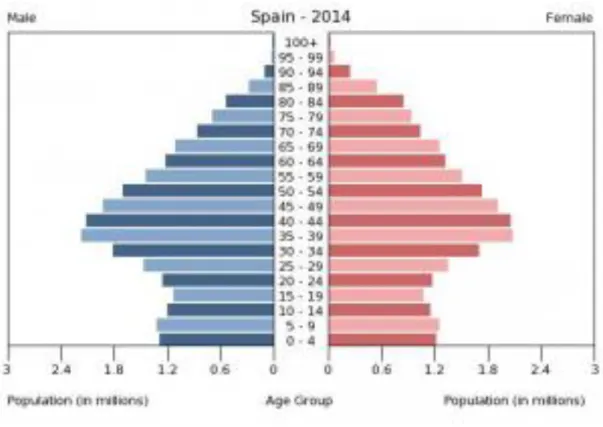
Currently Spain is a country where life expectancy is very high and has very low fertility rate. This makes the average age of people in Spain is around 43 years and that Spain is one of the oldest countries in the world. This information is showed in the following picture:
Figure 16: Pyramid of Spanish Population32
According to a study33, throughout last year, 304,623 foreigners (6.1% of the total) chose to leave Spain while Spanish 134,231 (0.3%) decided to return, as reflected in the data released by the National Statistics Institute (INE). The proportion of foreigners on the total population registered in Spain stood at 10.1%. The most numerous are the Romanians (751,208), followed by the British (282,120) and Italians (179,129). Among non-EU, there are the Moroccans (749,274), Chinese (191,341) and
31
http://image.slidesharecdn.com/01worlddistribpics-150428041023-conversion-gate01/95/world-population-distribution-16-638.jpg?cb=1430195432
32
http://enciclopedia.us.es/images/thumb/a/a8/SP_popgraph_2014.PNG/300px-SP_popgraph_2014.PNG
25
Ecuadorians (176,247). The most leave the country are foreigners from Romania, Ecuador and Colombia, and that increase are Chinese, Russian and Ukrainian. In addition, the birth rate in Spain was in 2014 of 9.14 %. In 2014, 427,595 children were born in Spain of which 220 843, the 51.64% were men and 206 752, the 48.35% were women. 34 In the other hand, mortality rate has increased to 8.46% deaths per 1000
citizens. This means that there were 5,411 more deaths than last year.35
To complete the study, Author’s thesis will analyse Human Development Index. HDI is an indicator of human development elaborated by the United Nations to measure the progress of a country for assessing log-term progress in three basic dimensions of human development:
Health, associated with life expectancy. Using a minimum value of 20 years and a maximum value of 83.57 years. And the rate is calculated using both values.
Education, it is measured by years of schooling for adults, which is considered to people who are 25 years and older, and expected years of schooling for children of school age, which is the total number of years of schooling a child of school-entry age can expect to receive if prevailing patterns of age-specific enrolment rates stay the same throughout the child's life.
Wealth or standard of living. It is measured by GNI per capita ($ PPP) instead of GDP per capita ($ PP) as was done previously. The minimum and maximum limits are 100 $ (PPP) and $ 87.478(PPP).
The higher the HDI, more consumption and more needs to be filled. Spanish HDI is 0.876 in 201436 and is ranked number 26.
2.4 TECHNOLOGICAL FACTORS
The technological environment is one of the external factors that decisively affect the business environment because the evolution of the how technology influences how they design, produce, distribute and sell goods and services. Some benefits of innovation technology are: Increased productivity, higher living standards, greater variety of products…
26
Spain is one of the countries of the European Union that less try to spend money on technological innovation in its products and services or to change the business structure to adapt to technological changes, according to the EU statistics office, Eurostat.37 The investment in I+D+I has been decreased since 2009. In this aspect it is in ninth place, with 30% of companies that have made the necessary changes, far from the leaders like Luxembourg, Denmark or Germany, countries where more than half of SMEs have changed their corporate structure to adapt to technological changes.
Spain also has a transport network of high quality. There is an excellent network of high-speed railway linking the big cities of the country to the capital in not too much time in safe and efficient way. For transportation within the country there are also different air routes connecting most of the cities. For communication with other countries, Spain has several maritime routes, with seaports such as Barcelona, Valencia, Vigo and Santander.
Internet use is fully spread throughout the country and is part of the daily life of the Spanish society. All public buildings and most households have internet. Many times there is internet in city centres.
2.5 ENVIRONMENTAL FACTORS
In recent years, society has begun to feel greater environmental concern to keep and prevent impacts on the environment, the threat of climate change or environmental degradation. They are joining technology companies, goods and services in order to prevent, limit or correct environmental possible damages in the water, air or land. Waste, noise and ecosystems are also a cause for concern. The government encourages environmental initiatives by granting subsidies and the financial penalties to those who do not meet environmental requirements. There are also some ISO norms developed by International Organization of Standardization. These norms stablish principles and procedures for environmental labels and declarations that certifiers and eco-labellers should follow.
In addition, it is necessary to discuss about ecological footprint, which is only an indicator of the environmental impact caused by human demand it is made of existing resources in the planet's ecosystems, linking it to the Earth's ecological capacity to
27
regenerate its resources. Ecological footprint is calculated using a ratio between production and consumption. The higher the footprint of a city or a country, the greater the environmental impact caused also.38
Finally, more and more consumers prefer to buy products that are related to processes or residues that are not harmful to the environment during the manufacturing process or once consumed. This is the reason that efforts should be made to avoid losing this market niche.
2.7 LEGAL FACTORS
In reference to European Marketing Guide39, the European Union (EU), also
known as the Community European Economic (EEC) was established by the Treaty of Rome, March 25, 1957. After gradual accessions, the EU has gradually expanded to become the trading bloc. The world's largest multinational. From 1 January 2007, the EU consists of 27 member countries, with about 490 million consumers.
The members of the European Union are: Austria, Belgium, Bulgaria, Cyprus, Czech Republic, Denmark, Estonia, Finland, France, Germany, Greece, Hungary, Ireland, Italy, Latvia, Lithuania, Luxembourg, Malta, Netherlands, Poland, Portugal, Romania, Slovakia, Slovenia, Spain, Switzerland and the United Kingdom.
Community countries accept the content of the laws and obligations that have to do with treaties and agreements European Union, including laws and regulations concerning processed foods. It is noteworthy that when there is no law or regulation throughout the Union, the laws of each member country apply, resulting in the use of various regulations.
As Author’s thesis found in main website of the Spanish Health Ministry40, to
introduce some non-animal’s products in Spain is necessary that The importer located in Spanish territory must be registered with the General Health Register of Food Businesses and Foods, according to Royal Decree 191/2011 of 18 February.
To introduce and market in the Spanish territory non-animal’s products of use and human consumption, it is necessary that compliance with Community
38 http://www.facua.org/es/guia.php?Id=105&capitulo=885
39 http://www.siicex.gob.pe/siicex/resources/calidad/Guia%20Requisitos%20Sanitarios%20UE.pdf 40http://www.msssi.gob.es/profesionales/saludPublica/sanidadExterior/controlesSanitarios/procedCont
28
legislation on hygiene of foodstuffs contained in Regulation (EC) No. 852/2004 and national legislation in force for each non-animal’s product.
Community law does not include drawing up a list of countries and establishments authorized to enter non-animal’s products. However, in accordance with Regulation (EC) No. 882/2004 on official controls on food, the Commission, if necessary, you can set conditions or detailed procedures including the establishment of a list of countries would include or authorized by product establishments. Nor set no general certification for the importation of non-animal food to the Community, however Regulation (EC) No. 882/2004 provides that the Commission, if necessary, can establish models of certificates accompanying imported consignments to the Community.
The verification of compliance with food legislation in the EU is by the respective officials of its member countries and its performance audit is conducted by officials from the European Commission. This entity has the authority to initiate legal action in the European Court of Justice against those Member States that do not comply with EU directives and regulations. Exporters should be aware of the existence of differences between EU countries in the implementation of its harmonized legislation with the EU. This may be caused by the lack of legal regulations to enforce a law or by the variation in the transition periods necessary to adjust the national laws of the EU.
The following information must be on the packaging product41:
Name of the commercialization product.
The list of ingredients in descending order by weight.
Allergens, which are establish in Directive 2003/89 / EC and entered into force on November 25, 2005. They are gluten, crustaceans, eggs, fish, peanuts, soybeans, milk and dairy products (including lactose), nuts, products derived from nuts, sesame seeds and sulphite at concentrations of at least 10mg per kilo or 10 mg / l, celery and mustard.
Expiry date.
Use instructions.
A mark identifying the batch.
29
2.9 CULTURAL FACTORS
Spain is a modern country with cultural differences according to regions of the country. Spanish is the official language, but in many on these regions exist other languages and customs which are very important to the citizens and they want to keep. This circumstance brings great wealth to our country.
In Spain the existence of the Mediterranean diet has shaped the lifestyle Spanish. It is a balanced and varied diet in which predominate foods derived from traditional crops: wheat, olives and vines. They characterized by low in saturated fat and cholesterol and high complex carbohydrates and fibre. Such a diet is characterized by Regular consumption of cereals, vegetables, fresh fruits, vegetables, fish, olive oil and nuts. Nowadays there is great concern for the health and recognize an adequate food as an instrument of protection of health and disease prevention.
Regarding religion, according to the Centre for Sociological Research most of the population of Spain (76.0 %) is Catholic, although the percentage of adherents is much lower, especially in the most generations.
2.10 PESTEL SUMMARY
Author’s thesis has analysed each of the factors developed in the previous sections and he has obtained the following result.
There is a change of political thought and a general dissatisfaction with the cases of corruption experienced in recent years but now these things are changing. Spain is emerging from the crisis a few years ago destroyed its economy, and the debt remains high but is shrinking.
Author’s thesis has to note the large number of unemployed people, which in recent months has been declining but using permanent contracts. It is noteworthy that many young people with a university education must seek employment in another country, population growth and a high HDI.
30
has important ports that communicate across Europe. As for communications networks, Spain 4G is already installed in the main system that allows the use of high speed internet.
Spain's population continues to grow and the Spanish people are increasingly concerned about the health and the fitness, to the point they begin to focus on every detail of their feed as components or energy values.
The legislation that is applied in Spain is the same as the European Union has and that their requirements will not cause problems for the company.
31
3
TARGET MARKET ANALYSIS.
At this stage Author’s thesis will describe the situation of cereals market and his target market. Author’s thesis will analyse in detail Milzu! customers and their needs and preferences, which allow him to make proper market segmentation. This market segmentation will allow him to identify potential customers, through characteristics that identify them, within and outside of their target market, and thereby obtain a better result in terms of sales and distribution of our products. After the market analysis is done, Author’s thesis will make an analysis of our competitors.
3.1 WHERE IS MILZU! NOWADAYS
MILZU! is a company that was founded in 2005. It currently has Latvian collaboration through the research and development agency of Latvia (LIAA). In addition, this company won the award for the brand of the year in Latvia 2014.
As Author’s thesis found on the website of the company42, their products could
find in the following supermarkets and shopping centres:
Rimi
Maxima
Stockmann
Elvi
Top!
Sky
Aibe
It means that the company sell his products in Latvia, Lithuania, Estonia, Poland, Bulgaria, Russia, Finland, Norway, and Switzerland.
Once the company expanded mainly through the Baltic countries and Eastern Europe, Author’s thesis is going to explain why MILZU! has to decide that it is time to expand into unexplored territory to grow into a renowned company in the European sector.
The country has been chosen by Author’s thesis is Spain. The election has been influenced by different aspects of the daily life of the citizens of this country.
32
Author’s thesis has mainly focused on the diet of the Spanish people because the company’s goal has a well relationship as it is varied, balanced and healthy. In addition, the Spanish concern for their physical appearance is increasing progressively. This can be seen through increased sign in in gyms or high spending on beauty products.
On the other hand, although Spain is slowly emerging from the economic crisis of recent years has the fifth largest economy in Europe after Germany, United Kingdom, France and Italy.
3.2 CEREALS MARKET OVERVIEW
3.2.1 GLOBAL CEREAL MARKET
The global breakfast cereals market, valued at $32.5 billion in 2012, is expected to grow at a compound annual growth rate of 4% for the next several years, reaching $43.2 billion in 2019, according to a new market report from Transparency Market Research. 43
The major factor responsible for the rapid growth of the global market for breakfast cereals is the growing requirement for convenience foods due to the busy and hectic lifestyles of a growing part of the global population. Moreover, the growing number of convenience stores and the growing preference for Western food habits in most of the developing countries in Asia Pacific is estimated to propel the global breakfast cereals market. In addition, the increasing per capita income of the population is further expected to fuel the market in the forecast period. However, the rising trend of preferring varied alternatives such as fruits, eggs, and other quick snacks is the key factor that is expected to hamper the growth of this market in the near future.
On the basis of type, the global breakfast cereals market has been divided into hot cereals and ready-to-eat cereals. Ready-to-eat cereals do not require any time for preparations, whereas hot cereals require some time to get cooked before they can be consumed. The ready-to-eat segment has gained traction owing to the hectic and busy lifestyles of consumers in European and North American countries. As a result, the ready-to-eat cereals segment accounted for a massive share in the global breakfast cereals market. On the other hand, the hot cereals segment is estimated to witness significant growth in Asia Pacific countries, as people there mostly prefer hot breakfasts at the start of the day. This segment is projected to hold a share of 18% in the global market.
33
On the basis of geography, the global market for breakfast cereals has been segmented into Asia Pacific, North America, Europe, and Rest of the World. Among all these regions, the Asia Pacific breakfast cereals market is anticipated to witness the highest growth rate compared with Europe and North America. Asia Pacific is estimated to hold a 13% share in the global breakfast cereals market by the end of 2019, whereas the market shares for Europe as well as North America is projected to drop throughout the forecast period. Among these countries, the China market for breakfast cereals is comparatively small; however, it is anticipated to register a higher growth rate than other countries.
Furthermore, the research report analyses the competitive landscape of the global breakfast cereals market based on company overview, inception details, product portfolio, business strategies, financial overview, and recent developments. Some of the prominent players operating in the global breakfast cereals market are PepsiCo, Kellogg Co., Cereal Partners Worldwide, Post Holdings, and General Mills.
Developed nations already have breakfast cereals as part of their regular course of meals. Increasing per capita income in developing countries is further giving the breakfast cereal industry a new dimension to look for.
Figure 17: Global Cereals Consumption44
34
3.2.2 SPANISH CEREALS MARKET
The production of breakfast cereals in Spain began in 1978 with the arrival of the world's leading, a large American multinational, Kellog’s. In the 80s, consumption was consolidated and nowadays they are products clearly settled in the diet of the Spanish people. The rates of growth of this market remain quite important and still feel like there is a good demand that is still increased.
In reference with Spanish Manufacturers Association of Cereal45, within the Spanish market, the breakfast cereal industry has experienced significant growth since its inception, and was in the decade of the 80s when consumption was consolidated. In 1993, grain production in Spain exceeded 20.000 tons, reaching 25.000 in 1997, which corresponds to approximately 600 million meals. Since then, consumption of breakfast cereals in our country has increased significantly.
In 2008, there was an increase of 3.5% in production of about 64 million kilos. Spanish people consume about 1.5 kilos of breakfast cereals per person per year (up to 50 meals) which, compared to 0.7 kilos that were consumed in 1997 (about 20 meals), represent more than doubled. The areas where there has been an increased consumption are Madrid and the southern part of its territory. Approximately 36% of cereals sold are sold in big supermarkets, while 28% is sold in supermarkets of medium size.
Despite the growth registered in Spain, the European average in terms of annual consumption is higher than the Spanish and is around 2.7 kilos per person, with Ireland, Sweden and Finland, countries with higher consumption above 7 kilos per person. In the US, the average consumption per person per year is in the 4.5 kilos.
Regarding breakfast cereals in our country, in descending order in terms of sales volume are adult cereals, which account for 51.2%, infant cereals (39.3%) and family cereals, 9.5%.
35 Figure 18: Distribution of Spanish Cereals Market46
Although consumption of the three types has experienced a significant increase, the more dynamic is recorded among adult cereals as a result of the coming of age of consumers in the 80s. This growth is causing major sector companies are developing new dietary presentations, high in fibre or functional in order to meet the needs of the population. In fact, cereals to watch your account for a considerable percentage of sales in the market for breakfast cereals today.
This is the case of cereal-based snacks fibre with a very high consumption despite high youth. From 2006 to 2009 the consumption of bars at home has increased from 9% to 13%. It means that 13% of Spanish households consumed bars in 2009, representing an average purchase of 1.1 kilos per year. Here, the chocolate cereals, granola combined and fibre are located. Finally, there are the functional cereal, puffed rice and cereals aimed at children.
3.3 TENDENCIES IN CONSUMPTION HABITS
Experts worldwide agree that breakfast is the most important meal of the day, for kids and adults alike. Ready-to-eat cereal ranks as one of the best choices available as part of a nutritious breakfast. Cereal is typically a low-fat, nutrient-dense food with many essential vitamins and minerals. And in addition to delivering important nutrients and essential vitamins such as iron, B vitamins and zinc, cereal also provides the important benefits of grains.
36
Spanish people have several meals each day. In the morning, people usually start with a light breakfast typically with coffee, sweet rolls, toasts or biscuits. Lunch is the main hot meal of the day. Between lunch and the evening meal people often have a snack late in the afternoon, for example a sandwich or some cereals. The traditional Spanish diet can be characterized as a typical Mediterranean diet. This term comes from the 1960s, when several studies suggested that Mediterranean countries had lower incidence of coronary heart disease.
The Mediterranean diet is characterised by a high intake of vegetables, pulses, fruits and cereals; a moderate to high intake of fish; a low intake of saturated fats but high intake of unsaturated fats, particularly olive oil; a low to moderate intake of dairy products, mostly cheese and yogurt; a low intake of meat; and a modest intake of ethanol, mostly as wine.
In the following images there is a pyramid that gives the frequency which Spanish people consume different types of food throughout the week and a graphic that shows daily consumptions of different food with its limits:
Figure 19: Pyramid of Spanish Consumption47
37 Figure 20: Consumption of different types of food48
In the previous image the blue bar represents daily consumption in Kg for one Spanish person and green bar is the minimum recommendation of intake for each kind of product. Author’s thesis thinks that cereals intake represents one of the most important meals in a Mediterranean diet and is at the same level as vegetables. In the following table Author’s thesis show different parameters according to Spanish consumption of cereals:
CERALS MARKET PARAMETERS MARKET 2014 % VARIATION
SALES VOLUME (KKG) 76.312,71 0,00%
SALES VALUE (K€) 308.922,12 -4,40%
CONSUME PER PERSON (kg) 1,7 1,10%
CONSUME SPENDING PER PERSON (€) 6,89 -3,40%
AVERAGE PRICE (€) 4,05 -4,50%
Figure 21: Cereals Consumption in Spain (Year 2014)49
38
3.3 TARGET MARKET SIZE (1)
The study of our Target market is a useful tool which helps us to quantify the size of potential consumers who might buy our product. That study is necessary to make a realistic business plan in order to make adequate market segmentation. For starting this task, Author’s thesis will analyse the population of Spain according to sex, age, residence, occupation and salary.
In reference to last data of Spanish Statistic Institute50, at 1st January of 2015, the population of Spain is 46.624.382 persons including 22.890.383 men and 23.733.999 women. These digits result in a distribution according with rate sex of 49,09 % men and 50,91% women. In the following table, Author’s thesis shows us the population according with autonomous community:
1 January 2015 AUTONOMOUS
COMMUNITY TOTAL MEN WOMEN % TOTAL
ANDALUCIA 8.399.043 4.144.532 4.254.511 18,01
ARAGON 1.317.847 652.687 665.160 2,83
ASTURIAS 1.051.229 502.175 549.054 2,25
BALEARIC ISLANDS 1.104.479 549.678 554.801 2,37
CANARY ISLANDS 2.100.306 1.043.203 1.057.103 4,5
CANTABRIA 585.179 284.788 300.391 1,26
CASTILLA Y LEON 2.472.052 1.219.616 1.252.436 5,3
CASTILLA - LA MANCHA 2.059.191 1.032.673 1.026.518 4,42
CATALUNYA 7.508.106 3.691.745 3.816.361 16,1
VALENCIAN COMUNITY 4.980.689 2.460.805 2.519.884 10,68
EXTREMADURA 1.092.997 542.078 550.919 2,34
GALICIA 2.732.347 1.317.054 1.415.293 5,86
COMMUNITY OF
MADRID 6.436.996 3.087.022 3.349.974 13,81 REGION OF MURCIA 1.467.288 735.434 731.854 3,15
NAVARRE 640.476 317.885 322.591 1,37
BASQUE COUNTRY 2.189.257 1.065.925 1.123.332 4,7
LA RIOJA 317.053 156.733 160.320 0,68
CEUTA 84.263 42.757 41.506 0,18
MELILLA 85.584 43.593 41.991 0,18
TOTAL SPAIN 46.624.382 22.890.383 23.733.999 100,00
Table 4: Population of Spain according with Autonomous Communities51
49
http://www.magrama.gob.es/es/alimentacion/temas/consumo-y-comercializacion-y-distribucion-alimentaria/informeconsumoalimentacion2014_tcm7-382148.pdf
39
Looking at the location of the population, according to the Ministry of Rural and Spanish Statistic Institute, about 80% of Spanish population live in urban areas and the remaining 20% live in rural areas. In the following picture Author’s thesis shows from largest to smallest cities with the highest number of inhabitants.
CITY POPULATION CITY POPULATION
Madrid 3.141.991 Mallorca 400.578
Barcelona 1.604.555 Las Palmas 379.766
Valencia 786.189 Bilbao 345.141
Sevilla 693.878 Alicante 328.648
Zaragoza 664.953 Córdoba 327.362
Málaga 569.130 Valladolid 303.905
Murcia 439.889 Vigo 294.098
Table 5: Largest Cities in Spain by Population52
The distribution of population by age and sex is indicated in the Annexes. Taking into account the characteristics of the products that MILZU! might be offer to its customers, Author’s thesis is going to make another distribution by age according with data that has found at Spanish Statistic Institute53:
AGE TOTAL MEN WOMEN
0 to 4 2.230.847 1.147.833 1.083.014
5 to 14 4.789.077 2.459.495 2.329.582
15 to 24 4.509.654 2.308.070 2.201.584
25 to 39 10.013.672 5.066.490 4.947.182
40 to 54 11.021.961 5.553.725 5.468.236
55 or more 14.059.171 6.354.770 7.704.401
TOTAL 46.624.382 22.890.383 23.733.999
Table 6: Spanish Population according to age ranges54
52 http://www.ine.es/prensa/np960.pdf 53http://www.ine.es
40
The first age range that Author’s thesis can consider (0 to 4) are babies and young children. This range should be less because babies can’t eat any of us products, but Author’s thesis hasn’t got more data to complete that table, so that Author’s thesis consider fewer amounts of people later. Moreover, Author’s thesis can introduce children from 2 years to 4 years in the next range. Next three age ranges (5 to 14, 15 to 24, and 25 to 39) are the most important in our study, because most of the consumption of cereals in any place is eaten by these age ranges. In addition, Author’s thesis has decided to divide these age ranges in three because Milzu company has several different kinds of cereals for each of these three age ranges. Author’s thesis has decided to separate next age range (40 to 54) from the previous one because necessities at those ages might be change. And the last age range (55 or more) is old people, and the consumption of cereals is not popular, so that the market size will be small in this case.
Among all these age ranges, Author’s thesis knows that main customers will be children because they are the main consumers of this product, and Spanish adult women, since they have the mentality to eat healthy to keep their diet and stay on good physical shape. According to tendencies in consumption habits, it is also true that cereal brands now are focusing on developing products for adults rather than children, because it is being observed that the consumption of cereals in these age ranges has increased considerably.
According with the market analysis Author’s thesis has just done, it is possible to think in an approximate number of people whom might be the potential customers in Spain. In Author’s thesis potential market, he is going to consider the following segmentations:
1. All children and teenagers between two and fourteen years.
2.230. 847 x 50% (half children between 0 to 4 years) + 4.789.077 (children and teenagers)
Total 1 = 5.904.500 people
2. Large proportion of teenagers between fifteen and twenty-four years.
4.509.654 x 70% (large proportion)
41
3. A small part of men adults between twenty-five and thirty-nine years
5.066.490 (only men) x 20% (small part)
Total 3 = 1.013.298 people
4. Most women between twenty-five to fifty-four years.
[4.947.182 (women between 25 to 39) + 5.468.236 (women between 40 to 54)] x 80% (most of these women)
Total 4 = 8.332.334 people
5. A small part of adult people older than fifty-five.
14.059.171(adult people older than 54) x 20% (small part)
Total 5 = 2.811.835 people
When Author’s thesis adds all these segments, the total market volume is:
TOTAL POTENTIAL MARKET VOLUME = 21.218.725 people
3.4 INTRODUCTION CEREALS PROCEDURE
For introducing MILZU! in Spain, Author’s thesis needs to find a distributor able to spread out quickly all products. According with Author’s thesis studies, this brand is distributed in the Baltics Countries using distribution networks of supermarkets. They have not specialized in creating its own network because this would be very expensive for the company. The goal of expansion in Spain is to get a reliable number of points of sale and with great acceptance and use by the Spanish people have discussed in the previous section.
42
Author’s thesis thinks that Consumer Goods market in Spain is dominated by 10 channels of distribution: Mercadona, Carrefour, DIA, Supers Eroski, Lidl, Alcampo, Consum, Hiper Eroski, Caprabo and Ahorramás. This ten teach swept the 52.9% of sales in 2014, 1.8% more than in 2013.55
Then, Author’s thesis is going to explain different parameters and he will show different data which he is making references:
3.4.1 MARKET SHARE
Market share is the percentage of an industry or market's total sales that is earned by a particular company over a specified time period.
Market share is calculated by taking the company's sales over the period and dividing it by the total sales of the industry over the same period. This metric is used to give a general idea of the size of a company to its market and its competitors.56
COMPANIES % MARKET SHARE 2013 % MARKET SHARE 2014
MERCADONA 21,5% 22,1%
CARREFOUR 7,5% 7,7%
DIA 7,4% 7,6%
EROSKI SUPERS 3,1% 3,3%
LIDL 2,7% 3,1%
ALCAMPO 2,9% 2,8%
CONSUM 1,7% 1,9%
EROSKI HIPER 1,5% 1,6%
AHORRAMAS 1,5% 1,5%
CAPRABO 1,3% 1,3%
EL CORTE INGLES 1% 1%
Table 7: % Market Share according with supermarket in Spain57
As Author’s thesis shows in the above table, Mercadona has highest presence in the market with 22.1% share. Follow him, but far behind, are Carrefour and DIA but
55
http://www.libremercado.com/2015-02-06/mercadona-se-come-a-la-competencia-pero-lidl-es-el-que-mas-crece-1276540015/
56
http://www.libremercado.com/2015-02-06/mercadona-se-come-a-la-competencia-pero-lidl-es-el-que-mas-crece-1276540015/
43
with one-third part of Mercadona. However, the company has grown in the last year has been Lidl and thanks to its policy of deals are getting better results.
The remaining approximately 50% is for small companies, which haven’t got enough market share to name them. Author’s thesis has also included El Corte Ingles because is another important supermarket in Spain, but Author’s thesis couldn’t find its market share.
3.4.2 NUMBER OF SHOPS
In Spain, the universe of supermarkets is very different in each autonomous community.In countries such as Portugal or the United Kingdom a few large operator’s controls more than 80% market share in Spain local chains and small distribution companies still spread over about 42% of the market.
That’s why it is very important looking at the number of stores has every supermarket in Spain, Author’s thesis analyses what areas can reach Milzu product58.
COMPANIES NUMBER OF SHOPS
MERCADONA 1.500
CARREFOUR 471
DIA 4.237
EROSKI SUPERS 1.279
LIDL 530
ALCAMPO 56
CONSUM 644
EROSKI HIPER 90
AHORRAMAS 280
CAPRABO 364
EL CORTE INGLES 300
Table 8: Number of shops for biggest supermarket in Spain59
Author’s thesis shows that the business with the highest number of shops is DIA. This is due to the acquisition made another major supermarket chain recently, and is what has allowed it to increase its market share.
44
3.4.3 VARIETY OF BRAND
Customers can value positively that there is variety in the brands. In addition, Milzu products can only be offered on the premises of the companies that have a wide variety of brands, since the rest of the companies will not be willing to offer them because that would change its policy action.
Mercadona and Dia are the most restricted supermarkets to introduce new products in their places, because they want to have their own products and Milzu would need to make its products like a white brand for them before they could sell them.
Other supermarkets do not have this problem and Milzu may sell our products directly to the customer. These kinds of supermarkets make things easier and they would start to make its company know in all Spain quickly.
3.4.4 ONLINE POSITION
E-commerce is growing rapidly in Spain, which does not make it easy to set up an online store, especially when it assumes sells physical goods and logistics. According to a study, food moves 3.7% of money allocated to e-commerce in Spain.60
Because this market is growing, this may be a good parameter to choose a supermarket. It is preferable that the supermarket has online commerce to increase Milzu distribution. According to research61, in Spain there are 14 million Internet users
who made purchases online. The profile of the average user making the online purchase is between 31 and 45 years with children and gainfully employed.
60
http://www.elalmiar.com/noticia-221-por-qu%C3%A9-no-han-despegado-a%C3%BAn-los-supermercados-online.html
61
45 Figure 22: Supermarket e-commerce sales62
Author’s thesis shows that companies that do not have online sales are Lidl and Eroski. In addition, the company leading the market is Mercadona, followed by El Corte Ingles far behind63.
3.4.5 PRICE LEVEL
When choosing a supermarket, people always take into account the price level they have, for example, which will cost them throughout the year make the purchase in a particular supermarket. Below is a table with the price level of a basket of the average purchase throughout the year is attached.
62 Author’s original
63
http://ecommerce-news.es/actualidad/mercadona-acapara-casi-la-mitad-de-la-facturacion-en-alimentacion-online-18277.html# 0
20 40 60 80 100 120 140 160
46
COMPANIES ANNUAL COST SHOPPING CART
MERCADONA 5.857 €
CARREFOUR 5.904 €
DIA 5.985 €
EROSKI SUPERS 6.123 €
LIDL -
ALCAMPO 5.629 €
CONSUM 6.004 €
EROSKI HIPER 6.123 €
AHORRAMAS 6.016 €
CAPRABO 6.275 €
EL CORTE INGLES 6.422 €
Table 9: Average Monthly money destined to food basket64
The table shows that the supermarket with the lowest price level is Alcampo, followed by Mercadona and Carrefour respectively, but with a difference of about two hundred euros’ consumption more. Those three supermarkets would lump them in the lower price range.
Then Author’s thesis finds supermarkets with average price level, which are Dia, Consum, Ahorramas and Eroski. The remaining supermarkets, Caprabo and El Corte English, are supermarkets with a high price level.
47
3.4.6 POPULAR LEVEL
The level of popularity of supermarkets also affects our study. In this case the valuation that Author’s thesis do is more subjective than in the other sections.
The level of popularity depends on the image that the company gives to consumers. In Author’s thesis opinion, he thinks the most popular is Mercadona supermarket because it is a Spanish company that has emerged for many years and yet has achieved a large market share. This company has a reputation for treating employees well, with good salaries, good labour policy, etc. It should also be noted that Mercadona has never used the media to promote themselves, but how they act is by word of mouth.
Another supermarket that can be very popular also for being Spanish is El Corte English. This supermarket, despite being the highest price level, also is reputed to have high quality products. In addition, the company began as a clothing store and spread to other areas of trade.
The other best-known company is Carrefour. It is a French company that monopolizes between the two countries a market shares close to 70%. It also has its other business models focused on clothes and in Spain is widespread.
The other supermarkets are also known because of the efforts made related to advertising, most campaigns to promote discount to attract new consumers.
3.4.7 FINAL PARAMETRES ANALYSIS
To conclude this section, Author’s thesis has decided to include a summary table which will help him to choose which supermarket (or supermarkets) is the best one to market Milzu products in Spain. Author’s thesis is going to choose the supermarkets that he considers with the best parameters to introduce Milzu! in Spain.
48 Figure 23: Supermarket Parameters Analysis Summary65
The graphic shows that Mercadona is the best option to start a business in Spain. However, there is a problem with its marketing policy because this company does not accept to sell a product in its supermarkets if the product is not a white brand inside the company. Author’s thesis cannot refuse Mercadona option because this company has the most market share in Spain and he cannot choose either. In order to solve this problem, Author’s thesis is going to choose the second best option among he has chosen, it means Carrefour.
65 Author’s original, Annexes
0 0,5 1 1,5 2 2,5 3 3,5 4 MARKET
SHARE
NUMBER OF SHOPS
VARIETY OF BRAND
ONLINE POSITION PRICE LEVEL
POPULAR LEVEL