Corporate Governance and Performance during the Aftermath of the 1994 Mexican Crisis
KAREN WATKINS∗ DICK VAN DIJK
JAAP SPRONK
Abstract
Good corporate governance arrangements have been associated with high
performance. This paper studies the effects of family, bank, and business group ties on
Mexican firm performance during the period 1995-1997. Two performance variables are
taken into account for robustness reasons: return on assets and profit margin on sales.
Results show that companies with positive corporate governance schemes performed better
than the rest during this period.
Resumen
Buenos mecanismos de gobierno corporativo se relacionan con buen desempeño
empresarial. Este artículo estudia los efectos de los vínculos familiares, bancarios y
empresariales en el desempeño de las empresas mexicanas durante el período 1995-1997.
Dos variables de desempeño son empleadas por razones de solidez: retorno sobre los
activos y margen de ventas. Los resultados muestran que durante este período, el
desempeño de las firmas con mejores estructuras de gobierno corporativo fue más favorable
que para las demás.
∗ Karen Watkins Universidad Popular Autónoma del Estado de Puebla. Tel: +52 222 2299400, ext. 678;
Palabras clave: gobierno corporativo, desempeño empresarial Clasificación JEL: G34, D82, L25
1. Introduction
The Mexican 1994 economic crisis started with the devaluation of the Mexican peso, on
December 20th, 1994. This unexpected event took place in a setting of fixed exchange rate
regime, low inflation, fiscal surplus, and large foreign reserves. During 1994 Mexican
authorities were confident about the stability of the economy; nevertheless, the growing
current account deficit and political shocks during that year generated strong capital
outflows. The outcome was a shift to a floating exchange rate regime, devaluation of more
than 100%, inflation of around 50%, and recession. During 1995 real GDP declined 10%,
interest rates rose considerably in order to avoid further devaluation, and credit was
reduced.
Mexican companies were forced to adapt to the new circumstances, or declare
bankruptcy. As a consequence of the currency devaluation and the rise in domestic interest
rates, companies´ peso and dollar denominated debt increased in real terms. In addition,
firms faced cash constraints as internal demand dropped and credit was restricted. The
outcome for Mexican firms was mixed: some firms survived the crisis, others did not, and
some even benefited from it.
The explanations for Mexican companies´ differences in performance after the 1994
economic crisis derive from two sources: financial and operational robustness prior to the
crisis, and corporate governance schemes. The first of these streams relate to initial
conditions; for instance, profitable firms with low debt levels had better odds to survive the
corporate governance schemes, recent studies on the 1997 Asian financial crisis have
proved that good corporate governance improves performance (see Mitton, 2002, and Kim
and Lee, 2003).
Our paper adds further insight into the role of corporate governance in the aftermath of
economic crises, by examining the Mexican case. In particular, we consider the influence of
corporate governance arrangements such as bank, business, and family ties on firm
performance during the immediate period after the crisis: 1995 to 1997. Mexico’s industrial
environment has been characterized as one with diversified firms, controlled by few
influential families, who possess ties with the government and banks (see Castañeda, 2002).
For robustness reasons we take into account two performance measures: return on assets
(ROA) and profit margin on sales (PROFIT). Although several papers have analysed
corporate governance effects on performance (see Claessens et al., 2000), to the best of our
knowledge there is none related to the aftermath of the Mexican 1994 crisis. We believe
this is due to the lack of publicly available corporate governance data, and the difficulty to
obtain historic financial information. We have built a unique database for 176 listed
non-financial companies using five sources: Mexican Securities Market’s (BMV) online
resources, microfilms at BMV for historic data, Annual Financial Facts and Figures
(published by BMV), and electronic devices such as SIVA and Infosel-Financiero.
Our main result is that firms with good corporate governance schemes performed
considerably better than others during the period 1995-1997. In particular, belonging to
diversified business groups favoured performance, while having bank or family ties was
prejudicial for firms.
The paper is organized as follows. Section 2 deals with the theory on corporate
employed. Section 4 discusses the results, which are based on a dynamic panel data model
with random effects. Section 5 concludes.
2. Theory and Hypotheses
Corporate governance can be defined as a collection of procedures that provide
protection for companies´ stakeholders. In the words of Kose and Senbet (1998),
¨Corporate governance deals with mechanisms by which stakeholders (equity holders,
creditors, and other claimants who supply capital, as well as employees, consumers,
suppliers, and the government) of a corporation exercise control over corporate insiders and
management such that their interests are protected¨. This relates to the agent-principal
problem, as described by Jensen and Meckling (1976) and Myers (1977).
Agency costs can be reduced through different governance mechanisms. Boubakri
et al. (2005) classify these mechanisms as internal and external. Internal governance
mechanisms relate to ownership structure (such as ownership concentration); external
mechanisms refer to the legal system, labour markets (such as markets for outside directors
competing in reputation as experts in monitoring CEO´s; see Fama and Jensen, 1983), and
takeover markets (markets for corporate control).
For the purpose of this paper we focus on internal governance mechanisms, which
are directly controlled by a firm. We classify ownership structure into three sub-categories,
according to available information for Mexican firms: independent, family ownership, and
informal ownership. Independent firms are those having no family, business, or bank links.
By family ownership we refer to companies where two or more members of the board of
This is a proxy for companies where the majority of equity is held by the same family.
Informal ownership relates to companies having group or bank links, which implies that not
only direct stakeholders have power over the decisions of the firm. Ownership
concentration is not a publicly available variable in Mexico, therefore it is excluded from
the analysis.
Bennedsen and Wolfenzon (2000), and Maury (2005), claim that when investor
protection is poor (meaning external governance mechanisms are weak), family controlled
companies become attractive as the private benefits of control represent a relevant share of
the company's value. Then, under these conditions it is easier to expropriate minority
shareholders. Authors such as Alba et al. (2003), Lee (1998), and Baek et al. (2004) have
related concentration of ownership in family hands with poor performance (as in Thailand
and Korea, late 1990´s). The argument behind this is that inexperienced family members,
instead of professional managers, usually take control of these types of firms. On the same
line, Kim and Lee (2003), and Mitton (2002) argue that during the Asian crisis companies
with lower proportion of outside ownership performed worse than the rest. In order to
reduce to some degree this outcome, in Mexico the Code of Corporate Governance
recommends at least 20% of directors for listed companies to be outsiders (see Dahyaa and
McConnell, 2004). This derives our first hypothesis: Firms having family ties performed
worse than those without during the period 1995-1997.
Diversified companies and conglomerates stabilize aggregate profits, which is
important in countries with incipient capital markets like the Mexican (see Aoki, 2001). In
times of crisis performance for these companies can be better than for independent ones,
which favours the risk diversification argument (see Claessens et al., 2000). This argument
during the Mexican crisis, internal capital markets permitted the flow of funds from
booming companies (mainly exporting firms) to the rest of the economy. These business
groups favoured the survival of many companies, as they improved capital allocation. We
can add that being part of a diversified business group can stabilize aggregate sales, due to
internal group trading. In addition, within the groups there are important governance
functions. As stated by Khanna and Palepu (1996), these networks support internal trade
and ensure close monitoring of management. On a similar line, Claessens et al. (2000)
point out that after the Asian crisis, firms belonging to diversified business groups had 3%
higher market valuations than the rest. This brings out our second hypothesis: Firms
belonging to diversified business groups performed better than other firms during the
period 1995-1997.
The recent East Asian downturn has shown that during crises companies with bank
links perform worse than independent ones, in particular in countries where regulation is
poor. As stated by Lee (1998), Claessens et al. (2000), and Morck and Nakamura (1999),
Asian firms having bank ties were extremely leveraged before the 1997 crisis. This
increased their vulnerability to shocks, and made them more susceptible to agency costs of
debt (see Kim and Lee, 2003). These companies were exposed to higher risk levels than
the rest, and were able to obtain credit to finance losses. Instead of monitoring and
disciplining them, banks acted as firms’ accomplices. In addition, as firms relied heavily
on banks for financing their investments, when banks faced financial troubles, even
profitable firms were not able to obtain credit (see Baek et al., 2004). This generates our
third hypothesis to test: In Mexico, bank links had a negative impact on firms´
3. Data
3.1 Sample, data sources, and variables
Last quarter non-balanced data (from 1995 till 1997) for all listed non-financial
firms (176 in total) is extracted from the Mexican Securities Market (BMV). Firms that
were not listed at least during one of this after crisis years are not taken into account, as the
interest of the paper is to study corporate governance effects on firm performance during
the aftermath of the crisis. Two sources of data from electronic systems are used: SIVA
(Integrated System of Automated Securities) and Infosel-Financiero. Data for firms who
are not currently listed on the market, and historic data is extracted through microfilms at
BMV. The list of board of directors (for 1994) is obtained through the Annual Financial
Facts and Figures, published by BMV. All monetary variables are presented in real terms
(Mexican pesos of the year 2000).
Corporate governance variables are introduced as dummies for group affiliation (two or
more board members of a firm sitting on the board of at least another listed firm, whatever
their position), bank linkages (at least one of the firm’s board members belongs to the
directorate of one or more banks), and family ties (two or more members of the board
having the same first and second last names, meaning they are brothers or sisters). Groups
are further described as diversified and not diversified groups. As for the definition of a
diversified group, it is considered as one that is composed of many firms (at least fifteen,
for internal capital and trade markets argument), from all sizes and industries (risk
diversification), with at least one export-oriented company (50% or more of sales outside
foreign stock markets through American Depository Receipts (foreign financing and better
accounting procedures, which favours good corporate governance).
Return on assets (ROA) is defined as the ratio of EBIT to total assets; to reduce the
weight of extreme observations in the econometric analysis, ROA values higher than 20%
in absolute value have been excluded. Profit margin on sales (PROFIT) is defined as EBIT
+ depreciation and amortization, over net sales. Tobin’s Q is not employed as a measure of
performance: being a market based measure, it is not an adequate indicator in countries
with incipient capital markets like the Mexican. In addition, this ratio is not available for
the complete sample of Mexican companies, as some firms were not quoted during 1995
(but their information was public since they issued bonds or commercial paper in BMV; see
Castañeda, 2005).
Three size dummies, arranged according to market assets´ value, are introduced. Small
companies are considered as those with less than $1,000,000 in assets; medium firms
possess between $1,000,000 and $10,000,000 in assets; big enterprises consist of
companies with more than $10,000,000 in assets. In addition, seven industry categories are
employed to capture size and industry specific effects; for instance, it is expected that
during crises small companies have more financial constraints than the rest (see Titman and
Wessels, 1998), and industries such as the services sector depend more on the local
economy. In fact, industry effects usually predict between 17 and 20% of financial
performance (see Coles et al., 2001). In addition, control variables for performance such as
productivity (net sales over net capital stock; it is associated with higher performance),
foreign-denominated debt over total debt (foreign debt makes a firm more vulnerable to
fluctuations in the economy), cash flows over total assets (the greater, the higher the
during crises), and leverage (total debt over equity; as it increases, so does the exposure to
shocks and the amount of agency costs of debt - see Berger and Bonaccorsi di Patti, 2005)
are used.
3.2. Descriptive statistics
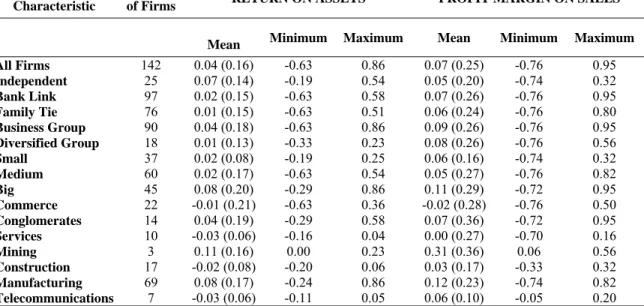
Table 1 presents descriptive statistics for return on assets and profit margin on sales,
during the immediate post-crisis year. In 1995 there were 142 quoted firms, which are
classified as independent, or having bank, family, or business ties (diversified or not).
These companies are further grouped according to size and industry.
Table 1:
Descriptive statistics for the year 1995
Firm Characteristic
Number
of Firms RETURN ON ASSETS PROFIT MARGIN ON SALES
Mean Minimum Maximum Mean Minimum Maximum
All Firms 142 0.04 (0.16) -0.63 0.86 0.07 (0.25) -0.76 0.95
Independent 25 0.07 (0.14) -0.19 0.54 0.05 (0.20) -0.74 0.32
Bank Link 97 0.02 (0.15) -0.63 0.58 0.07 (0.26) -0.76 0.95
Family Tie 76 0.01 (0.15) -0.63 0.51 0.06 (0.24) -0.76 0.80
Business Group 90 0.04 (0.18) -0.63 0.86 0.09 (0.26) -0.76 0.95
Diversified Group 18 0.01 (0.13) -0.33 0.23 0.08 (0.26) -0.76 0.56
Small 37 0.02 (0.08) -0.19 0.25 0.06 (0.16) -0.74 0.32
Medium 60 0.02 (0.17) -0.63 0.54 0.05 (0.27) -0.76 0.82
Big 45 0.08 (0.20) -0.29 0.86 0.11 (0.29) -0.72 0.95
Commerce 22 -0.01 (0.21) -0.63 0.36 -0.02 (0.28) -0.76 0.50
Conglomerates 14 0.04 (0.19) -0.29 0.58 0.07 (0.36) -0.72 0.95
Services 10 -0.03 (0.06) -0.16 0.04 0.00 (0.27) -0.70 0.16
Mining 3 0.11 (0.16) 0.00 0.23 0.31 (0.36) 0.06 0.56
Construction 17 -0.02 (0.08) -0.20 0.06 0.03 (0.17) -0.33 0.32
Manufacturing 69 0.08 (0.17) -0.24 0.86 0.12 (0.23) -0.74 0.82
Telecommunications 7 -0.03 (0.06) -0.11 0.05 0.06 (0.10) -0.05 0.20
Table 1 presents descriptive statistics (year 1995) for the two performance variables of interest: RETURN ON ASSETS and PROFIT MARGIN ON SALES. Values equal or greater than one in absolute value have been excluded as outliers. Firms are classified as independent, or having bank, family, or group (diversified and not) links. Companies are further grouped according to size and industry. Standard deviation is shown in parenthesis.
During the year 1995, the average return on assets and profit margin on sales were
values for ROA and PROFIT were 0.07 and 0.12 (according to information from BMV, see
Table 2). This reflects that due to the crisis, on average performance declined substantially
during the immediate aftermath year 1995. However, this conclusion is not accurate for all
types of firms. For example, independent companies seem to outperform firms in all other
categories, with an average ROA of 0.07. The same is true for companies belonging to
business groups, as they present profit margin on sales of 0.09. On the lower end are
companies with family and bank ties, with ROA of 0.01 and 0.02, respectively.
Table 2:
Descriptive statistics for the period 1990-2000
ROA PROFIT
Period Mean Standard
Deviation Mean
Standard Deviation
1990 0.07 0.08 0.13 0.14
1991 0.08 0.07 0.15 0.12
1992 0.06 0.07 0.13 0.15
1993 0.07 0.11 0.12 0.15
1994 0.00 0.14 0.01 0.23
1995 0.04 0.16 0.07 0.25
1996 0.05 0.16 0.11 0.24
1997 0.05 0.12 0.14 0.17
1998 0.04 0.12 0.10 0.17
1999 0.05 0.12 0.14 0.16
2000 0.05 0.16 0.13 0.19
Table 2 presents mean values (years 1990-2000) for the two performance variables of interest: RETURN ON ASSETS and PROFIT MARGIN ON SALES. Values equal or greater than one in absolute value have been excluded as outliers.
These results are in general consistent with the theory, except for the case of
independent companies. According to the corporate governance literature for emerging
market economies, companies belonging to business groups perform better than
independent ones in times of crisis; see Claessens, Djankov, and Xu, 2000. However,
independent companies in Mexico have initial advantages over the rest of firms, which
export-oriented. In particular, these types of companies performed better than others due to
the positive impact of the devaluation of the Mexican peso; their average PROFIT during
1995 was 0.12. Second, more than half (56%) of the independent companies in the sample
are big. As explained in the next paragraph, big companies have less financial and
operational constraints than the rest.
From table 1 it becomes evident that there are size and industry effects on
performance during 1995. Big companies performed much better than the rest during the
crisis, which can be attributed to their greater operational and financial flexibility. In times
of crisis, scarce credit is assigned mainly to the biggest (and perhaps not the most
profitable) companies. For instance, prior to the Mexican 1994 crisis, big companies were
less leveraged than others. This relationship changed during the crisis period, when small
firms became the least leveraged. Considering that small firms’ equity declined on average
16% during the time, there is evidence of an important credit crunch for small firms.
On an industry basis, the best performing sectors were mining, manufacturing and
conglomerates. The mining industry does not depend as much as the rest on the local
economy, as it exports most of its products (and their prices are fixed in international
markets). Therefore, it is not surprising that the Mexican crisis practically had no impact
on its aftermath results. Manufacturing also depends less than other sectors on the
domestic demand, as an important proportion of its products are sold in external markets.
As for conglomerates, in times of crisis they serve as an insurance, for their diversification
stabilizes aggregate profits. During the crisis period exports grew on average 104% for the
manufacturing industry, and 180% for conglomerates. Services, commerce, construction,
and telecommunications are more connected to the local economy; therefore internal
4. Regression results
In this section, the relationship between firm performance and corporate governance
schemes is analysed. Table 3 displays results from estimating a dynamic random effects
panel data model, using the Swamy-Arora estimator of the component variances. The
reported t-values are based on standard errors that are robust to cross-sectional
heteroskedasticity, so random effects can be employed. Time fixed effects are also
introduced, in order to study the dynamics of performance during the immediate post-crisis
years. ROA values greater than 0.20 in absolute value are treated as outliers, as in
aftermath crisis years it is expected performance to be low. In fact, the median ROA for
the period 1995-1997 is 0.04. The sample includes data from 1995 till 1997, which reflects
the crisis aftermath period.
Table 3:
Firm performance and corporate governance arrangements
VARIABLE RETURN ON ASSETS
PROFIT MARGIN ON SALES
Bank Link -0.01**** (-1.46) -0.04** (-1.93) Family Tie -0.01**** (-1.50) -0.03* (-4.47) Business Group 0.01**** (1.56) 0.02 (1.23) Diversified Group 0.03* (6.51) 0.07* (3.72) Small 0.01*** (1.63) 0.00 (-0.09) Big 0.00 (0.48) -0.03 (-1.33) Commerce 0.03 (1.00) 0.00 (0.02) Conglomerates 0.01 (0.19) -0.08 (-1.31) Services -0.01 (-0.10) -0.06 (-1.20) Construction 0.01 (0.36) 0.03 (0.36) Manufacturing 0.06* (2.36) 0.04 (0.46) Telecommunications 0.00 (-0.37) 0.05 (0.61) Productivity (-1) 0.01* (2.70) 0.00 (-0.18) Foreign Debt (-1)/Total Debt (-1) 0.00 (-0.25) 0.02* (4.71) Cash Flows (-1)/Total Assets (-1) 0.11* (3.69) 0.30* (5.66) Leverage (-1) 0.00 (-0.56) 0.00 (-0.41) Period=1996 0.02* (6.70) 0.04* (16.18) Period=1997 0.02* (3.61) 0.06* (5.58) ROA (-1) 0.03* (4.41)
PROFIT (-1) 0.02*** (1.52)
*, **, ***, **** Significant at 1%, 5%, 10%, and 15% levels, respectively.
From table 3 the main conclusion is that internal corporate governance arrangements did
influence Mexican firm performance during the period 1995-1997. Consistent with the
literature, having bank or family ties was prejudicial for companies, while belonging to
business groups (particularly diversified business groups) favoured performance.
Companies participating in diversified business groups had several advantages over
the rest of firms. First of all, they created efficient internal capital markets, as described by
Castañeda (2002). From the publicly available data published by BMV, it is evident that
these firms had twice the amount of trade credit compared to the rest of companies.
Second, this data shows that there was an important flow of internal trade taking place.
Specifically, during 1995 companies from diversified business groups had three times more
net sales than the other firms, which means they did not face such a sharp drop in demand.
These companies acted like a small economy, creating their own demand and supply, and
therefore they were not so much exposed to the local economic downturn.
In general there are not significant differences in performance according to size or
industry indicators. Therefore, it seems that internal corporate governance variables are
more powerful explaining performance during the aftermath period, compared to size or
All control variables taken into account are significant, except for leverage.
Productivity and cash flows over total assets present the expected signs, however foreign
debt over total debt has opposite sign. Lagged ROA and PROFIT are significant and
positive, which reflects the influence of initial conditions on performance. Time effects,
which are introduced in the regressions by including the periods 1996 and 1997 are also
significant and positive, which indicate recovery.
5. Conclusions
Poor corporate governance arrangements are related to lower performance and firm
value. This is particularly true in times of crisis, when stakeholders are less confident about
firms´ robustness, and expropriation is more feasible. In these circumstances nervous
agents take their money away from companies with poor corporate governance, which
further deteriorates firm value. In contrast, companies with good corporate governance
schemes have better odds of surviving an economic downturn.
As expected, the Mexican 1994 currency crisis had larger aftermath effects on
companies with poor corporate governance schemes. We have shown that firms having
bank or family links performed worse than those without them, and that companies
belonging to diversified business groups were the least injured during the economic
downturn. Initial conditions were also important in explaining performance during the
period 1995-1997, as shown by the positive results of independent firms. These companies
were mainly export-oriented and big, which represents an advantage over the rest of firms.
From these conclusions we derive several recommendations for Mexican
local and international markets. 2) To participate in international financial markets
through American Depository Receipts. 3) To create networks with other companies, with
the objective of building diversified business groups. 4) To rely more on equity and trade
credit than on bank financing. 5) To hire managers according to experience and aptitude,
and not based on family attributes.
References
1. Alba, P., Claessens, S., & Djankov, S. (2003) ¨Thailand’s corporate financing and
governance structures¨, The World Bank, Policy Research Working Paper,
Washington.
2. Aoki, M. (2001) ¨Toward a comparative institutional analysis¨, MIT Press,
Massachusetts.
3. Baek, J.S., Kang, J.K, & Park, K.S. (2004) ¨Corporate governance and firm value:
Evidence from the Korean financial crisis¨, Journal of Financial Economics 71,
265–313.
4. Bennedsen, M. & Wolfenzon, D. (2000) ¨The balance of power in closely held
corporations¨, Journal of Financial Economics 58, 113-139.
5. Berger, A. & Bonaccorsi di Patti, E. (article in press) ¨Capital structure and firm
performance: A new approach to testing agency theory and an application to the
banking industry¨, Journal of Banking and Finance.
6. Boubakri, N., Cosset, J.C., & Guedhami, O. (2005) ¨Post privatization corporate
governance: The role of ownership structure and investor protection¨, Journal of
7. Castañeda, G. (2002) ¨Internal capital markets and financing choices of Mexican
firms before and during the financial paralysis of 1995-2000¨, Unpublished
manuscript.
8. Castañeda, G. (2005) ¨Consequences of firms’ relational financing in the aftermath
of the 1995 Mexican banking crisis¨, Journal of Applied Economics, 8 (1), 53-79.
9. Claessens, S., Djankov, S., & Xu, L.C. (2000) ¨Corporate performance in the East
Asian financial crisis¨, The World Bank Research Observer 15, 23-46, Washington.
10.Coles, J.W., McWilliamsb, V.B., & Sen, N. (2001) ¨An examination of the
relationship of governance mechanisms to performance¨, Journal of Management
27, 23-50.
11.Dahyaa, J. & McConnell, J.J. (article in press) ¨Outside directors and corporate
board decisions¨, Journal of Corporate Finance.
12.Fama, E. & Jensen, M. (1983) ¨Agency problems and residual claims¨, Journal of
Law and Economics 26, 327–350.
13.Jensen, M.C. & Meckling, W.H. (1976) ¨Theory of the firm: Managerial behavior,
agency costs and ownership structure¨, Journal of Financial Economics 3, 305–360.
14.Khanna, T. & Palepu, K. (1996) ¨Corporate scope and severe market imperfections:
An empirical analysis of diversified business groups in an emerging economy¨,
Graduate School of Business Administration, Harvard University, Boston,
Massachusetts.
15.Kim, B. & Lee, I. (2003) ¨Agency problems and performance of Korean companies
during the Asian financial crisis: Chaebol vs. non-chaebol firms¨, Pacific - Basin
16.Kose, J. & Senbet, L.W. (1998) ¨Corporate governance and board effectiveness¨,
Journal of Banking and Finance 22, 371-403.
17.Lee, J. (1998) ¨Causes for business failures: Understanding the 1997 Korean crisis¨,
Journal of Asian Economics 9, 637-651.
18.Maury, B. (article in press) ¨Family ownership and firm performance: Empirical
evidence from Western European corporations¨, Journal of Corporate Finance.
19.Mitton, T. (2002) ¨A cross-firm analysis of the impact of corporate governance on
the East Asian financial crisis¨, Journal of Financial Economics 64, 215-241.
20.Morck, R. & Nakamura, M. (1999) ¨Banks and corporate control in Japan¨, Journal
of Finance 54, 319–339.
21.Myers, S.C. (1977), ¨Determinants of corporate borrowing¨, Journal of Financial
Economics 5, 147-175.
22.Titman, S. & Wessels, R. (1998) ¨The determinants of capital structure choice¨,
Journal of Finance 42, 1-19.
23.Watkins, K., Van Dijk, D., & Spronk, J. (2005) ¨Macroeconomic crisis and
individual firm performance: The Mexican experience¨, Tinbergen Institute