0186-1042/© Derechos Reservados © 2015 Universidad Nacional Autónoma de México, Facultad de Contaduría y Administración. Este es un artículo de acceso abierto distribuido bajo los términos de la Licencia Creative Commons CC BY-NC-ND 4.0.
www.contaduriayadministracionunam.mx
www.revistas.unam.mx/index.php/rca/
Contaduría y Administración 60 (2015) 389-401
Adaptive market efficiency of agricultural
commodity futures contracts
Eficiencia del mercado adaptativo en los contratos
futuros de productos agrícolas
Semei Coronado Ramírez,
a,*Pedro Luis Celso Arellano,
aOmar Rojas
ba Departamento de Métodos Cuantitativos y Departamento de Sistemas de Información,
Universidad de Guadalajara, México
b Escuela de Ciencias Económicas y Empresariales, Universidad Panamericana, México
Received 20 January 2014; accepted 18 February 2015
Abstract
In this paper we investigate the adaptive market efficiency of the agricultural commodity futures market, using a sample of eight futures contracts. Using a battery of nonlinear tests, we uncover the nonlinear serial dependence in the returns series. We run the Hinich portmanteau bicorrelation test to uncover the moments in which the nonlinear serial dependence, and therefore adaptive market effi-ciency, occurs for our sample.
All Rights Reserved © 2015 Universidad Nacional Autónoma de México, Facultad de Contaduría y Administración. This is an open access item distributed under the Creative Commons CC License BY-NC-ND 4.0.
Keywords: Efficient markets; Nonlinearity; Adaptive market hypothesis; Agricultural commodities; Futures
market
Resumen
En este documento se investiga la eficiencia del mercado adaptativo del mercado de futuros de productos básicos agrícolas, utilizando una muestra de ocho contratos de futuros. Se utiliza una ba-tería de pruebas no lineales para descubrir la dependencia no lineal en la serie de retornos.
Aplica-*Corresponding author.
mos el estadístico Hinich portmanteau bicorrelación para descubrir los momentos de dependencia no lineal en las series, y por lo tanto se encuentra que cuatro productos del mercado tienen adaptable eficiencia.
Derechos reservados © 2015 Universidad Nacional Autónoma de México, Facultad de Contaduría y Administración. Este es un artículo de acceso abierto distribuido bajo los términos de la Licencia Creative Commons CC BY-NC-ND 4.0.
Palabras clave: Mercados eficientes; No linealidad; Hipótesis de mercados adaptativos; Productos agrícolas;
Mercado de futuros
Introduction
The weak-form efficient market hypothesis (EMH) is a financial theory that has attract-ed lots of attention from researchers for over four decades. A market is efficient when pric-es always fully reflect available information (Fama, 1970). However, dpric-espite such a large body of research on EMH, there is no consensus on whether markets are efficient or not. Thus, according to Campbell, Lo, and MacKinlay (1997), the notion of relative efficiency may be a more useful concept than the all-or-nothing view taken by the conventional efficiency studies. They suggest relative efficiency because measuring efficiency provides more insights than testing it, i.e., it may be more useful to know the differences in the degree of inefficiency across markets than knowing that a market is inefficient per se.
Traditionally, the weak-form EMH has been tested in empirical studies through the un-predictability of returns from past returns criterion (or conventional efficiency studies). Some of these tools are: the serial autocorrelation test using the Ljung and Box (1978) portmanteau Q statistic, the runs test (Shiller & Perron, 1985) and the variance ratio test (Al-Khazali, Ding, & Pyun, 2007; Chow & Denning, 1993; Lo & MacKinlay, 1988), amongst others. However, these short-horizon return predictability studies have been criticized for their focus on linear correlations of price changes. According to Hong and Lee (2005), an alter-native approach would be to remove all linear serial autocorrelation from the sample and determine whether returns still contain predictable nonlinearities. Furthermore, since a white noise process does not necessarily imply efficiency as returns series can be linearly uncorrelated and at the same time nonlinearly dependent (Granger, 2001; Granger & An-dersen, 1978), there is a need for the utilization of nonlinear techniques to uncover hidden nonlinear serial dependency structures in time series, cf. (Hinich & Patterson, 1985; Hsieh, 1991; Panagiotidis & Pelloni, 2007; Patterson & Ashley, 2000). Amongst the vast number of nonlinear tests, there is the McLeod and Li (1983) Test, Tsay (1986) Test, ARCH-LM Test (Engle, 1982) and the BDS Test (Broock, Scheinkman, Dechert, & LeBaron, 1996). All these tests can be used to detect the presence of nonlinear dependence in a time series and therefore market inefficiency.
market efficiency is related to environmental factors characterizing market ecology such as the number of competitors, the magnitude of profit opportunities available and the adaptability of market participants. Some practical implications of the AMH are: there are changes over time in the risk-reward relationships due to the preferences of the market population; current preferences are influenced by the movement of past prices due to the forces of natural selection, in contrast to the weak-form of EMH where history of prices is not taken into account; arbitrage opportunities, being constantly created and disappear-ing, exist at different points in time.
Under the AMH point of view, it is desirable to detect nonlinear phenomena in cer-tain periods of time and not only in the full series. For this purpose, it can be of use the framework originally proposed by Hinich and Patterson (1995), then published as (Hinich and Patterson, 2005), in which the full sample period is divided into equal-length non-overlapped moving time windows, and the Hinich (1996) Portmanteau Bicorrelation Test Statistic is computed for detecting nonlinear serial dependence in each window and therefore inefficiency. The aforementioned test has been successfully applied to analyze the nonlinear behavior of different financial and economic time series, cf. (Bonilla, Ma-quieira, & Romero-Meza, 2008; Coronado-Ramírez & Arreola, 2011; Hinich & Serletis, 2007; Lim, Brooks, & Hinich, 2008; Romero-Meza, Bonilla, & Hinich, 2007).
Recently, a number of researchers have shifted from the traditional focus of absolute and static EMH to tracking the changing degree of efficiency over time, giving way to the AMH point of view: Hiremath and Kumari (2014) studied India’s stock market; Alva-rez-Ramirez, Rodriguez, and Espinosa-Paredes (2012), Ito and Sugiyama (2009) and Kim, Shamsuddin, & Lim (2011) found time varying efficiency in the U.S; Charles, Darné, & Kim (2012) and Neely, Weller, and Ulrich (2009) gave evidence of AMH in the foreign exchange market; Noda (2012) focused on Japan, Lim et al. (2008) on Asian Markets and Urquhart and Hudson (2013) on some major stock markets; as for commodity markets, Coronado-Ramírez, Ramírez-Grajeda, and Celso-Arellano (2014) explored the interna-tional coffee market, applying nonlinear statistical tests to detect periods of inefficiency for the case of Colombian Arabica beans.
In this paper we focus our attention on the futures market. In particular, we study the nonlinear serial behavior of the returns of eight agricultural commodity futures con-tracts traded at the Chicago Mercantile Exchange (CME), namely: CBOT corn, KC HRW Wheat, CBOT Soybean Oil, ICCO Cocoa, ICO Coffee Arabica Mild Average, ISA Raw Sugar, Feeder Cattle and Eggs Large White. We have chosen these commodities since they are some of the most traded and representative of the agricultural commodity fu-tures markets traded at the CME, the leader in global marketplace. All the prices were collected from Thomson Reuters Datastream Professional for the sample period 7/7/1994 to 11/15/2010, for a total of 4267 observations for each series. The selected time frame allows for a comprehensive study since the sample takes into account periods of high and low volatility, including the sub-prime global financial crisis.
(Karali & Power, 2009). Agricultural economic time series have historically been mod-eled to predict prices and/or volatility of these products (commodities) with autoregressive (AR) models, moving average (MA), autoregressive integrated moving average (ARIMA), transfer functions and dynamic analysis (Aradhyula & Holt, 1988). Also, in recent times, generalized autoregressive heteroskedastic (GARCH) models have been used (Adrangi & Chatrath, 2003; Benavides, 2004; Tansuchat, Chang, & McAleer, 2009), as well as smooth transition vector error correction models (STVECM) (Milas & Otero, 2002). There are other studies that show the chaotic behavior in the prices of commodities, these include Lyapunov exponents test, the Brock Dechert and Scheinkman statistic (BDS), the cor-relation exponent, neural networks, amongst others (Ahti, 2009; Blank, 1991; Tejeda & Goodwin, 2009; Velásquez & Aldana, 2007; Yang & Brorsen, 1993).
The present study aims to complement and extend existing work on AMH, uncovering nonlinear serial dependence not only on the full sample, using the nonlinear techniques mentioned, but also exhibiting windows of time in which such phenomena occur, with the aid of the Hinich test. To the best of our knowledge, no AMH point of view has been applied to commodity futures contracts using these tools.
The plan of this paper is as follows: Section 2 describes the methodology used. Section 3 describes the data. Section 4 reports the empirical results. Concluding remarks are pre-sented at the end of the paper.
Methodology
In this section we present the battery of nonlinear tests applied to uncover nonlinear serial dependence and empirically test the EMH and AMH of our sample. Even if we focus mainly on showing how nonlinear phenomena is present in certain periods of time, we apply such a battery of tests in order to present a more robust study and avoid the risk of overemphasizing the generality of the findings. We use the tests already mentioned in the introduction, namely: McLeod-Li test, Tsay test, ARCH-LM test, BDS test and Hinich test. Before running them on the pre-whitened returns series, we perform two unit root tests to check for stationarity of the returns series. Besides running the traditional Aug-mented Dickey Fuller Test, which assumes normality of errors (Dickey & Fuller, 1979), we test for stationarity using the Residual Augmented Least Squares (RALS) methodolo-gy, which does not require knowledge of a specific density function or a functional form (Im, Lee, & Tieslau, 2014).
The linear dependence is removed form the sample by fitting an autoregressive model of order p, AR(p), where the optimal lag is chosen to minimize the Schwarz’s Bayesian Infor-mation Criterion. These white noise residuals are thus analyzed with the following tests: the McLeod-Li test of nonlinearity which is used to find out if the squared autocorrelation function of returns is non-zero (McLeod & Li, 1983); the Tsay test, used to detect the quadratic serial dependence in the sample (Tsay, 1986); the ARCH-LM test used to detect ARCH distributive (Engle, 1982); the BDS portmanteau test for time-based dependence in the series (Broock et al., 1996); finally, the Hinich portmanteau bicorrelation test (Hinich, 1996), which is a third order extension of the standard correlation tests for white noise and detects nonlinear serial dependence in non-overlapped time windows. Since this is the method employ to give evidence of the AMH on the series under study, we explain it in more detail in the following subsection.
The Hinich portmanteau bicorrelation test
We now proceed to explain the windowed test procedure used in this study, the Hinich portmanteau bicorrelation test (H-test). Such a test is used to detect epochs of transient dependence in a discrete-time pure white noise process and involves a procedure of di-viding the full sample period into equal length non-overlapping moving time windows or frames on each of which the portmanteau bicorrelation statistic (H-statistic) is computed, to detect nonlinear serial dependence. Let the sequence
{
x(
tk)}
denote the sampled data process at a fixed rate, where the time unit t is discrete. The H-test employs non-overlapped time windows, thus if we denote by n the window length, then the k-th window is{
x(
tk)
,x-(
tk + 1)
, … , x(
tk + n – 1)}
. The next window is{
x(
tk+1)
,x(
tk+1 + 1)
, … , x(
tk+1 + n – 1)}
, wheretk+1 = tk + n. All observations are standardized z
(
tk)
=(
x(
tk+1)
– µx)/
σx, where µx and σx are the expected value and the standard deviation of each process, respectively. The null hypothesis for each window is that{
z(
tk)}
. are realizations of a stationary pure white noise process that has zero bicorrelation, defined by Czzz(r,s) = E [z(t) z(t + r) z(t + s)] for 0 < r < s < L, where L is the number of lags in each window. The alternative hypothesis is that the process generated in the window is random with some non-zero bicorrelations, i.e., there exists third-order nonlinear dependence in the data generation process.The H-statistic, used to detect nonlinear dependence within a window, and its corre-sponding distribution, are
where G(r,s) = (n – s)1/2C
zzz(r,s). The number of lags L is specified as L := nc , with
The data
For the present study we consider daily returns of eight agricultural commodity fu-tures prices traded at the Chicago Mercantile Exchange (CME) of the following products: CBOT corn, KC HRW Wheat, CBOT Soybean Oil, ICCO Cocoa, ICO Coffee Arabica Mild Average, ISA Raw Sugar, Feeder Cattle and Eggs Large White. All the prices of these futures contracts were collected from Thomson Reuters Datastream Professional
for the sample period 7/7/1994 to 11/15/2010, for a total of 4267 observations for each of the 8 futures contracts. These dates were chosen in such a way that all contracts had observations in these periods. Prices where transformed into series of continuously com-pounded percentage returns by taking the differences of the logarithm of the prices, i.e.
rt = ln
(
pt)
– ln(
pt–1)
, where pt is the price of the futures contract on day t. Figure 1 and Figure 2 show the behavior of the prices and returns for each series.Empirical results
In this section we discuss the empirical results of stationarity and nonlinear tests car-ried out. Summary statistics for the returns are shown in Table 1. The statistics are consis-tent, as expected, with some of the stylized facts of financial time series (Cont, 2001). In particular, the kurtosis indicates that return distributions are leptokurtic. Furthermore, the Jarque and Bera (1987) statistic (JB) confirms returns not normally distributed.
Stationarity tests
In Table 2, we present results of the ADF and RALS tests. As it is well known, as more negative the value of the statistic, the stronger the rejection of the hypothesis that there is a
Corn Wheat Cocoa Soybean Oil
1995
–0.10
0.00
0.10
200
400
600
2000 2005 2010 1995
–0.10
0.00
0.10
200
600
1000
2000 2005 2010 –0.10 1995
0.00
0.10
1000
2000
3000
2000 2005 2010 1995
–0.05
0.05
10
30
50
2000 2005 2010
unit root at the 5% significance level chosen. As we can observe, both tests imply rejection of the null hypothesis.
Tests of nonlinear serial dependence
In this subsection we present the results of the battery of nonlinear tests applied to the sample. A series of conventional linear tests, as those mentioned in the introduction, were run beforehand and are available from the authors upon request. These tests are in-capable of capturing nonlinear patterns in the data. As is well known, the failure to reject linear dependence is insufficient to prove independence of the series when in presence of non-normality (Hsieh, 1991) and not necessarily imply independence (Granger & An-dersen, 1978). Given that the presence of nonlinearity in the return series contradicts the EMH, we employ the nonlinear tests to investigate nonlinear dependence.
Table 1
Summary statistics for the returns of the futures contracts.
Mean Min Max StdDev Skewness Kurtosis JB
Corn 0.0002 –0.121 0.109 0.018 –0.190 6.616 2351
Wheat 0.0002 –0.123 0.125 0.019 0.055 7.014 2867
Cocoa 0.0002 –0.100 0.124 0.017 –0.122 8.925 6253
Soybean Oil 0.0002 –0.075 0.080 0.016 0.095 5.175 847.7
Sugar 0.0002 –0.193 0.142 0.022 –0.364 9.822 8367
Coffee 0.0000 –0.184 0.253 0.021 0.476 21.030 57987
Feeder Cattle 0.0000 –0.086 0.086 0.015 0.014 7.738 3991
Eggs 0.0002 –0.429 0.336 0.037 –0.834 30.770 137611
Sugar Coffee Feeder Cattle Eggs
1995
–0.20
–0.05
0.10
52
0
10
30
2000 2005 2010 –0.21995
0.0
0.2
50
150
250
2000 2005 2010 1995
–0.05
0.05
60
80
100
2000 2005 2010 1995
–0.4
0.2
0.0
40
80
120
2000 2005 2010
Most of the series were adjusted between an AR(1) and an AR(4), prior to the appli-cation of the tests, in order to remove any linear dependence, where the optimal lag was chosen to minimize the Schwarz’s Bayesian Information Criterion. Therefore, we reject the null hypothesis, given the significance level of 5% (Table 3), where the pure white noise is explained solely by the nonlinearity of the historic series. The results in Table 3 as a whole provide evidence of nonlinearity in all the returns series, though “unanimous” verdict from all the tests is reached for all but the Cocoa time series, in which the Tsay test using lags up to 5 and the BDS test (m=2) cannot reject the null hypothesis at the 5% level of significance.
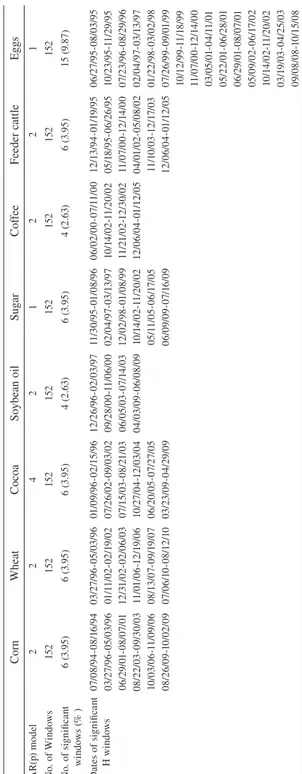
Test of nonlinearity for the AMH
In spite of the fact that the results of the preceding subsection gave strong evidence of nonlinearity in all the returns series, it is actually possible that the significant results are driven by nonlinear phenomena within a small number of periods. Such periods would be indicative of evidence of AMH on the commodity futures market, for the sample un-der study. For this purpose, we perform an H-test on 152 non-overlapped moving time windows of 28 daily observations, to detect possible nonlinear serial dependence in each window. Having removed the possibility of spurious autocorrelations by the pre-whitening of the series, Table 4 presents the results of the H-test, where the number of significant windows, indicating the presence of nonlinear serial dependence is identified, along with the epochs in which it occurs. These results are consistent with other works, which have applied the H-test to financial or economic time series to detect nonlinear dependence periods (Bonilla et al., 2008; Coronado and Gatica, 2011; Hinich & Serletis 2007; Lim et al., 2008).
An interesting insight from the Hinich framework is that in this way it is possible to assess the relative efficiency, and thus evidence of the AMH, of the futures contracts for the different products in the sample. Even if the results from the other tests reveal nonlin-ear serial dependence, it is better to know the degree of inefficiency and in what periods
Table 2
Results from the ADF and RALS stationarity tests.
ADF RALS
Corn –14.869 –16.569
Wheat –18.465 –19.555
Cocoa –17.833 –19.638
Soybean Oil –16.991 –18.636
Sugar –18.992 –19.895
Coffee –17.882 –18.479
Feeder Cattle –14.870 –15.623
Eggs –20.764 –23.480
Table 3
Nonlinearity test results.
Corn Wheat Cocoa Soybean
Oil
Sugar Coffee Feeder Cattle
Eggs
AR(2) AR(2) AR(4) AR(2) AR(1) AR(2) AR(2) AR(1)
McLeod-Li test
Lag 5 0.000 0.000 0.000 0.000 0.000 0.000 0.000 0.000
Lag 15 0.000 0.000 0.000 0.000 0.000 0.000 0.000 0.000
Lag 20 0.000 0.000 0.000 0.000 0.000 0.000 0.000 0.000
Tsay test
Lag 5 0.030 0.002 0.870 0.001 0.000 0.000 0.000 0.000
Lag 15 0.000 0.000 0.002 0.000 0.000 0.000 0.000 0.000
Lag 20 0.000 0.000 0.001 0.000 0.000 0.000 0.000 0.000
Engle LM test
Lag 5 0.000 0.000 0.001 0.000 0.000 0.000 0.000 0.000
Lag 15 0.000 0.000 0.000 0.000 0.000 0.000 0.000 0.000
Lag 20 0.000 0.000 0.000 0.000 0.000 0.000 0.000 0.000
BDS test
m=2, ε=0.5s 0.000 0.000 0.159 0.000 0.000 0.000 0.000 0.000 m=3, ε=s 0.000 0.000 0.009 0.000 0.000 0.000 0.000 0.000 m=4, ε=1.5 s 0.000 0.000 0.001 0.000 0.000 0.000 0.000 0.007
Hinich bispectrum test 0.000 0.000 0.000 0.000 0.000 0.000 0.000 0.000
Significant at 5%. For the BDS test, m and ε denote the embedding dimension and distance, respectively and ε is equal to various multiples of the sample standard deviation.
this happens, for forecasting and decision-making purposes, amongst others. Given the results of the number of windows in which nonlinear dependence, and thus AMH, is de-tected, which goes from 2.63% of the windows for Soybean Oil and Coffee, to 9.87% of the windows in the case of Eggs, the most volatile contract of the sample, some light has been shed towards the AMH on the futures contracts under study.
Conclusions
Table 4 Hinich bicorrelation test results in mo
ving non-o
verlapped time windo
It would be interesting to study the determinants in the total number of significant windows for these products, as well as the economic, political or social triggers of the nonlinear serial dependence observed, in order to investigate the possibility of forecasting when the phenomena would occur.
Acknowledgements
Omar Rojas acknowledges partial support from the “Research Fund UP-2013” of Uni-versidad Panamericana Guadalajara.
References
Adrangi, B. & Chatrath, A. (2003). Non-linear dynamics in futures prices: evidence from the coffee, sugar and cocoa exchange. Applied Financial Economics 13 (4): 245-256.
Ahti, V. (2009). Forecasting commodity prices with nonlinear models. Helsinki Centre of Economic Research.
Finland: University of Helsinki.
Al-Khazali, O.M., Ding, D.K., & Pyun, C.S. (2007). A new variance ratio test of random walk in emerging markets: a revisit. Financial Review 42 (2): 303-317.
Alvarez-Ramirez, J., Rodriguez, E., & Espinosa-Paredes, G. (2012). Is the US stock market becoming weakly efficient over time? Evidence from 80-year-long data. Physica A: Statistical Mechanics and Its Applications
391 (22): 5643-5647.
Aradhyula, S.V. & Holt, M.T. (1988). GARCH time-series models: an application to retail livestock prices.
Western Journal of Agricultural Economics 13 (2): 365-374.
Benavides, G. (2004). Price volatility forecasts for agricultural commodities: an application of historical volatility models, option implieds and composite approaches for futures prices of corn and wheat. Revista
de Administración, Finanzas y Economía 3 (2), 40–59.
Blank, S.C. (1991). “Chaos” in futures markets? A nonlinear dynamical analysis. Journal of Futures Markets
11 (6): 711-728.
Bonilla, C.A., Maquieira, C.P., & Romero-Meza, R. (2008). Nonlinear behaviour of emerging market bonds spreads: the Latin American case. Applied Economics 40 (20): 2679-2702.
Broock, W.A., Scheinkman, J.A., Dechert, W.D., & LeBaron, B. (1996). A test for independence based on the correlation dimension. Econometric Reviews 15 (3): 197-235.
Campbell, J.Y., Lo, A.W., & MacKinlay, A.C. (1997). The Econometrics of Financial Markets. Princeton: Princeton University Press.
Charles, A., Darné, O., & Kim, J.H. (2012). Exchange-rate return predictability and the adaptive markets hypothesis: Evidence from major foreign exchange rates. Journal of International Money and Finance
31 (6): 1607-1626.
Chow, K.V. & Denning, K.C. (1993). A simple multiple variance ratio test. Journal of Econometrics 58 (3): 385-401
Cont, R. (2001). Empirical properties of asset returns: stylized facts and statistical issues. Quantitative Finance
1: 223-236.
Coronado, S., & Gatica, L. (2011). Identificación de episodios de dependencia no lineal en el peso mexicano. Cuadernos de Economía 30 (55): 91–104.
Coronado-Ramírez, S. & Arreola, L. G. (2011). Identificación de episodios de dependencia no lineal en el peso mexicano. Cuadernos de Economía 30 (55): 91-104.
Coronado-Ramírez, S., Ramírez-Grajeda, M., & Celso-Arellano, P.L. (2014). Inefficiency in the international coffee market: The case of Colombian arabica. African Journal of Agricultural Research 9 (5): 556-561. Dickey, D.A. & Fuller, W.A. (1979). Distribution of the estimators for autoregressive time series with a unit
Engle, R.F. (1982). Autoregressive conditional heteroscedasticity with estimates of the variance of United Kingdom inflation. Econometrica: Journal of the Econometric Society 50 (4): 987-1007.
Fama, E.F. (1970). Efficient capital markets: A review of theory and empirical work. The Journal of Finance
5 (2): 383-417.
Granger, C.W.J. (2001). Essays in Econometrics. Collected Papers of Clive W. J. Granger (32: 457–471). Cambridge University Press.
Granger, C.W.J. & Andersen, A.P. (1978). An introduction to bilinear time series models. Göttingen: Vandenhoeck und Ruprecht.
Hinich, M.J. (1996). Testing for dependence in the input to a linear time series model. Journal of Nonparametric
Statistics 6 (2-3): 205-221.
Hinich, M.J. & Patterson, D.M. (1985). Evidence of nonlinearity in daily stock returns. Journal of Business
and Economic Statistics 3 (1): 69-77.
Hinich, M.J. & Serletis, A. (2007). Episodic nonlinear event detection in the Canadian exchange rate. Journal
of the American Statistical Association 102 (477): 68-74.
Hinich, M. & Patterson, D. (1995). Detecting epochs of transient dependence in white noise. Mimeo, University of Texas at Austin.
Hinich, M. & Patterson, D. (2005). Detecting epochs of transient dependence in white noise. In M.T. Belongia & J.M. Binner (Eds.), Money, measurement and computation (pp. 61–75). London: Palgrave Macmillan. Hiremath, G.S. & Kumari, J. (2014). Stock returns predictability and the adaptive market hypothesis in
emerging markets: evidence from India. SpringerPlus 3 (1): 1-14.
Hong, Y. & Lee, Y.-J. (2005). Generalized spectral tests for conditional mean models in time series with conditional heteroscedasticity of unknown form. The Review of Economic Studies 72 (2): 499-541. Hsieh, D.A. (1991). Chaos and nonlinear dynamics: Application to financial markets. Journal of Finance 46
(5): 1839-1877.
Im, K.S., Lee, J., & Tieslau, M.A. (2014). More powerful unit root tests with non-normal errors. In Sickles, R. & Horrace, W. (Eds.), Festschrift in Honor of Peter Schmidt (pp. 315–342). New York: Springer. Ito, M. & Sugiyama, S. (2009). Measuring the degree of time varying market inefficiency. Economics Letters
103 (1): 62–64.
Jarque, C. & Bera, A. (1987). A test for normality of observations and regression residuals. Statistical Review /
Revue Internationale de Statistique 53: 163-172.
Karali, B. & Power, G.J. (2009). What explains high commodity price volatility? Estimating a unified model of common and commodity-specific, high-and low-frequency factors. 2009 Annual Meeting Agricultural
and Applied Economics. July 26-28, 2009, Milwaukee, Wisconsin.
Kim, J.H., Shamsuddin, A., & Lim, K.-P. (2011). Stock return predictability and the adaptive markets hypothesis: Evidence from century-long US data. Journal of Empirical Finance 8 (5): 868-879. Lim, K.-P., Brooks, R.D., & Hinich, M.J. (2008). Nonlinear serial dependence and the weak-form efficiency
of Asian emerging stock markets. Journal of International Financial Markets, Institutions and Money
18 (5): 527-544.
Ljung, G.M. & Box, G.E.P. (1978). On a measure of lack of fit in time series models. Biometrika 65 (2): 297-303.
Lo, A.W. (2004). The adaptive markets hypothesis. The Journal of Portfolio Management 30 (5): 15-29. Lo, A.W. (2005). Reconciling efficient markets with behavioral finance: the adaptive markets hypothesis.
Journal of Investment Consulting 7 (2): 21-44.
Lo, A.W. & MacKinlay, A.C. (1988). Stock market prices do not follow random walks: Evidence from a simple specification test. Review of Financial Studies 1 (1): 41-66.
McLeod, A.I. & Li, W.K. (1983). Diagnostic checking ARMA time series models using squared-residual autocorrelations. Journal of Time Series Analysis 4 (4): 269-273.
Milas, C. & Otero, J. (2002). Smooth transition vector error correction models for the spot prices of coffee.
Applied Economics Letters 9 (14): 925–928.
Neely, C.J., Weller, P.A., & Ulrich, J.M. (2009). The adaptive markets hypothesis: evidence from the foreign exchange market. Journal of Financial and Quantitative Analysis 44 (02): 467–488.
Noda, A. (2012). A test of the adaptive market hypothesis using non-Bayesian time-varying AR model in Japan.
Panagiotidis, T. & Pelloni, G. (2007). Nonlinearity in the Canadian and US labor markets: Univariate and multivariate evidence from a battery of tests. Macroeconomic Dynamics 11 (05): 613–637.
Patterson, D.M. & Ashley, R.A. (2000). A nonlinear time series workshop: A toolkit for detecting and
indentifying nonlinear serial dependence (Vol. 2). Boston: Kluwer Academic Publishers.
Romero-Meza, R., Bonilla, C.A., & Hinich, M.J. (2007). Nonlinear event detection in the Chilean stock market. Applied Economics Letters 14 (13): 987-991.
Shiller, R.J. & Perron, P. (1985). Testing the random walk hypothesis: Power versus frequency of observation.
Economics Letters 18 (4): 381-386.
Tansuchat, R., Chang, C.-L., & McAleer, M. (2009). Modelling long memory volatility in agricultural commodity futures returns. CARF-F-183 Series, Center for Advanced Research in Finance. Faculty of Economics, University of Tokyo.
Tejeda, H.A. & Goodwin, B.K. (2009). Price volatility, nonlinearity, and asymmetric adjustments in corn, soybean, and cattle markets: Implications of ethanol-driven (market) shocks. In NCCC-134 Conference
on Applied Commodity Price Analysis, Forecasting, and Market Risk Management. April 20-21, 2009,
St. Louis, Missouri.
Tsay, R.S. (1986). Nonlinearity tests for time series. Biometrika 73 (2): 461-466.
Urquhart, A. & Hudson, R. (2013). Efficient or adaptive markets? Evidence from major stock markets using very long run historic data. International Review of Financial Analysis 28: 130-142.
Velásquez, J.D. & Aldana, M.A. (2007). Modelado del precio del café colombiano en la bolsa de nueva york usando redes neuronales artificiales. Rev. Fac. Nal. Agr. Medellín 60 (2): 4129-4144.