Int. J. Electrochem. Sci., 9 (2014) 610 - 617
International Journal of
ELECTROCHEMICAL
SCIENCE
www.electrochemsci.orgExperimental Design to Measure
Escherichia coli
Removal in
Water Through Electrocoagulation
Katherin Castro-Ríos1,*, Gonzalo Taborda-Ocampo1 & Ricardo A. Torres-Palma2
1Grupo de Investigación en Cromatografía y Técnicas Afines, Departamento de Química, Facultad de
Ciencias Exactas y Naturales, Universidad de Caldas, A.A. 265, Manizales, Colombia.
2Grupo de Investigación en Remediación Ambiental y Biocatálisis, Instituto de Química, Facultad de
Ciencias Exactas y Naturales, Universidad de Antioquia, A.A. 1226, Medellín, Colombia.
*
E-mail: [email protected]
Received: 9 July 2013 / Accepted: 14 October 2013 / Published: 8 December 2013
The experimental design herein was used to evaluate the influence of electrocoagulation parameters, such as initial pH and electrolyte support (Na2SO4) concentration, on Escherichia coli (E.coli)
removal. The initial pH and Na2SO4 concentration influenced the response variable. E.coli removal is
more efficient with a decrease in pH and an increase in Na2SO4 concentration. The predicted values
from the empirical model were consistent with the experimental values. In a final experiment under optimal conditions (2.5 mg L-1 of Na2SO4 and initial pH 4.0), the electrocoagulation with aluminum
electrodes was able to remove 1-log after 40 min and 1.9-log in a contact time of 90 min of E.coli. The study shows electrocoagulation as a promising alternative to remove microorganisms in water.
Keywords: Factorial design, electrochemistry, microorganism, pH, electrolyte support
1. INTRODUCTION
Chlorination is the primary method for disinfecting water because it is effective and inexpensive, but this method is related to trihalomethanes (THMs) byproduct formations, which are recognized as a potentially carcinogenic substances [1, 2]. This requires evaluating alternative techniques that may serve as a pretreatment or chlorination replacement.
electrocoagulation, Azarian, et al. [10] removed between 99.8% and 100% of the Microcystis aeruginosa in the final effluent from a water treatment plant, and Gao, Du, et al. [13] entirely removed the algae in a NaCl solution using aluminum electrodes. Ghernaout, et al. [14] removed between 80-100% of the bacteria Escherichia coli using aluminum and stainless steel electrodes; evaluated certain parameters, such as pH and current; and observed a positive impact on microorganism removal by using a neutral pH and increasing the current.
For this study, the influence of electrocoagulation parameters, such as initial pH and Na2SO4
concentration, on E.coli removal was studied using the experimental design described herein. This statistical methodology facilitates an assessment of two or more factors relevant to a response variable and generates an appropriate number of experiments; the results are expressed as a regression model [15].
2. EXPERIMENTAL
2.1 Reagents
Sodium sulfate and nitric acid were purchased from Sigma-Aldrich; the microbiological reagents, peptone water, and Endo agar were purchased from Oxoid. Sulfuric acid and sodium hydroxide were acquired from Merck and were used to adjust the pH. Distilled water was used to prepare the aqueous solutions and for the experiments.
2.2 Electrochemical experiments
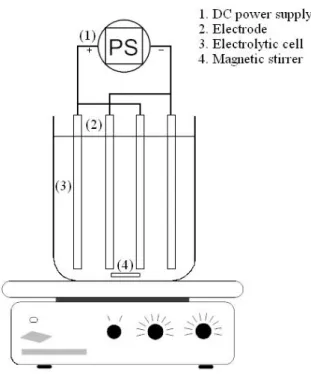
Electrochemical tests were performed in a batch reactor, which comprised a 500 mL glass beaker equipped with four aluminum electrodes, a 44 cm2 effective area, and a 1.0 cm interelectrodic space (Figure 1). The electrodes were connected to a direct current power supply (MCP Lab electronics) at 2.27 mA cm-2. Before each experiment, the aluminum electrodes were washed, sanded, dipped in a nitric acid solution (0.1 mol L-1), and rinsed with distilled water.
Na2SO4 was selected as the support electrolyte to avoid forming organic chlorine by-products
[16]. Before the electrocoagulation process, the initial pH of the water was adjusted using NaOH or H2SO4 (0.1 mol L-1). Samples were collected at different time intervals for microbiological analysis.
2.3 E.coli preparation and quantitation
A suspension comprising native E.coli in peptone water was prepared and incubated at 37 °C until the sample was at 105-106 cfu mL-1. The samples were analyzed using the filtration membrane technique in accordance with standard methods [17]. Sterile cellulose membranes (Advantec MFS) comprising a 0.45 µm pore size were placed in a Petri dish with Endo agar (Oxoid). The E.coli colonies were counted after incubation at 35 °C for 24 h.
2.4 Experimental design
A two-level factorial design (2k) with three replicate center points was used; the factors considered for this study were initial pH and support electrolyte (Na2SO4) concentration. The levels for
the factors studied are shown in Table 1. The response variable was E.coli removal, which was defined as Log (Nt/No), where No is the initial E.coli concentration, and Nt is the remaining E.coli population at
time t. The experiments were performed in a random order in duplicate, and the data were analyzed using the software Statgraphics®plus.
Table 1. Factors and levels used in the experiment
Variables Low Level, -1 Center points, 0 High Level, +1
Initial pH 4.0 5.5 7.0
Na2SO4 (mg L-1) 0.25 1.38 2.5
3. RESULTS AND DISCUSSION
3.1 Experimental design applied to E.coli removal through electrocoagulation
E.coli removal after electrocoagulation for 50 min. The study was conducted using a 95% confidence level.
Table 2. Design matrix and experimental results
Assays Initial pH Na2SO4 (mg L-1) Log (Nt/No)
1 5.5 1.38 –0.83
2 5.5 1.38 –0.79
3 4.0 0.25 –0.18
4 7.0 0.25 –0.47
5 4.0 2.5 –1.36
6 5.5 1.38 –0.72
7 7.0 2.5 –0.22
8 5.5 1.38 –0.66
9 5.5 1.38 –0.79
10 4.0 0.25 –0.24
11 7.0 0.25 –0.46
12 4.0 2.5 –1.29
13 5.5 1.38 –0.51
14 7.0 2.5 –0.15
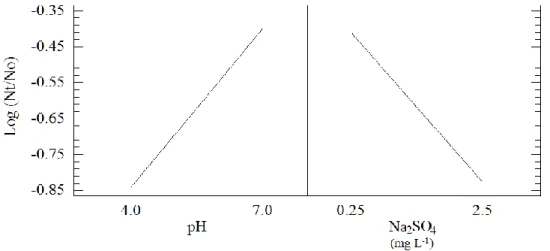
The primary-effects plot (Figure 2) shows the effect of each factor on the response variable. An increase in the Na2SO4 concentration had a positive effect on the response variable and may be
explained by an increase in conductivity, which would improve microorganism removal [18, 19]. A decrease in initial pH also had an effect on E.coli removal, which is consistent with previous research that shows higher efficiency at acidic and neutral pH values using aluminum electrodes; in addition, an acidic pH can limit E.coli growth and survival [20-22].
The Pareto chart (Figure 3) was used to draw conclusions on the most significant variables and variable interactions. This chart shows both the magnitude and importance of the effects (variables and interactions). The chart comprises a reference line (discontinuous vertical plot), and any effect that extends past this line is potentially important. An interaction between the initial pH and Na2SO4 (AB)
as well as initial pH (A) and Na2SO4 (B) concentration is considered important in E.coli removal.
Figure 3. Pareto chart for E.coli removal through electrocoagulation
The experimental design used herein included a reduced model that directly relates the response variable with the factors to facilitate subsequent evaluation of the data.
The reduced empirical model for E.coli removal through electrocoagulation is shown in Equation 1. The R2 value for Equation 1 is 0.9153, which indicates that 91.53% of the total variation in E.coli removal is attributed to the factors studied.
Log (Nt/No) = 0.388 – 0.137[pH] – 1.322 [Na2SO4] + 0.207[pH][Na2SO4] (1)
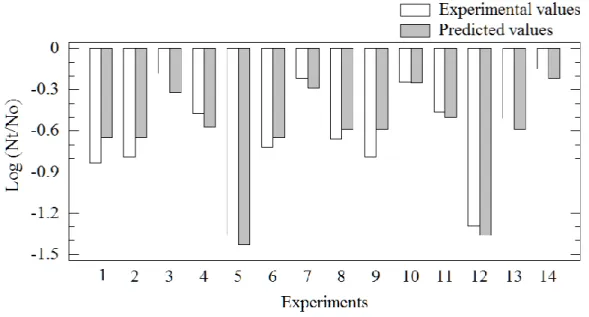
Figure 4 shows a comparison between the experimental values generated from each experiment (Table 2) and the predicted values for E.coli removal, which were calculated using Equation 1. The predicted values are consistent with the experimental data.
3.2 E.coli removal through electrocoagulation under optimal conditions
Figure 5. Variation of E.coli removal through electrocoagulation
In a final experiment, the removal of E.coli through electrocoagulation was conducted under optimal conditions (2.5 mg L-1 of Na2SO4 and initial pH 4.0) in distilled water. As seen in Figure 5, the
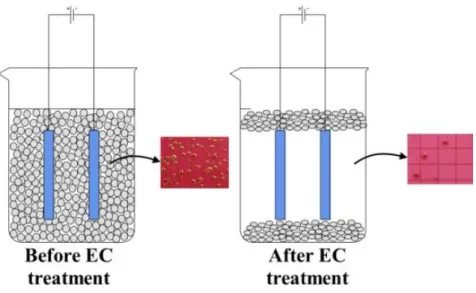
Figure 6. Schematic representation for E.coli removal through electrocoagulation
4. CONCLUSIONS
The experimental design, it allowed to observe the influence of the factors initial pH and electrolyte concentration support on the removal of the bacteria E.coli using electrocoagulation. The results indicated that the factors initial pH and electrolyte support (Na2SO4) concentration as well as
the interaction between these factors affected microorganism removal, which improved with a decrease in initial pH and an increase in Na2SO4 concentration. An empirical model was established that
describes E.coli removal using electrocoagulation. The removal of E.coli is attributed to the physical effect promoted by electrocoagulation.
ACKNOWLEDGMENTS
The authors are grateful to “Departamento Administrativo de Ciencia, Tecnología e Innovación” (Colciencias) for the scholarship provided.
References
1. S. E. Hrudey, Water Res, 43 (2009) 2057
2. G.-S. Wang, Y.-C. Deng and T.-F. Lin, Sci Total Environ, 387 (2007) 86
3. M. Y. Mollah, P. Morkovsky, J. A. Gomes, M. Kesmez, J. Parga and D. L. Cocke, J Hazard Mater, 114 (2004) 199
4. S. Tchamango, C. P. Nanseu-Njiki, E. Ngameni, D. Hadjiev and A. Darchen, Sci Total Environ 408 (2010) 947
5. R. Katal and H. Pahlavanzadeh, Desalination 265 (2011) 199 6. F. Akbal and S. Camci, Desalination, 269 (2011) 214
7. M. Saravanan, N. P. Sambhamurthy and M. Sivarajan, CLEAN – Soil, Air, Water, 39 (2010) 565 8. P. Durango-Usuga, F. Guzman-Duque, R. Mosteo, M. V. Vazquez, G. Penuela and R. A.
Torres-Palma, J Hazard Mater, 179 (2010) 120
10.G. H. Azarian, A. R. Mesdaghinia, F. Vaezi, R. Nabizadeh and D. Nematollahi, Iranian J Publ Health, 36 (2007) 57
11.N. N. Barashkov, D. Eiseinberg, S. Eisenberg, G. S. Shegebaeva, I. S. Irgibaeva and I. I. Barashkova, Russ J Electrochem, 46 (2010) 320
12.B. Zhu, D. A. Clifford and S. Chellama, Water Res 39 (2005) 3098
13.S. Gao, M. Du, J. Tian, J. Yang, J. Yang, F. Ma and J. Nan, J Hazard Mater 182 (2010) 827 14.D. Ghernaout, A. Badis, A. Kellil and B. Ghernaout, Desalination 219 (2008) 118
15.D. C. Montgomery, Design and analysis of experiments, Willey, New York (2001) 16.Y. Ş. Yildiz, A. S. Koparal and B. Keskinler, Chem Eng J, 138 (2008) 63
17.APHA, Standard Methods for the Examination of Water and Wastewater, 19th ed., Washington DC (1999)
18.U. Tezcan Ün, A. S. Koparal and Ü. B. Ögütveren, J Hazard Mater 164 (2009) 580
19.M. H. Otenio, L. C. Panchoni, G. C. A. d. Cruz, C. Ravanhani and E. D. Bidóia, Quim Nova, 31 (2008) 508
20.O. J. McQuestin, C. T. Shadbolt and T. Ross, Appl Environ Microbiol, 75 (2009) 6963 21.A. K. Mates, A. K. Sayed and J. W. Foster, J Bacteriol, 189 (2007) 2759
22.G. Chen, Sep Purif Technol, 38 (2004) 11