BIOLOGICAL
Amino acid composition of soybean meal Exercise 8-52 Anaerobic respiration Exercise 2-144 Blood
Cholesterol level Exercise 15-10 Glucose level Exercises 13-25, 14-37 Hypertension Exercises 4-143, 8-31, 11-8,
11-30, 11-46 Body mass index (BMI) Exercise 11-35 Body temperature Exercise 9-59 Cellular replication Exercises 2-193, 3-100 Circumference of orange trees Exercise 10-46 Deceased beetles under
autolysis and putrefaction Exercise 2-92
Diet and weight loss Exercises 10-43, 10-77, 15-35 Disease in plants Exercise 14-76
Dugongs (sea cows) length Exercise 11-15
Fatty acid in margarine Exercises 8-36, 8-66, 8-76, 9-147, 9-113
Gene expression Exercises 6-65, 13-50, 15-42 Gene occurrence Exercises 2-195, 3-11 Gene sequences Exercises 2-25, 2-192, 3-13,
3-147
Grain quality Exercise 8-21
Height of plants Exercises 4-170, 4-171 Height or weight of people Exercises 4-44, 4-66, 5-64,
6-30, 6-37, 6-46, 6-63, 6-73, 9-68
Insect fragments in chocolate bars Exercises 3-134, 4-101 IQ for monozygotic twins Exercise 10-45 Leaf transmutation Exercises 2-88, 3-123 Leg strength Exercises 8-30, 9-64 Light-dependent photosynthesis Exercise 2-24
Nisin recovery Exercises 12-14, 12-32, 12-50, 12-64, 12-84, 14-83 Pesticides and grape infestation Exercise 10-94 Potato spoilage Exercise 13-14 Protein
in Livestock feed Exercise 14-75
in Milk Exercises 13-13, 13-25, 13-33 from Peanut milk Exercise 9-143
Protopectin content in tomatoes Exercises 13-40, 15-40
Rat muscle Exercise 6-15
Rat tumors Exercise 8-50
Rat weight Exercise 8-57
Rejuvenated mitochondria Exercises 2-96, 3-88 Root vole population Exercise 14-16 Sodium content of cornflakes Exercise 9-61
Soil Exercises 3-24, 12-1, 12-2,
12-23, 12-24, 12-41, 12-42 Splitting cell Exercise 4-155
St John’s Wort Example 10-14
Stork sightings Exercises 4-100, 11-96 Sugar content Exercises 8-46, 9-83, 9-114 Synapses in the granule cell layer Exercise 9-145
Tar content in tobacco Exercise 8-95
Taste evaluation Exercises 14-13, 14-31, 14-34, 14-50, 14-54
Tissues from an ivy plant Exercise 2-130
Visual accommodation Exercises 6-11, 6-16, 6-75 Weight of swine or guinea pigs Exercises 9-142, 13-48 Wheat grain drying Exercises 13-47, 15-41 CHEMICAL
Acid-base titration Exercises 2-60, 2-132, 3-12, 5-48
Alloys Examples 6-4, 8-5
Exercises 10-21, 10-44, 10-59, 13-38, 15-17
Contamination Exercise 2-128, 4-113
Cooking oil Exercise 2-79
Etching Exercises 10-19, 10-65, 10-34 Infrared focal plane arrays Exercise 9-146
Melting point of a binder Exercise 9-42 Metallic material transition Examples 8-1, 8-2 Moisture content in raw material Exercise 3-6 Mole fraction solubility Exercises 12-75, 12-91 Mole ratio of sebacic acid Exercise 11-91
Pitch carbon analysis Exercises 12-10, 12-36, 12-50, 12-60, 12-68
Plasma etching Examples 14-5, 14-8 Exercise 7-32
Polymers Exercises 7-15, 10-8, 13-12, 13-24
Propellant
Bond shear strength Examples 15-1, 15-2, 15-4 Exercises 11-11, 11-31, 11-49, 15-32
Burning rate Examples 9-1, 9-2, 9-3, 9-4, 9-5 Exercise 10-6
Purity Exercise 15-42
Thermal barrier coatings Exercise 10-75 CHEMICAL ENGINEERING
Aluminum smelting Exercise 10-92 Automobile basecoat Exercises 14-56, 14-68
Blow molding Exercise 16-59
Catalyst usage Exercise 10-17 Concentration Examples 16-2, 16-6
Exercises 5-46, 6-68, 6-84, 10-9, 10-54, 15-64
Conversion Exercise 12-3
Cooling system in a nuclear submarine Exercise 9-130
Copper content of a plating bath Exercises 15-8, 15-34, 15-58 Dispensed syrup in soda machine Exercises 8-29, 8-63, 8-75 Dry ash value of paper pulp Exercise 14-57
Fill volume and capability Examples 5-35, 8-6, 9-8, 9-9 Exercises 2-180, 3-146, 3-151, 4-62, 4-63, 5-62, 9-100, 10-4, 10-85, 10-90, 14-43, 15-38 Filtration rate Exercise 14-44
Fish preparation Exercise 13-46 Flow metering devices Examples 15-3, 15-5
Exercises 9-126, 9-127 Foam expanding agents Exercises 10-16, 10-56, 10-88
Green liquor Exercise 12-100
Impurity level in chemical product Exercises 15-3, 15-15 Injection molding Example 14-9
Exercises 2-15, 2-137, 10-70 Laboratory analysis of chemical
process samples Exercise 2-43 Maximum heat of a hot tub Exercise 10-33
Na2S concentration Exercises 11-7, 11-29, 11-41,
11-62
NbOCl3 Exercise 6-36
Oxygen purity Examples 11-1, 11-2, 11-3, 11-4, 11-5, 11-6, 11-7 pH
and Catalyst concentration Exercise 14-61 of Plating bath Exercises 15-1, 15-13 of a Solution Exercise 6-17 of a Water sample Exercise 2-11
Product color Exercise 14-45
Product solution strength
in recirculation unit Exercise 14-38 Pulp brightness Exercise 13-31
Reaction Time Example 4-5
Exercises 2-13, 2-33, 4-56 Redox reaction experiments Exercise 2-65
Shampoo foam height Exercises 8-91, 9-15, 9-16, 9-17, 9-18, 9-19, 9-128 Stack loss of ammonia Exercises 12-16, 12-34, 12-52,
12-66, 12-85 Temperature
Firing Exercise 13-15
Furnace Exercises 6-55, 6-109
of Hall cell solution Exercise 11-92 Vapor deposition Exercises 13-28, 13-32 Vapor phase oxidation of naphthalene Exercise 6-54
Viscosity Exercises 6-66, 6-88, 6-90, 6-96, 12-73, 12-103, 14-64, 15-20, 15-36, 15-86 Water temperature from power
plant cooling tower Exercise 9-40 Water vapor pressure Exercise 11-78
Wine Examples 12-14, 12-15
Exercises 6-35, 6-51 CIVIL ENGINEERING
Cement and Concrete
Hydration Example 10-8
Mixture heat Exercises 9-10, 9-11, 9-12, 9-13, 9-14
Mortar briquettes Exercise 15-79 Strength Exercises 4-57, 15-24 Tensile strength Exercise 15-25
Compressive strength Exercises 13-3, 13-9, 13-19, 14-14, 14-24, 14-48, 7-7, 7-8, 8-13, 8-18, 8-37, 8-69, 8-80, 8-87, 8-90, 15-5
Intrinsic permeability Exercises 11-1, 11-23, 11-39, 11-52
Highway pavement cracks Exercise 3-138, 4-102 Pavement deflection Exercises 11-2, 11-16, 11-24,
11-40
Retained strength of asphalt Exercises 13-11,13-23 Speed limits Exercises 8-59, 10-60 Traffic Exercises 3-87, 3-149, 3-153,
9-190
Wearing seat belts Exercises 10-82, 10-83 COMMUNICATIONS, COMPUTERS, AND NETWORKS Cell phone signal bars Examples 5-1, 5-3 Cellular neural network speed Exercise 8-39 Code for a wireless garage door Exercise 2-34 Computer clock cycles Exercise 3-8 Computer networks Example 4-21
Exercises 2-10, 2-64, 2-164, 3-148, 3-175, 4-65, 4-94 Corporate Web site errors Exercise 4-84
Digital channel Examples 2-3, 3-4, 3-6, 3-9, 3-12, 3-16, 3-24, 4-15, 5-7, 5-9, 5-10
Electronic messages Exercises 3-158, 4-98, 4-115
Email routes Exercise 2-184
Encryption-decryption system Exercise 2-181
Errors in a communications channel Examples 3-22, 4-17, 4-20 Exercises 2-2, 2-4, 2-46, 3-40, 4-116, 5-5, 5-12, 6-94, 9-135 Passwords Exercises 2-81, 2-97, 2-194,
3-91, 3-108 Programming design languages Exercise 10-40 Response time in computer
operation system Exercise 8-82 Software development cost Exercise 13-49 Telecommunication prefixes Exercise 2-45 Telecommunications Examples 3-1, 3-14
Exercises 2-17, 3-2, 3-85, 3-105, 3-132, 3-155, 4-95, 4-105, 4-111, 4-117, 4-160, 5-78, 9-98, 15-9
Transaction processing performance
and OLTP benchmark Exercises 2-68, 2-175, 5-10, 5-34, 10-7
Viruses Exercise 3-75
Web browsing Examples 3-25, 5-12, 5-13 Exercises 2-32, 2-191, 3-159, 4-87, 4-140, 5-6
ELECTRONICS
Automobile engine controller Examples 9-10, 9-11 Bipolar transistor current Exercise 14-7 Calculator circuit response Exercises 13-6, 13-18
Circuits Examples 2-35, 7-3
Exercises 2-135, 2-136, 2-170, 2-177, 2-190
Conductivity Exercise 12-105
Current Examples 4-1, 4-5, 4-8, 4-9, 4-12, 16-3
Exercises 10-31, 15-30 Drain and leakage current Exercises 13-41, 11-85 Electromagnetic energy absorption Exercise 10-26 Error recovery procedures Exercises 2-18, 2-166 Inverter transient point Exercises 12-98, 12-99, 12-102 Magnetic tape Exercises 2-189, 3-125 Nickel charge Exercises 2-61, 3-48 Parallel circuits Example 2-34
Power consumption Exercises 6-89, 11-79, 12-6, 12-26, 12-44, 12-58, 12-80
Power supply Example 9-13
(Text continued at the back of book.) Redundant disk array Exercise 2-127
Resistors Example 7-1
Exercise 6-86
Solder connections Exercises 3-1, 15-43, 15-45 Strands of copper wire Exercise 2-77
Surface charge Exercise 14-15 Surface mount technology (SMT) Example 16-5 Transistor life Exercise 7-51 Voltage measurement errors Exercise 4-48N ENERGY
Consumption in Asia Exercises 6-29, 6-45, 6-59 Enrichment percentage
of reactor fuel rods Exercises 8-41, 8-71, 8-88 Fuel octane ratings Exercises 6-22, 6-26, 6-38,
6-42, 6-58, 6-78, 10-7 Gasoline cost by month Exercise 15-98
Gasoline mileage Exercises 10-89, 11-6, 11-17, 11-28, 11-44, 11-56, 12-27, 12-55, 12-57, 12-77, 12-89, 15-37
Heating rate index Exercise 14-46 Petroleum imports Exercise 6-72 Released from cells Exercise 2-168 Renewable energy consumption Exercise 15-78
Steam usage Exercises 11-5, 11-27, 11-43, 11-55
Wind power Exercises 4-132, 11-9 ENVIRONMENTAL
Arsenic Example 10-6
Exercises 12-12, 12-30, 12-48, 12-62, 12-76, 12-88, 13-39
Asbestos Exercises 4-85, 4-169
Biochemical oxygen demand (BOD) Exercises 11-13, 11-33, 11-51 Calcium concentration in lake water Exercise 8-9
Carbon dioxide in the atmosphere Exercise 3-58
Chloride in surface streams Exercises 11-10, 11-32, 11-48, 11-59
Cloud seeding Exercise 9-60
Earthquakes Exercises 6-63, 9-102, 11-15, 15-46
Emissions and fluoride emissions Exercises 2-28, 15-34 Global temperature Exercises 6-83, 11-74 Hydrophobic organic substances Exercise 10-93 Mercury contamination Example 8-4 Ocean wave height Exercise 4-181 Organic pollution Example 3-18
Oxygen concentration Exercises 8-94, 9-63, 9-140 Ozone levels Exercises 2-9, 11-90 Radon release Exercises 13-8, 13-20 Rainfall in Australia Exercises 8-33, 8-65, 8-77 Suspended solids in lake water Exercises 6-32, 6-48, 6-60,
6-80, 9-70
Voters and air pollution Exercises 9-27, 9-94 Waste water treatment tank Exercise 2-37 Water demand and quality Exercises 4-68, 9-137 Watershed yield Exercise 11-70 MATERIALS
Baked density of carbon anodes Exercise 14-4 Ceramic substrate Example 16-4 Coating temperature Exercises 10-24, 10-60 Coating weight and surface roughness Exercise 2-90 Compressive strength Exercises 7-56, 11-60 Flow rate on silicon wafers Exercises 13-2, 13-16, 15-28 Insulation ability Exercise 14-5
Insulation fluid breakdown time Exercises 6-8, 6-74 Izod impact test Exercises 8-28, 8-62, 8-74,
9-66, 9-80 Luminescent ink Exercise 5-28
Paint drying time Examples 10-1, 10-2, 10-3 Exercises 14-2, 14-19, 15-8, 15-16
Particle size Exercises 4-33, 16-17 Photoresist thickness Exercise 5-63
Plastic breaking strength Exercises 10-5, 10-20, 10-55 Polycarbonate plastic Example 2-8
Exercises 2-66, 2-76 Rockwell hardness Exercises 10-91, 9-115, 15-17 Temperature of concrete Exercise 9-58
Tensile strength of
Aluminum Example 10-4
Fiber Exercises 7-3, 7-4, 13-3, 13-17
Steel Example 10-9
Exercise 9-44
Paper Example 13-1
Exercises 4-154, 11-86 Titanium content Exercises 8-47, 9-79, 15-2,
15-12
Tube brightness in TV sets Exercises 7-12, 8-35, 8-67, 8-79, 9-148, 9-67, 14-1 MECHANICAL
Aircraft manufacturing Examples 6-6, 12-12, 14-1, 15-6, 16-1
Exercises 6-8, 8-97, 10-42, 15-31, 15-13, 15-74 Artillery shells Exercise 9-106 Beam delamination Exercises 8-32, 8-64
Bearings Examples 8-7, 8-8
Exercise 9-95
Diameter Exercises 4-181, 9-42, 15-6, 15-14
Wear Example 4-25
Applied Statistics and
Probability for Engineers
Sixth Edition
Douglas C. Montgomery
Arizona State University
George C. Runger
Meredith, Neil, Colin, and Cheryl
Rebecca, Elisa, George and Taylor
VICE PRESIDENT AND PUBLISHER Don Fowley AQUISITIONS EDITOR Linda Ratts OPERATIONS MANAGER Melissa Edwards CONTENT EDITOR Wendy Ashenberg SENIOR CONTENT MANAGER Kevin Holm SENIOR PRODUCTION EDITOR Jill Spikereit EXECUTIVE MARKETING MANAGER Christopher Ruel PRODUCT DESIGNER Jennifer Welter
DESIGN DIRECTOR Harry Nolan
DESIGNER Kristine Carney
PHOTO EDITOR Felicia Ruocco
PRODUCTION MANAGEMENT SERVICES Laserwords
COVER DESIGN Wendy Lai
Cover Photo © PaulFleet/iStockphoto
Chapter Opener Photos: © babyblueut/iStockphoto, Erik Isakson/Getty Images, Thinkstock Images/Comstock Images/Getty Images, © amriphoto/ iStockphoto, © Ralph125/iStockphoto, © Caro/Alamy, © EasyBuy4u/iStockphoto, © jkullander/iStockphoto, © Alain Nogues/Sygma/Corbis, © HKPNC/iStockphoto, © EdStock/iStockphoto, © skynesher/iStockphoto, © Vasko/iStockphoto, © RedHelga/iStockphoto, © doc-stock/©Corbis, Courtesy of Mike Johnson, www.redbead.com
This book was set by Laserwords Private Limited and printed and bound by RR Donnelley. The cover was printed by RR Donnelley. This book is printed on acid free paper.
Copyright © 2014, 2011, 2008, 2005, John Wiley & Sons, Inc. All rights reserved. No part of this publication may be reproduced, stored in a retrieval system or transmitted in any form or by any means, electronic, mechanical, photocopying, recording, scanning or otherwise, except as permitted under Sections 107 or 108 of the 1976 United States Copyright Act, without either the prior written permission of the Publisher, or authorization through payment of the appropriate per-copy fee to the Copyright Clearance Center, Inc. 222 Rosewood Drive, Danvers, MA 01923, website www.copyright.com. Requests to the Publisher for permission should be addressed to the Permissions Department, John Wiley & Sons, Inc., 111 River Street, Hoboken, NJ 07030-5774, (201)748-6011, fax (201)748-6008, website http://www.wiley.com/go/permissions.
Evaluation copies are provided to qualified academics and professionals for review purposes only, for use in their courses during the next academic year. These copies are licensed and may not be sold or transferred to a third party. Upon completion of the review period, please return the evalu-ation copy to Wiley. Return instructions and a free of charge return shipping label are available at www.wiley.com/go/returnlabel. Outside of the United States, please contact your local representative.
Library of Congress Cataloging-in-Publication Data
ISBN-13 9781118539712 ISBN (BRV)-9781118645062
Wiley Books by These Authors
Website: www.wiley.com/college/montgomery
Engineering Statistics, Fifth Edition
by Montgomery and Runger
Introduction to engineering statistics, with topical coverage appropriate for a one-semester
course. A modest mathematical level, and an applied approach.
Applied Statistics and Probability for Engineers, Sixth Edition
by Montgomery and Runger
Introduction to engineering statistics, with topical coverage appropriate for eityher a one or
two-semester course. An applied approach to solving real-world engineering problems.
Introduction to Statistical Quality Control, Seventh Edition
by Douglas C. Montgomery
For a first course in statistical quality control. A comprehensive treatment of statistical
methodology for quality control and improvement. Some aspects of quality management are also
included such as the six-sigma approach.
Design and Analysis of Experiments, Eighth Edition
by Douglas C. Montgomery
An introduction to design and analysis of expieriments, with the modes prerequisite of a first
course in statistical methods. For senior and graduate students for a practitioners, to design and
analyze experiments for improving the quality and efficiency of working systems.
Introduction to Linear Regression Analysis, Fifth Edition
by Mongomery, Peck and Vining
A comprehensive and thoroughly up to date look at regression analysis still most widely used
technique in statistics today.
Response Surface Methodology: Process and Product Optimization Using Designed
Experiments, Third Edition
Website: www.wiley.com/college/myers
The exploration and optimization of response surfaces, for graduate courses in experimental
design and for applied statisticians, engineers and chemical and physical scientists.
Generalized Linear Models: with Applications in Engineering and the Sciences, Second
Edition
by Myers, Montgomery and Vining
Website: www.wiley.com/college/myers
An introductory text or reference on generalized linewar models (GLMs). The range of theoretical
topics and applications appeals both to students and practicing professionals.
Introduction to Time Series Analysis and Forecasting
by Montgomery, Jennings and Kulahci
INTENDED AUDIENCE
This is an introductory textbook for a first course in applied statistics and probability for
undergraduate students in engineering and the physical or chemical sciences. These
indi-viduals play a significant role in designing and developing new products and manufacturing
systems and processes, and they also improve existing systems. Statistical methods are an
important tool in these activities because they provide the engineer with both descriptive
and analytical methods for dealing with the variability in observed data. Although many of
the methods we present are fundamental to statistical analysis in other disciplines, such as
business and management, the life sciences, and the social sciences, we have elected to focus
on an engineering-oriented audience. We believe that this approach will best serve students
in engineering and the chemical/physical sciences and will allow them to concentrate on the
many applications of statistics in these disciplines. We have worked hard to ensure that our
examples and exercises are engineering- and science-based, and in almost all cases we have
used examples of real data—either taken from a published source or based on our consulting
experiences.
We believe that engineers in all disciplines should take at least one course in statistics.
Unfortunately, because of other requirements, most engineers will only take one statistics
course. This book can be used for a single course, although we have provided enough material
for two courses in the hope that more students will see the important applications of statistics
in their everyday work and elect a second course. We believe that this book will also serve as
a useful reference.
We have retained the relatively modest mathematical level of the first five editions. We have
found that engineering students who have completed one or two semesters of calculus and
have some knowledge of matrix algebra should have no difficulty reading all of the text. It is
our intent to give the reader an understanding of the methodology and how to apply it, not the
mathematical theory. We have made many enhancements in this edition, including
reorganiz-ing and rewritreorganiz-ing major portions of the book and addreorganiz-ing a number of new exercises.
ORGANIZATION OF THE BOOK
Perhaps the most common criticism of engineering statistics texts is that they are too long.
Both instructors and students complain that it is impossible to cover all of the topics in the
book in one or even two terms. For authors, this is a serious issue because there is great variety
in both the content and level of these courses, and the decisions about what material to delete
without limiting the value of the text are not easy. Decisions about which topics to include in
this edition were made based on a survey of instructors.
Preface
vii
Chapters 2, 3, 4, and 5 cover the basic concepts of probability, discrete and continuous
random variables, probability distributions, expected values, joint probability distributions,
and independence. We have given a reasonably complete treatment of these topics but have
avoided many of the mathematical or more theoretical details.
Chapter 6 begins the treatment of statistical methods with random sampling; data
sum-mary and description techniques, including stem-and-leaf plots, histograms, box plots, and
probability plotting; and several types of time series plots. Chapter 7 discusses sampling
dis-tributions, the central limit theorem, and point estimation of parameters. This chapter also
introduces some of the important properties of estimators, the method of maximum
likeli-hood, the method of moments, and Bayesian estimation.
Chapter 8 discusses interval estimation for a single sample. Topics included are confidence
intervals for means, variances or standard deviations, proportions, prediction intervals, and
tol-erance intervals. Chapter 9 discusses hypothesis tests for a single sample. Chapter 10 presents
tests and confidence intervals for two samples. This material has been extensively rewritten and
reorganized. There is detailed information and examples of methods for determining
appropri-ate sample sizes. We want the student to become familiar with how these techniques are used to
solve real-world engineering problems and to get some understanding of the concepts behind
them. We give a logical, heuristic development of the procedures rather than a formal,
mathe-matical one. We have also included some material on nonparametric methods in these chapters.
Chapters 11 and 12 present simple and multiple linear regression including model
ade-quacy checking and regression model diagnostics and an introduction to logistic regression.
We use matrix algebra throughout the multiple regression material (Chapter 12) because it is
the only easy way to understand the concepts presented. Scalar arithmetic presentations of
multiple regression are awkward at best, and we have found that undergraduate engineers are
exposed to enough matrix algebra to understand the presentation of this material.
Chapters 13 and 14 deal with single- and multifactor experiments, respectively. The notions
of randomization, blocking, factorial designs, interactions, graphical data analysis, and
frac-tional factorials are emphasized. Chapter 15 introduces statistical quality control,
emphasiz-ing the control chart and the fundamentals of statistical process control.
WHAT’S NEW IN THIS EDITION
We received much feedback from users of the fifth edition of the book, and in response we
have made substantial changes in this new edition.
r #FDBVTFDPNQVUFSJOUFOTJWFNFUIPETBSFTPJNQPSUBOUJOUIFNPEFSOVTFPGTUBUJTUJDTXF
have added material on the bootstrap and its use in constructing confidence intervals.
r 8FIBWFJODSFBTFEUIFFNQIBTJTPOUIFVTFPG
P
-value in hypothesis testing. Many sections
of several chapters were rewritten to reflect this.
r .BOZTFDUJPOTPGUIFCPPLIBWFCFFOFEJUFEBOESFXSJUUFOUPJNQSPWFUIFFYQMBOBUJPOTBOE
try to make the concepts easier to understand.
r 5IFJOUSPEVDUPSZDIBQUFSPOIZQPUIFTJTUFTUJOHOPXJODMVEFTDPWFSBHFPGFRVJWBMFODFUFTU
-ing, a technique widely used in the biopharmaceutical industry, but which has widespread
applications in other areas.
r $PNCJOJOH
P
-values when performing mutiple tests is incuded.
r %FDJTJPOUIFPSZJTCSJFáZJOUSPEVDFEJO$IBQUFS
r 8FIBWFBEEFECSJFGDPNNFOUTBUUIFFOEPGFYBNQMFTUPFNQIBTJ[FUIFQSBDUJDBMJOUFSQSFUB
-tions of the results.
Learning Objectives
Learning Objectives at the start
of each chapter guide the students
in what they are expected to take
away from this chapter and serve as
a study reference.
FEATURED IN THIS BOOK
Definitions, Key Concepts, and Equations
Throughout the text, definitions and key
concepts and equations are highlighted by a
box to emphasize their importance.
Preface
ix
Figures
Numerous figures throughout
the text illustrate statistical concepts
in multiple formats.
Computer Output
Example throughout the book, use computer
output to illustrate the role of modern statistical
software.
Example Problems
Exercises
Each chapter has an extensive
collection of exercises, including
end-of-section exercises that
emphasize the material in that
section,
supplemental exercises
at the end of the chapter that cover
the scope of chapter topics and
require the student to make a
decision about the approach they
will use to solve the problem,
and
mind-expanding exercises
that often require the student to
extend the text material somewhat
or to apply it in a novel situation.
Answers are provided to most
odd-numbered exercises in Appendix C
in the text, and the
WileyPLUS
online learning environment
includes for students complete
detailed solutions to selected
exercises.
Important Terms and Concepts
At the end of each chapter is a list
of important terms and concepts
for an easy self-check and study
tool.
STUDENT RESOURCES
r %BUB4FUT%BUBTFUTGPSBMMFYBNQMFTBOEFYFSDJTFTJOUIFUFYU7JTJUUIFTUVEFOUTFDUJPOPG
the book Web site at www.wiley.com/college/montgomery to access these materials.
r 4UVEFOU 4PMVUJPOT .BOVBM %FUBJMFE TPMVUJPOT GPS TFMFDUFE QSPCMFNT JO UIF CPPL 5IF
Student Solutions Manual
may be purchased from the Web site at www.wiley.com/college/
montgomery.
INSTRUCTOR RESOURCES
The following resources are available only to instructors who adopt the text:
r
Solutions Manual All solutions to the exercises in the text.
r
Data Sets Data sets for all examples and exercises in the text.
r
Image Gallery of Text Figures
r
PowerPoint Lecture Slides
Preface
xi
These instructor-only resources are password-protected. Visit the instructor section of the
book Web site at www.wiley.com/college/montgomery to register for a password to access
these materials.
COMPUTER SOFTWARE
We have used several different packages, including Excel, to demonstrate computer usage.
Minitab can be used for most exercises. A student version of Minitab is available as an option to
purchase in a set with this text. Student versions of software often do not have all the functionality
that full versions do. Consequently, student versions may not support all the concepts presented
in this text. If you would like to adopt for your course the set of this text with the student version
of Minitab, please contact your local Wiley representative at www.wiley.com/college/rep.
Alternatively, students may find information about how to purchase the professional
version of the software for academic use at www.minitab.com.
WileyPLUS
This online teaching and learning environment integrates the entire digital textbook with the
most effective instructor and student resources to fit every learning style.
With
WileyPLUS
:
r 4UVEFOUTBDIJFWFDPODFQUNBTUFSZJOBSJDITUSVDUVSFEFOWJSPONFOUUIBUTBWBJMBCMF
r *OTUSVDUPSTQFSTPOBMJ[FBOENBOBHFUIFJSDPVSTFNPSFFGGFDUJWFMZXJUIBTTFTTNFOUBTTJHO
-ments, grade tracking, and more.
WileyPLUS
can complement your current textbook or replace the printed text altogether.
For Students
Personalize the learning experience
Different learning styles, different levels of proficiency, different levels of preparation—each of
your students is unique.
WileyPLUS
empowers them to take advantage of their individual strengths:
r 4UVEFOUTSFDFJWFUJNFMZBDDFTTUPSFTPVSDFTUIBUBEESFTTUIFJSEFNPOTUSBUFEOFFETBOEHFU
immediate feedback and remediation when needed.
r *OUFHSBUFE NVMUJNFEJB SFTPVSDFTJODMVEJOH BVEJP BOE WJTVBM FYIJCJUT EFNPOTUSBUJPO
QSPCMFNTBOENVDINPSFQSPWJEFNVMUJQMFTUVEZQBUITUPàUFBDITUVEFOUTMFBSOJOHQSFG
-erences and encourage more active learning.
r
WileyPLUS
includes many opportunities for self-assessment linked to the relevant portions
of the text. Students can take control of their own learning and practice until they master
the material.
For Instructors
Personalize the teaching experience
WileyPLUS
empowers you with the tools and resources you need to make your teaching even
more effective:
r :PVDBODVTUPNJ[FZPVSDMBTTSPPNQSFTFOUBUJPOXJUIBXFBMUIPGSFTPVSDFTBOEGVODUJPOBM
-JUZGSPN1PXFS1PJOUTMJEFTUPBEBUBCBTFPGSJDIWJTVBMT:PVDBOFWFOBEEZPVSPXONBUFSJ
-als to your
WileyPLUS
course.
r 8JUI
WileyPLUS
you can identify those students who are falling behind and intervene
accordingly, without having to wait for them to come to office hours.
COURSE SYLLABUS SUGGESTIONS
5IJT JT B WFSZ áFYJCMF UFYUCPPL CFDBVTF JOTUSVDUPST JEFBT BCPVU XIBU TIPVME CF JO B àSTU
course on statistics for engineers vary widely, as do the abilities of different groups of
stu-dents. Therefore, we hesitate to give too much advice, but will explain how we use the book.
We believe that a first course in statistics for engineers should be primarily an applied statistics
course, not a probability course. In our one-semester course we cover all of Chapter 1 (in one or
two lectures); overview the material on probability, putting most of the emphasis on the normal
distribution (six to eight lectures); discuss most of Chapters 6 through 10 on confidence intervals
and tests (twelve to fourteen lectures); introduce regression models in Chapter 11 (four lectures);
give an introduction to the design of experiments from Chapters 13 and 14 (six lectures); and
present the basic concepts of statistical process control, including the Shewhart control chart
from Chapter 15 (four lectures). This leaves about three to four periods for exams and review.
Let us emphasize that the purpose of this course is to introduce engineers to how statistics can
be used to solve real-world engineering problems, not to weed out the less mathematically gifted
students. This course is not the “baby math-stat” course that is all too often given to engineers.
If a second semester is available, it is possible to cover the entire book, including much of
the supplemental material, if appropriate for the audience. It would also be possible to assign
and work many of the homework problems in class to reinforce the understanding of the
con-cepts. Obviously, multiple regression and more design of experiments would be major topics
in a second course.
USING THE COMPUTER
In practice, engineers use computers to apply statistical methods to solve problems. Therefore,
we strongly recommend that the computer be integrated into the class. Throughout the book
we have presented typical example of the output that can be obtained with modern statistical
software. In teaching, we have used a variety of software packages, including Minitab,
Stat-graphics, JMP, and Statistica. We did not clutter up the book with operational details of these
different packages because how the instructor integrates the software into the class is
ultimate-ly more important than which package is used. All text data are available in electronic form
on the textbook Web site. In some chapters, there are problems that we feel should be worked
using computer software. We have marked these problems with a special icon in the margin.
In our own classrooms, we use the computer in almost every lecture and demonstrate how the
technique is implemented in software as soon as it is discussed in the lecture. Student versions
of many statistical software packages are available at low cost, and students can either purchase
their own copy or use the products available through the institution. We have found that this
greatly improves the pace of the course and student understanding of the material.
Preface
xiii
ACKNOWLEDGMENTS
We would like to express our grateful appreciation to the many organizations and individuals
who have contributed to this book. Many instructors who used the previous editions provided
excellent suggestions that we have tried to incorporate in this revision.
We would like to thank the following who assisted in contributing to and/or reviewing
material for the
WileyPLUS
course:
Michael DeVasher,
Rose-Hulman Institute of Technology
Craig Downing,
Rose-Hulman Institute of Technology
Julie Fortune,
University of Alabama in Huntsville
Rubin Wei,
Texas A&M University
We would also like to thank the following for their assistance in checking the accuracy and
completeness of the exercises and the solutions to exercises.
Dr. Abdelaziz Berrado
Dr. Connie Borror
Aysegul Demirtas
Kerem Demirtas
Patrick Egbunonu, Sindhura Gangu
James C. Ford
Dr. Alejandro Heredia-Langner
Dr. Jing Hu
Dr. Busaba Laungrungrong
Dr. Fang Li
Dr. Nuttha Lurponglukana
4BSBI4USFFUU:PMBOEF5SB
Dr. Lora Zimmer
We are also indebted to Dr. Smiley Cheng for permission to adapt many of the statistical
tables from his excellent book (with Dr. James Fu),
Statistical Tables for Classroom and Exam
Room
. Wiley, Prentice Hall, the Institute of Mathematical Statistics, and the editors of
Biomet-rics allowed us to use copyrighted material, for which we are grateful.
Douglas C. Montgomery
Inside Front cover
Index of Applications
Examples and Exercises
Chapter 1
The Role of Statistics in Engineering 1
1-1
The Engineering Method and Statistical
Thinking 2
1-2
Collecting Engineering Data 4
1-2.1 Basic Principles 4
1-2.2 Retrospective Study 5
1-2.3 Observational Study 5
1-2.4 Designed Experiments 6
1-2.5 Observing Processes Over Time 8
1-3
Mechanistic and Empirical Models 11
1-4
Probability and Probability Models 12
Chapter 2
Probability 15
2-1
Sample Spaces and Events 16
2-1.1 Random Experiments 16
2-1.2 Sample Spaces 17
2-1.3 Events 20
2-1.4 Counting Techniques 22
2-2
Interpretations and Axioms of Probability 30
2-3
Addition Rules 35
2-4
Conditional Probability 40
2-5
Multiplication and Total Probability
Rules 45
2-6
Independence 49
#BZFT5IFPSFN
2-8
Random Variables 57
Chapter 3
Discrete Random Variables and
Probability Distributions 65
3-1
Discrete Random Variables 66
3-2
Probability Distributions and Probability Mass
Functions 67
3-3
Cumulative Distribution Functions 71
3-4
Mean and Variance of a Discrete Random
Variable 74
3-5
Discrete Uniform Distribution 78
3-6
Binomial Distribution 80
3-7
Geometric and Negative Binomial
Distributions 86
3-7.1 Geometric Distribution 86
3-8
Hypergeometric Distribution 93
3-9
Poisson Distribution 98
Chapter 4
Continuous Random Variables
and Probability Distributions 107
4-1
Continuous Random Variables 108
4-2
Probability Distributions and Probability
Density Functions 108
4-3
Cumulative Distribution Functions 112
4-4
Mean and Variance of a Continuous
Random Variable 114
4-5
Continuous Uniform Distribution 116
4-6
Normal Distribution 119
4-7
Normal Approximation to the Binomial and
Poisson Distributions 128
4-8
Exponential Distribution 133
4-9
Erlang and Gamma Distributions 139
4-10 Weibull Distribution 143
4-11 Lognormal Distribution 145
4-12 Beta Distribution 148
Chapter 5
Joint Probability Distributions 155
5-1
Two or More Random Variables 156
5-1.1 Joint Probability Distributions 156
5-1.2 Marginal Probability Distributions 159
5-1.3 Conditional Probability Distributions 161
5-1.4 Independence 164
5-1.5 More Than Two Random Variables 167
5-2
Covariance and Correlation 174
5-3
Common Joint Distributions 179
5-3.1 Multinomial Probability Distribution 179
5-3.2 Bivariate Normal Distribution 181
5-4
Linear Functions of Random Variables 184
5-5
General Functions of Random Variables 188
5-6
Moment-Generating Functions 191
Chapter 6
Descriptive Statistics 199
6-1
Numerical Summaries of Data 200
6-2
Stem-and-Leaf Diagrams 206
6-3
Frequency Distributions and Histograms 213
6-4
Box Plots 217
6-5
Time Sequence Plots 219
6-6
Scatter Diagrams 225
6-7
Probability Plots 230
Chapter 7
Point Estimation of Parameters and
Sampling Distributions 239
Contents
xv
7-2
Sampling Distributions
and the Central Limit Theorem 241
7-3
General Concepts of Point Estimation 249
7-3.1 Unbiased Estimators 249
7-3.2 Variance of a Point Estimator 251
7-3.3 Standard Error: Reporting a Point
Estimate 251
7.3.4 Bootstrap Standard Error 252
7-3.5 Mean Squared Error of an Estimator 254
7-4
Methods of Point Estimation 256
7-4.1 Method of Moments 256
7-4.2 Method of Maximum Likelihood 258
7-4.3 Bayesian Estimation of
Parameters 264
Chapter 8
Statistical Intervals for a
Single Sample 271
8-1
Confidence Interval on the Mean of a Normal
Distribution, Variance Known 273
8-1.1 Development of the Confidence Interval
and Its Basic Properties 273
8-1.2 Choice of Sample Size 276
8-1.3 One-Sided Confidence Bounds 277
8-1.4 General Method to Derive a Confidence
Interval 277
8-1.5 Large-Sample Confidence Interval
for μ 279
8-2
Confidence Interval on the Mean of a Normal
Distribution, Variance Unknown 282
8-2.1
t
Distribution 283
8-2.2
t
Confidence Interval on μ 284
8-3
Confidence Interval on the Variance and
Standard Deviation of a Normal
Distribution 287
8-4
Large-Sample Confidence Interval
for a Population Proportion 291
8-5
Guidelines for Constructing Confidence
Intervals 296
8.6
Bootstrap Confidence Interval 296
8-7
Tolerance and Prediction Intervals 297
8-7.1 Prediction Interval for a Future
Observation 297
8-7.2 Tolerance Interval for a Normal
Distribution 298
Chapter 9
Tests of Hypotheses for a
Single Sample 305
9-1
Hypothesis Testing 306
9-1.1 statistical hypotheses 306
9-1.2 Tests of Statistical Hypotheses 308
9-1.3 One-Sided and Two-Sided
Hypotheses 313
9-1.4
P
-Values in Hypothesis Tests 314
9-1.5 Connection Between Hypothesis Tests
and Confidence Intervals 316
9-1.6 General Procedure for Hypothesis
Tests 318
9-2
Tests on the Mean of a Normal Distribution,
Variance Known 322
9-2.1 Hypothesis Tests on the Mean 322
9-2.2 Type II Error and Choice of Sample
Size 325
9-2.3 Large-Sample Test 329
9-3
Tests on the Mean of a Normal Distribution,
Variance Unknown 331
9-3.1 Hypothesis Tests on the Mean 331
9-3.2 Type II Error and Choice of Sample
Size 336
9-4
Tests on the Variance and Standard
Deviation of a Normal Distribution 340
9-4.1 Hypothesis Tests on the Variance 341
9-4.2 Type II Error and Choice of Sample
Size 343
9-5
Tests on a Population Proportion 344
9-5.1 Large-Sample Tests on a Proportion 344
9-5.2 Type II Error and Choice of Sample
Size 347
9-6
Summary Table of Inference Procedures
for a Single Sample 350
9-7
Testing for Goodness of Fit 350
9-8
Contingency Table Tests 354
9-9
Nonparametric Procedures 357
9-9.1 The Sign Test 358
9-9.2 The Wilcoxon Signed-Rank Test 362
9-9.3 Comparison to the
t
-Test 364
9-10 Equivalence Testing 365
9-11 Combining
P
-Values 367
Chapter 10
Statistical Inference for
Two Samples 373
10-1 Inference on the Difference in Means of Two
Normal Distributions, Variances Known 374
10-1.1 Hypothesis Tests on the Difference in
Means, Variances Known 376
10-1.2 Type II Error and Choice of Sample
Size 377
10-1.3 Confidence Interval on the Difference in
Means, Variances Known 379
10-2.1 Hypotheses Tests on the Difference in
Means, Variances Unknown 383
10-2.2 Type II Error and Choice of Sample
Size 389
10-2.3 Confidence Interval on the Difference in
Means, Variances Unknown 390
10-3 A Nonparametric Test for the Difference in Two
Means 396
10-3.1 Description of the Wilcoxon Rank-Sum
Test 397
10-3.2 Large-Sample Approximation 398
10-3.3 Comparison to the
t
-Test 399
10-4 Paired
t
-Test 400
10-5 Inference on the Variances of Two Normal
Distributions 407
10-5.1
F
Distribution 407
10-5.2 Hypothesis Tests on the Ratio of Two
Variances 409
10-5.3 Type II Error and Choice of Sample
Size 411
10-5.4 Confidence Interval on the Ratio of Two
Variances 412
10-6 Inference on Two Population
Proportions 414
10-6.1 Large-Sample Tests on the Difference in
Population Proportions 414
10-6.2 Type II Error and Choice of Sample
Size 416
10-6.3 Confidence Interval on the Difference in
Population Proportions 417
10-7 Summary Table and Road Map for Inference
Procedures for Two Samples 420
Chapter 11
Simple Linear Regression
and Correlation 427
11-1 Empirical Models 428
11-2 Simple Linear Regression 431
11-3 Properties of the Least Squares
Estimators 440
11-4 Hypothesis Tests in Simple Linear
Regression 441
11-4.1 Use of
t
-Tests 441
11-4.2 Analysis of Variance Approach to Test
Significance of Regression 443
11-5 Confidence Intervals 447
11-5.1 Confidence Intervals on the Slope and
Intercept 447
11-5.2 Confidence Interval on the Mean
Response 448
11-6 Prediction of New Observations 449
11-7 Adequacy of the Regression Model 452
11-7.1 Residual Analysis 453
11-7.2 Coefficient of Determination
(
R
2) 454
11-8 Correlation 457
11-9 Regression on Transformed Variables 463
11-10 Logistic Regression 467
Chapter 12
Multiple Linear Regression 477
12-1 Multiple Linear Regression Model 478
12-1.1 Introduction 478
12-1.2 Least Squares Estimation of the
Parameters 481
12-1.3 Matrix Approach to Multiple Linear
Regression 483
12-1.4 Properties of the Least Squares
Estimators 488
12-2 Hypothesis Tests In Multiple Linear
Regression 497
12-2.1 Test for Significance
of Regression 497
12-2.2 Tests on Individual Regression
Coefficients and Subsets of
Coefficients 500
12-3 Confidence Intervals In Multiple Linear
Regression 506
12-3.1 Confidence Intervals on Individual
Regression Coefficients 506
12-3.2 Confidence Interval on the Mean
Response 507
12-4 Prediction of New Observations 508
12-5 Model Adequacy Checking 511
12-5.1 Residual Analysis 511
12-5.2 Influential Observations 514
12-6 Aspects of Multiple Regression
Modeling 517
12-6.1 Polynomial Regression Models 517
12-6.2 Categorical Regressors and Indicator
Variables 519
12-6.3 Selection of Variables and Model
Building 522
12-6.4 Multicollinearity 529
Chapter 13
Design and Analysis of Single-Factor
Experiments: The Analysis of Variance 539
13-1 Designing Engineering Experiments 540
13-2 Completely Randomized Single-Factor
Experiment 541
13-2.1 Example: Tensile Strength 541
13-2.2 Analysis of Variance 542
Contents
xvii
13-2.4 Residual Analysis and Model
Checking 551
13-2.5 Determining Sample Size 553
13-3 The Random-Effects Model 559
13-3.1 Fixed Versus Random Factors 559
13-3.2 ANOVA and Variance Components 560
13-4 Randomized Complete Block Design 565
13-4.1 Design and Statistical Analysis 565
13-4.2 Multiple Comparisons 570
13-4.3 Residual Analysis and Model
Checking 571
Chapter 14
Design of Experiments with Several
Factors 575
14-1 Introduction 576
14-2 Factorial Experiments 578
14-3 Two-Factor Factorial Experiments 582
14-3.1 Statistical Analysis of the Fixed-Effects
Model 582
14-3.2 Model Adequacy Checking 587
14-3.3 One Observation per Cell 588
14-4 General Factorial Experiments 591
14-5 2
kFactorial Designs 594
14-5.1 2
2Design 594
14-5.2 2
kDesign for
k
≥3 Factors 600
14-5.3 Single Replicate of the 2
kDesign 607
14-5.4 Addition of Center Points to
a 2
kDesign 611
14-6 Blocking and Confounding in the 2
kDesign 619
14-7 Fractional Replication of the 2
kDesign 626
14-7.1 One-Half Fraction of the
2
kDesign 626
14-7.2 Smaller Fractions: The 2
k–pFractional
Factorial 632
14-8 Response Surface Methods and Designs 643
Chapter 15
Statistical Quality Control 663
15-1 Quality Improvement and Statistics 664
15-1.1 Statistical Quality Control 665
15-1.2 Statistical Process Control 666
15-2 Introduction to Control Charts 666
15-2.1 Basic Principles 666
15-2.2 Design of a Control Chart 670
15-2.3 Rational Subgroups 671
15-2.4 Analysis of Patterns on Control Charts
672
15-3
X
–
and
R
or
S
Control Charts 674
15-4 Control Charts for Individual
Measurements 684
15-5 Process Capability 692
15-6 Attribute Control Charts 697
15-6.1
P
Chart (Control Chart for
Proportions) 697
15-6.2
U
Chart (Control Chart for Defects per
Unit) 699
15-7 Control Chart Performance 704
15-8 Time-Weighted Charts 708
15-8.1 Cumulative Sum Control Chart 709
15-8.2
Exponentially Weighted
Moving-Average Control Chart 714
15-9 Other SPC Problem-Solving Tools 722
15-10 Decision Theory 723
15-10.1 Decision Models 723
15-10.2 Decision Criteria 724
15-11 Implementing SPC 726
Appendix A.
Statistical Tables and Charts 737
Table I Summary of Common Probability
Distributions 738
Table II Cumulative Binomial Probabilities
P X
(
≤
x
)
739
Table III Cumulative Standard Normal
Distribution 742
Table IV Percentage Points
χ
α2,vof the Chi-Squared
Distribution 744
Table V Percentage Points
t
α,vof the
t
Distribution 745
Table VI Percentage Points
f
α, ,v v1 2of the
F
Distribution 746
Chart VII Operating Characteristic Curves 751
Table VIII Critical Values for the Sign Test 760
Table IX Critical Values for the Wilcoxon Signed-Rank
Test 760
Table X Critical Values for the Wilcoxon Rank-Sum
Test 761
Table XI Factors for Constructing Variables Control
Charts 762
Table XII Factors for Tolerance Intervals 762
Appendix B:
Bibliography 765
Appendix C:
Answers to Selected Exercises 769
Glossary
787
Index
803
1
Statistics is a science that helps us make decisions and draw
conclusions in the presence of variability. For example, civil
engineers working in the transportation fi eld are concerned
about the capacity of regional highway systems. A typical
problem related to transportation would involve data regarding
this specifi c system’s number of nonwork, home-based trips,
the number of persons per household, and the number of
vehi-cles per household. The objective would be to produce a
trip-generation model relating trips to the number of persons per
household and the number of vehicles per household. A
statis-tical technique called
regression analysis
can be used to
con-struct this model. The trip-generation model is an important
tool for transportation systems planning. Regression methods
are among the most widely used statistical techniques in
engi-neering. They are presented in Chapters 11 and 12.
The hospital emergency department (ED) is an important
part of the healthcare delivery system. The process by which
patients arrive at the ED is highly variable and can depend on
the hour of the day and the day of the week, as well as on
longer-term cyclical variations. The service process is also
highly variable, depending on the types of services that the
patients require, the number of patients in the ED, and how the
ED is staffed and organized. An ED’s capacity is also limited;
consequently, some patients experience long waiting times.
How long do patients wait, on average? This is an important
question for healthcare providers. If waiting times become
excessive, some patients will leave without receiving treatment
LWOT. Patients who LWOT are a serious problem, because
they do not have their medical concerns addressed and are at
risk for further problems and complications. Therefore, another
1
The Role of Statistics in
Engineering
Chapter Outline
1-1 The Engineering Method and Statistical
Thinking
1-2 Collecting Engineering Data
1-2.1 Basic Principles
1-2.2 Retrospective Study
1-2.3 Observational Study
1-2.4 Designed Experiments
1-2.5 Observing Processes Over Time
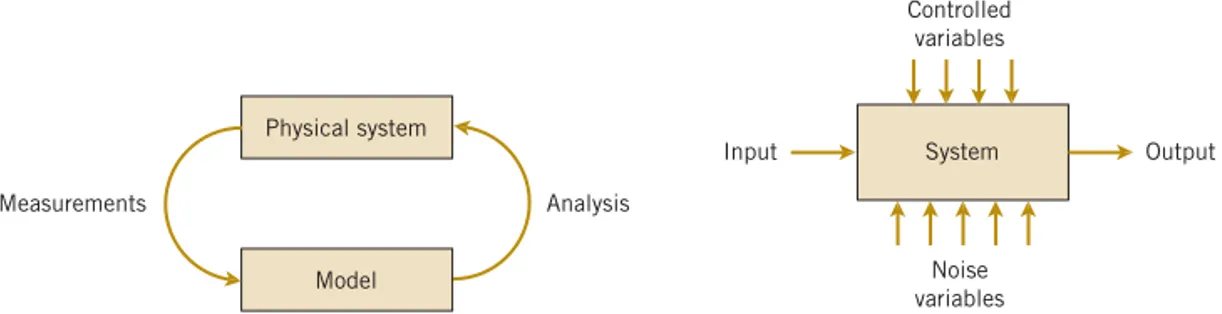
1-3 Mechanistic and Empirical Models
important question is: What proportion of patients LWOT from the ED? These questions can be
solved by employing probability models to describe the ED, and from these models very precise
estimates of waiting times and the number of patients who LWOT can be obtained. Probability
models that can be used to solve these types of problems are discussed in Chapters 2 through 5.
The concepts of probability and statistics are powerful ones and contribute extensively to
the solutions of many types of engineering problems. You will encounter many examples of
these applications in this book.
Learning Objectives
After careful study of this chapter, you should be able to do the following:
1. Identify the role that statistics can play in the engineering problem-solving process
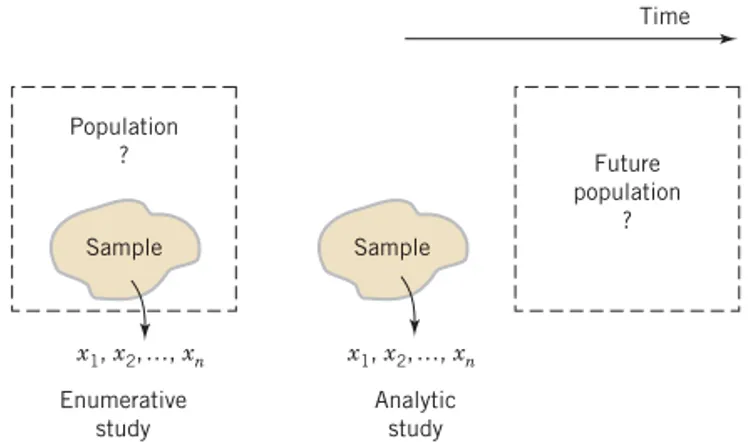
2. Discuss how variability affects the data collected and used for making engineering decisions 3. Explain the difference between enumerative and analytical studies
4. Discuss the different methods that engineers use to collect data
5. Identify the advantages that designed experiments have in comparison to other methods of collecting engineering data
6. Explain the differences between mechanistic models and empirical models
7. Discuss how probability and probability models are used in engineering and science
1-1
The Engineering Method and Statistical Thinking
An engineer is someone who solves problems of interest to society by the efficient application of
scientific principles. Engineers accomplish this by either refining an existing product or process
or by designing a new product or process that meets customers’ needs. The
engineering
, or
scientific
,
method
is the approach to formulating and solving these problems. The steps in the
engineering method are as follows:
1.
Develop a clear and concise description of the problem.
2.
Identify, at least tentatively, the important factors that affect this problem or that may play
a role in its solution.
3.
Propose a model for the problem, using scientific or engineering knowledge of the
phenomenon being studied. State any limitations or assumptions of the model.
4.
Conduct appropriate experiments and collect data to test or validate the tentative model or
conclusions made in steps 2 and 3.
5.
Refine the model on the basis of the observed data.
6.
Manipulate the model to assist in developing a solution to the problem.
7.
Conduct an appropriate experiment to confirm that the proposed solution to the problem is
both effective and efficient.
8.
Draw conclusions or make recommendations based on the problem solution.
Section 1-1/The Engineering Method and Statistical Thinking
3
The field of statistics deals with the collection, presentation, analysis, and use of data to make
decisions, solve problems, and design products and processes. In simple terms, statistics is the
sci-ence of data. Because many aspects of engineering practice involve working with data, obviously
knowledge of statistics is just as important to an engineer as are the other engineering sciences.
Specifically, statistical techniques can be powerful aids in designing new products and systems,
improving existing designs, and designing, developing, and improving production processes.
Statistical methods are used to help us describe and understand variability. By variability, we
mean that successive observations of a system or phenomenon do not produce exactly the same
result. We all encounter variability in our everyday lives, and
statistical thinking
can give us a
useful way to incorporate this variability into our decision-making processes. For example,
con-sider the gasoline mileage performance of your car. Do you always get exactly the same mileage
performance on every tank of fuel? Of course not — in fact, sometimes the mileage performance
varies considerably. This observed variability in gasoline mileage depends on many factors, such
as the type of driving that has occurred most recently (city versus highway), the changes in the
vehicle’s condition over time (which could include factors such as tire inflation, engine
com-pression, or valve wear), the brand and/or octane number of the gasoline used, or possibly even
the weather conditions that have been recently experienced. These factors represent potential
sources of variability in the system. Statistics provides a framework for describing this
vari-ability and for learning about which potential sources of varivari-ability are the most important or
which have the greatest impact on the gasoline mileage performance.
We also encounter variability in dealing with engineering problems. For example, suppose
that an engineer is designing a nylon connector to be used in an automotive engine application.
The engineer is considering establishing the design specification on wall thickness at
3 32
inch
but is somewhat uncertain about the effect of this decision on the connector pull-off force. If
the pull-off force is too low, the connector may fail when it is installed in an engine. Eight
prototype units are produced and their pull-off forces measured, resulting in the following
data (in pounds):
12 6 12 9 13 4 12 3 13 6 13 5 12 6 13 1
. ,
. ,
. ,
. ,
. ,
. ,
. ,
.
. As we anticipated, not all of
the prototypes have the same pull-off force. We say that there is variability in the pull-off force
measurements. Because the pull-off force measurements exhibit variability, we consider the
pull-off force to be a
random variable
. A convenient way to think of a random variable, say
X
,
that represents a measurement is by using the model
X
5m 1 e
(1-1)
where
m
is a constant and
e
is a random disturbance. The constant remains the same with every
measurement, but small changes in the environment, variance in test equipment, differences
in the individual parts themselves, and so forth change the value of
e
. If there were no
distur-bances,
e
would always equal zero and
X
would always be equal to the constant
m
. However,
this never happens in the real world, so the actual measurements
X
exhibit variability. We
often need to describe, quantify, and ultimately reduce variability.
Figure 1-2 presents a dot diagram of these data. The dot diagram is a very useful plot for
displaying a small body of data—say, up to about 20 observations. This plot allows us to easily
see two features of the data: the location, or the middle, and the scatter or variability. When
the number of observations is small, it is usually difficult to identify any specific patterns in the
variability, although the dot diagram is a convenient way to see any unusual data features.
The Science of Data
Variability
FIGURE 1-1
The engineering method.
Develop aclear description
Identify the important
factors
Propose or refine a
model
Conduct experiments
Manipulate the model
Confirm the solution
The need for statistical thinking arises often in the solution of engineering problems. Consider
the engineer designing the connector. From testing the prototypes, he knows that the average
pull-off force is 13.0 pounds. However, he thinks that this may be too low for the intended application,
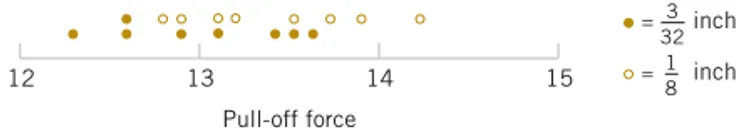
so he decides to consider an alternative design with a thicker wall,
1 8
inch in thickness. Eight
pro-totypes of this design are built, and the observed pull-off force measurements are 12.9, 13.7, 12.8,
13.9, 14.2, 13.2, 13.5, and 13.1. The average is 13.4. Results for both samples are plotted as dot
diagrams in Fig. 1-3. This display gives the impression that increasing the wall thickness has led to
an increase in pull-off force. However, there are some obvious questions to ask. For instance, how
do we know that another sample of prototypes will not give different results? Is a sample of eight
prototypes adequate to give reliable results? If we use the test results obtained so far to conclude
that increasing the wall thickness increases the strength, what risks are associated with this
deci-sion? For example, is it possible that the apparent increase in pull-off force observed in the thicker
prototypes is due only to the inherent variability in the system and that increasing the thickness of
the part (and its cost) really has no effect on the pull-off force?
Often, physical laws (such as Ohm’s law and the ideal gas law) are applied to help design
prod-ucts and processes. We are familiar with this reasoning from general laws to specific cases. But it
is also important to reason from a specific set of measurements to more general cases to answer
the previous questions. This reasoning comes from a sample (such as the eight connectors) to
a population (such as the connectors that will be in the products that are sold to customers).
The reasoning is referred to as statistical inference. See Fig. 1-4. Historically, measurements
were obtained from a sample of people and generalized to a population, and the terminology has
remained. Clearly, reasoning based on measurements from some objects to measurements on all
objects can result in errors (called
sampling errors
). However, if the sample is selected properly,
these risks can be quantified and an appropriate sample size can be determined.
1-2
Collecting Engineering Data
1-2.1
BASIC PRINCIPLES
In the previous subsection, we illustrated some simple methods for summarizing data.
Some-times the data are all of the observations in the population. This results in a census. However,
in the engineering environment, the data are almost always a sample that has been selected
from the population. Three basic methods of collecting data are
r
A
retrospective study
using historical data
r
An
observational study
r
A
designed experiment
Population andSamples
12 13 14 15
Pull-off force
FIGURE 1-2
Dot diagram of the pull-off force
data when wall thickness is 3 32 inch.
12 13 14 15
Pull-off force
3 32inch
inch =
1 8 =
FIGURE 1-3
Dot diagram of pull-off force for two wall
thicknesses.
FIGURE 1-4
Statistical
inference is one
type of reasoning.
Physical laws
Types of reasoning
Product designs
Population
Statistical inference
Section 1-2/Collecting Engineering Data