Detection and Prediction of Epileptic Seizures: A Patient's Case Study
Pablo F. Verdes
Instituto de Física Rosario (CONICET-Universidad Nacional de Rosario) Boulevard 27 de Febrero 210 Bis, 2000 Rosario, Argentina
Gustavo Deco, Dragan Obradovic
Siemens AG, Corporate Technology, ZT IK 4 Otto-Hahn-Ring 6, 81739 Munich, Germany {Gustavo.Deco, Dragan.Obradovic}@mchp.siemens.de
Louis J. Dubé
Département de Physique, Université Laval
1646 Pavillon Alexandre-Vachon, G1K 7P4 Québec, Canada [email protected]
Ruediger Hopfengaertner, Hermann Stefan
Department of Neurology, University of Erlangen-Nuremberg Schwabachanlage 6, D-91054 Erlangen, Germany
{Ruediger.Hopfengaertner, Hermann.Stefan}@neuro.med.uni-erlangen.de
Abstract
Human epilepsy is a disease characterized by sudden, unprovoked, recurrent seizures accompanied by pathological electrical activity in the brain, and is frequently resistant to drug treatment. The ability to anticipate the onset of these incapacitating episodes would -hopefully- permit clinical interventions and avoid the serious consequences they may provoque. In this work we first consider the problem of detection of the onset of an epileptic seizure, comparing linear and non-linear techniques of time series analysis applied to electro-encephalogram recordings against onset times determined clinically. Automatic detection would be useful for fast seizure recognition which is of importance for further diagnostic procedures. The second, more ambitious goal is to foresee the ocurrence of an upcoming seizure, exploiting the widely conjectured "decrease in complexity" associated with ictal episodes. Roughly speaking, we monitor changes in time-varying windowed estimates of different magnitudes characterizing the brain's intrinsic dynamics. We face these problems for five seizures belonging to a single patient, using two strategies of brain activity reconstruction: single and multiple-channel delay embedding of the dynamics. We have found that the studied approaches successfully reflect the non-stationary character of ictal episodes, and seizure onsets were clearly accussed. For prediction, the criteria employed in the determination of clinical onset times appeared crucial.
1. Introduction
Epilepsy is a principal brain dysfunction affecting 0.8% of humans[1]. There is no other illness in which the patient may be totally and unpredictably incapacitated for only a few minutes a year, and thus seriously handicapted throughout his life. It is precisely this group of people who stand to gain the most from any improvement in their therapeutic regime. The ability to anticipate the onset of seizures would -hopefully- permit clinical interventions and avoid the last resort procedure, surgery. Surgical interventions are often performed with the aim of excising the portion of brain tissue supposed to be responsible for seizure initiation. Such a treatment is only useful, of course, when enough epileptogenic brain tissue may be removed to prevent (or at least drastically reduce) the ocurrence of seizures without leading to important functional and neuropsychological deficits. The purpose of this work is twofold. Firstly, we consider the problem of detection of the onset of an epileptic seizure comparing linear and non-linear techniques of time series analysis applied to electro-encephalogram (EEG) recordings. We intend to make this detection automatic, objective and independent of any other monitoring of the patient, e.g. video observation. The second, more ambitious goal is to foresee the ocurrence of an upcoming seizure. Since epilepsy is viewed as abnormally discharging neurons acting as pacemakers to recruit and entrain other normal neurons by syncronization into a critical mass, pre-ictal dynamical changes should be detectable during this recruitment stage.
In order to appraise the timings of our detections, we compare against clinical seizure onset times. We determined a priori these reference times by an off-line joint evaluation of the raw signals and the synchronized videotape of the patient.
We will face these problems for five seizures belonging to a single patient (refer to the Appendix for a technical description of the data sets). We will use two strategies of brain activity reconstruction: single- and multiple-channel delay embedding of the dynamics. The first one was put into mathematical grounds by Takens[2] and is particularly useful when only one measured magnitude is available from the system, by far the most common situation in practice. The second was first studied by Whitney[3], and when the same variable is recorded at different locations, it takes into account the spatio-temporal character of the system.
The idea behind this work is essentially that of a stationarity test. We will quantify the dynamics in a slicing temporal window, seeking for significant changes. We shall not assess the changes of these running magnitudes with a statistical significance test, but content ourselves with the search for the most sensitive measure.
The organization of this work is as follows: in Section 2 we describe the dynamical characterizations we employed to monitor the non-stationarity of EEG. In Section 3 we present the results, both for single- and multiple-channel reconstructions. Finally, in Section 4 we collect our main conclusions.
2. Quantifying the dynamics
15-dimensional space after choosing the group of 3 neighbouring electrodes exhibiting the earliest single deflections. Brief descriptions of the methods follow.
2.1. Standard Deviation (SD)
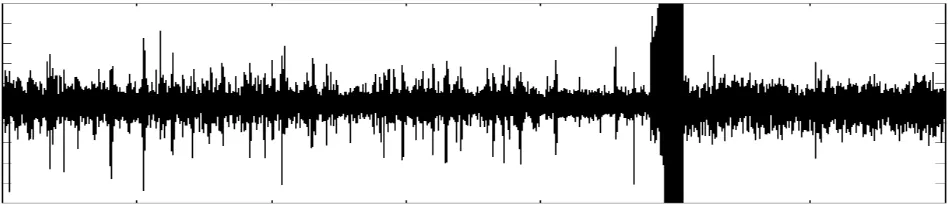
[image:3.595.58.533.226.331.2]This is the simplest strategy that one could think of, and is readily suggested by direct observation of the raw signal. Some channels show a dramatic increase of this quantity upon seizure onset (see Figure 1); for others, however, this evidence is not clear. It will play the role of a dumb detector giving a ground performance against which other more sophisticated methodologies will be tested.
Figure 1: Example of an EEG signal exhibiting a burst at seizure onset.
2.2. Rank of the Covariance Matrix (RCM)
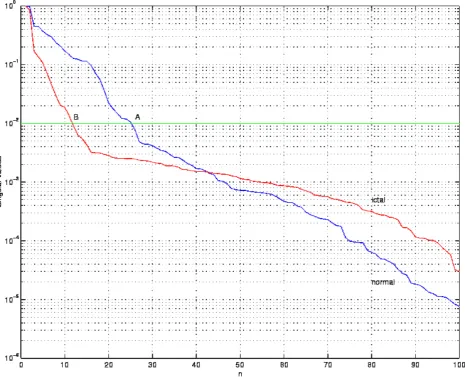
This method consists of computing the number of singular values of the covariance matrix of the time series that are bigger than a given threshold, and it is an estimation of the embedding dimension of the linearized dynamics[4]. We propose this magnitude as a detector given the claimed complexity reduction of the dynamics at seizures, that is, we expect to observe a decrease of its running values. In Figure 2 we show the spectrum of singular values for typical normal and ictal segments of brain activity, together with the threshold employed in all calculations (10-2). The geometrical interpretation of our measure is the first component of the intersection points of the threshold and spectrum curves, namely A and B for normal and ictal, respectively. We intend to take advantage of the faster exponential decay of the first singular values observable at seizures.
2.3. Integrated Information Flow (IIF)
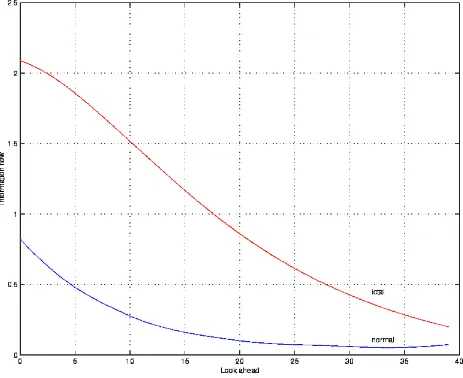
This is a non-linear measure of the statistical correlations between the past and a point p steps into the future, integrated over several look-aheads p [5,6]. It is related to the predictability horizon, and we expect this quantity to rise as the "decrease in complexity" of the dynamics develops. More precisely, we consider a look-ahead p and study the difference
p(xt+p, xt, xt-1,..., xt-n) -p(xt+p ) p(xt, xt-1,..., xt-n
which is an indication of the statistical independence between x ),
t+p and (xt, xt-1,..., xt-n). If this
quantity is zero, then the present is independent of the past and therefore unpredictable, meaning that the data are just uncorrelated noise. We further integrate this magnitude from the close to the medium-term future, that is, over all values of p ranging from 1 to a maximum value pmax [7]. The
Figure 2: Spectrum of singular values for typical normal and ictal segments of brain activity. Intersections with the threshold (10-2) are denoted by A and B, respectively.
2.4. Correlation Integral (CI)
A suggestive characterization of dynamical systems is the correlation dimension D2[8]. A number
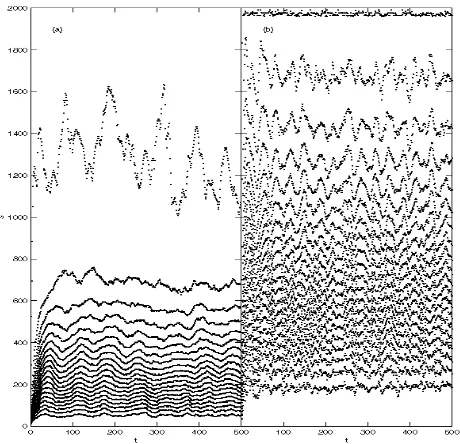
of groups have attempted an estimation for EEG signals, but the pitfalls and limitations of the mathematical and statistical techniques involved have led to doubts about the validity and reproducibility of these results. The fundamental problem is that EEG are not stationary over periods of sufficient length to permit reliable estimation of the quantities of interest. In view of this, it is the correlation integral C(s) that has received recent attention[9,10], interpreted as a measure of the average density (at a particular scale s) in phase space, accounting for the spatial distribution of delay vectors. The choice of s is to some extent arbitrary, and it is important to remark that the essential results are insensitive to the precise value of this parameter. No connection is made to low-dimensionality or even determinism; in fact, there is at present no convincing evidence for this property in EEG. Here again, in the spirit of the previous paragraphs, we want to give a hint of why this magnitude works as a detector. We choose normal and ictal segments and compute their space-time separation plots (STP), as introduced by Provenzale et al.[11]. They can be most briefly defined as contour plots of the probability of finding a pair of points whose spatial distance is smaller than s and temporal distance is exactly t, and are thus closely related to the definition of
respectively, where we can appraise the sudden change in the spatial distribution of delay vectors in phase space. It has been reported in [10] a successful pre-detection of 2.5 minutes beforehand (average over 17 cases) using this approach. We will not exactly reproduce their technique: we shall not perform data detrending and noise-reduction in view of the computational expenses involved, but shall work on the original recordings instead. Yet another difference that will prove of utmost importance is the following criterion to determine a priori the clinical seizure onset time: they defined it as the starting point of a slowly varying oscillation of 10 Hz.
Figure 3: Information Flow as a function of the Look-ahead.
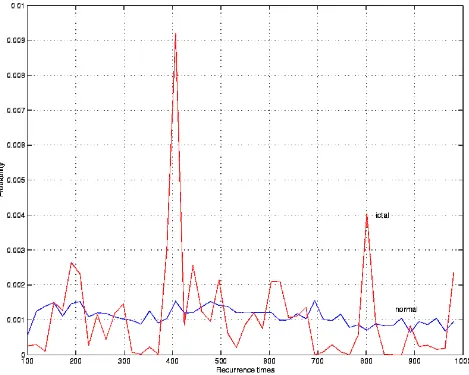
2.5. Recurrence times' entropy (RTE)
Figure 4: STP plots of typical normal (a) and ictal (b) segments of brain activity.
3. Results
3.1. Single-channel reconstruction
Intracranial #1: these are high quality, invasive and deep measurements. A detection syncronized to our clinical onset time is possible for all channels with all methods, though in this case the RCM method seems to have a small edge in detection time. The criterion of Martinerie et al.[10] would delay the clinical onset time ~1 sec. with respect to ours, thus becoming a small pre-detection. Intracranial #2: unlike the previous case, syncronized detection is clearly feasible only for certain appropriate channels. In this case RCM and IIF seem to be the fastest. The 10 Hz-criterion would delay our clinical onset time ~0.5 sec.
[image:7.595.65.534.263.638.2]Subdural: this is the first case where we can find a "route" to seizure of about 100 sec., mostly evident for SD, RCM and IIF. If onset were clinically chosen according to the 10 Hz-criterion, it would coincide with ours. Notably enough, 100 sec. is nearly the average pre-detection time reported in Martinerie et al.[10].
Figure 5: Example of the distribution of recurrence times for epileptic and normal segments.
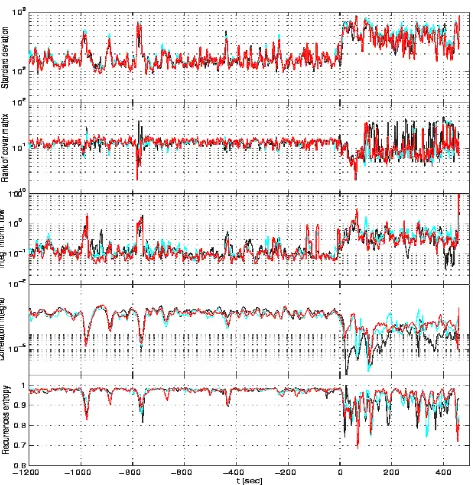
Scalp #1: in this case detection, if any, would be delayed with respect to our clinical onset. If it is detectable at all, it would only be the case for the running SD and CI methods. The signal is rich in artifacts.
onset by nearly 50 sec. if we used the 10 Hz-criterion, thus becoming an example of seizure prediction from scalp data.
Figure 6: Performance of the studied measures on a set of channels corresponding to one of the scalp data sets. Time is referred to the clinically determined seizure onset.
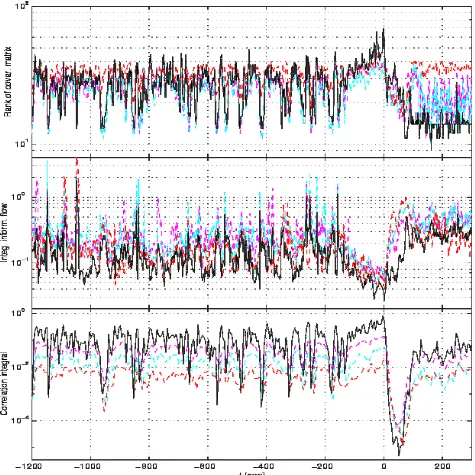
3.2. Multiple-channel reconstruction
Figure 7: Typical results of the multi-channel approach (solid lines). For comparison, we present the single-channel behavior of the combined electrodes (dashed lines).
4. Conclusions
We have found that the studied approaches successfully reflect the non-stationary character of ictal episodes, and seizure onsets were clearly accussed.
seizures with no delay (it could also be argued a small pre-detection time of about 0.5-1 sec.). We encountered one case of failure or doubtedly detection, the probable reason being the presence of artifacts in the noisy scalp recordings.
For the multi-channel approach, we found that it increased the sensibility of the methodologies considered, but not necesarily produced an earlier detection. This is in contrast with the results of [10], where the reported success is claimed to be essentially due to the multivariate character of the embedding.
Let us finally remark that this is a case study corresponding to one patient. We are currently performing extensive computations to test the validity of these results on approximately 15 patients and 60 seizures.
Appendix
Technical characteristics of the data sets
The recordings were made at the Department of Neurology of the University of Erlangen-Nuremberg by Prof. H. Stefan, Dr. R. Hopfengaertner, and collaborators. We analysed five seizures of one patient suffering from temporal lobe epilepsy. We worked on two intracranial EEG recordings (electrodes inserted deeply into the brain tissue), one data set corresponded to subdural electrodes/strips (intermediate depth), and two scalp data sets (superficial measurements). In each case, 32 channels were recorded with a sampling rate of 200 Hz and band-pass filtered 0.5-70 Hz. Intracranial are invasive measurements and in general of high quality, in contrast to scalp recordings usually presenting artifacts due to e.g. muscular activity.
References
1. Sander J.W. & Shorvon D. Incidence and prevalence of studies in epilepsy and methodological problems: A review. J. Neurol. Neurosurg.50, 829 (1987).
2. Takens F. Detecting strange attractors in turbulence, in Dynamical Systems and Turbulence, edited by D. A. Rand and L.-S. Young, Springer Lecture Notes in Mathematics 898, 366 Springer-Verlag New York (1980).
3. Whitney H. Differentiable Manifolds. Ann. Math.37, 645 (1936).
4. Broomhead D. S. & King G. P. Extracting qualitative dynamics from experimental data. Physica D20, 217 (1986).
5. Dubé L. J., Beaulieu F. & Deco G. A Novel Measure of Non-Stationarity in Dynamical Systems, in Fifth SIAM Conference on Applications of Dynamical Systems, Snowbird, Utah, USA (1999).
6. Deco G. & Schürmann B. Information Dynamics: Foundations and Applications, Springer Verlag New York (2000).
of publication: May 5 1999, under the title "Arrangement for predicting an abnormality of a system and for carrying out an action which counteracts the abnormality".
8. Grassberger P. & Procaccia I. Characterization of strange attractors. Phys. Rev. Lett. 50, 346 (1983).
9. Lerner D. E. Monitoring changing dynamics with correlation integrals: Case study of an epileptic seizure. Physica D97, 563 (1996).
10.Martinerie J., Adam C., Le Van Quyen M., Baulac M., Clemenceau S., Renault B. & Varela F. J. Epileptic seizures can be anticipated by non-linear analysis. Nature Medicine4, 1173 (1998). 11.Provenzale A., Smith L. A., Vio R. & Murante G. Distinguishing between low-dimensional
dynamics and randomness in measured time series. Physica D58, 31 (1992).
12.Deco G. & Obradovic D. An Information-Theoretic Approach to Neural Computing, Springer-Verlag New York (1996).
13.Eckmann J. P., Oliffson Kamphorst S. & Ruelle D. Recurrence plots of dynamical systems.
Europhys. Lett.4, 973 (1987).
14.Ortega G. J. A new method to detect hidden frequencies in chaotic time series. Physics Letters A