ALBI and PALBI Grades
Are Associated with the Outcome of
Patients with Stable Decompensated Cirrhosis
Theodora Oikonomou,* Ioannis Goulis,* Petros Doumtsis,* Theodora Tzoumari,* Evangelos Akriviadis,* Evangelos Cholongitas*,**
* Fourth Department of Internal Medicine, Medical School of Aristotle University, Thessaloniki, Greece. ** First Department of Internal Medicine, Medical School of National & Kapodistrian University, Athens, Greece.
January-February, Vol. 18 No. 1, 2019: 126-136
The Official Journal of the Mexican Association of Hepatology, the Latin-American Association for Study of the Liver and
the Canadian Association for the Study of the Liver
Manuscript received: Manuscript received: Manuscript received: Manuscript received:
Manuscript received: September 30, 2017. Manuscript accepted:Manuscript accepted:Manuscript accepted:Manuscript accepted:Manuscript accepted: January 29, 2018.
DOI:10.5604/01.3001.0012.7904 A B S T R A C T A B S T R A C T A B S T R A C T A B S T R A C T A B S T R A C T
Introduction and aim. Introduction and aim.Introduction and aim. Introduction and aim.
Introduction and aim. Studies carried out mainly in patients with hepatocellular carcinoma (HCC), have shown the prognostic significance of albumin-bilirubin (ALBI) grade. Recently, another predictive score incorporating platelet count into ALBI, PALBI grade, was introduced in patients with HCC. Aim.Aim.Aim.Aim.Aim. We evaluated the ability of ALBI and PALBI grades in predicting the outcome (mortality / liver transplantation) of patients with stable decompensated cirrhosis with various etiology of liver diseases. MaterialMaterialMaterialMaterialMaterial and methods.
and methods. and methods. and methods.
and methods. We prospectively studied 325 patients with stable decompensated cirrhosis awaiting liver transplantation. Their clinical and laboratory characteristics were recorded including albumin, bilirubin levels, platelets. We estimated ALBI and PALBI grades for every patient. Conventional prognostic scores were also evaluated; Child-Pugh (CTP), Model for End stage Liver Disease (MELD). We followed them up and recorded their outcome. Results.Results.Results.Results. Beyond MELD and CTP, ALBI and PALBI grades proved sig-Results. nificant factors associated with the outcome (HR: 2.13, 95%CI [1.59, 2.85], p < 0.001 and HR: 2.06, 95%CI [1.47, 2.9], p < 0.001, respectively), and their predictive capability was established (ROC analysis; AUC: 0.695, 95% CI [0.634, 0.755] and AUC: 0.683, 95% CI [0.621, 0.744], respectively). ALBI and PALBI performed better than CTP score (p = 0.0044 and p = 0.014, respectively). Categorization of our patients into three ALBI groups detected statistically different survival times. Accordingly, PALBI grade 3 com-pared to those with PALBI grade 1 and 2 patients, had worse outcome and significantly higher frequency of cirrhosis-related compli-cations. Conclusions. Conclusions. Conclusions. Conclusions. Conclusions. ALBI and PALBI grades were validated and can be used to predict the outcome in patients with stable decompensated cirrhosis.
Key words. Key words. Key words. Key words.
Key words. Decompensated cirrhosis. Prognosis. Survival. ALBI grade. PALBI grade.
INTRODUCTION
Decompensated cirrhosis is characterized by the pres-ence of striking and life-threatening complications and mortality without transplantation is as high as 85% over 5
years.1 Many studies have attempted to develop a
classifi-cation system that can both characterize the degree of liver injury and predict the prognosis of patients with cirrhosis
on the basis of clinical and laboratory variables.1 The
Child-Pugh (CTP) classification is the model most wide-ly used to determine prognosis in patients with liver dis-ease and is based on serum albumin, serum bilirubin,
prothrombin time, ascites, and encephalopathy.2 CTP
score is widely used as a simple descriptive or prognostic
indicator.3 The Model for End-Stage Liver Disease
(MELD), is based on serum creatinine, serum bilirubin and INR and is generalizable to patient populations of di-verse etiologies and wide ranges of severity of liver
dis-ease.2 MELD score predicts intermediate term
(12-month) mortality with good sensitivity and specificity
characteristics.4,5 More recently, MELD-Sodium score
(MELDNa) score has been suggested to provide signifi-cantly better prediction of mortality among registrants on the waiting list for liver transplantation (LT).6,7
Undoubt-edly, there is always the need to use ease, objective and ef-fective predictive markers for our patients’ prognosis.
albu-min-bilirubin (ALBI) grade, is a simple score derived from an easily accessible and noninvasive blood test with-out using those factors evaluated subjectively (such as as-cites and encephalopathy) or obtained by invasive
procedures.8 Moreover, another prognostic score has been
suggested to stratify HCC patients’ survival after curative therapies (resection/ablation), even more precisely than CTP classification. PALBI model was built by incorporat-ing platelet count into previously described ALBI grade and is proposed to be objective measurement of liver function reserve that can adequately stratify patient’s
sur-vival with HCC.9
ALBI grade has been also evaluated as a prognostic factor estimating the clinical outcome of patients with primary biliary cholangitis (PBC) and provides better/similar prog-nostic performance compared with other well established prognostic scores like CTP score, MELD score and Mayo
risk score.10 ALBI grade was effective in predicting the
long- term prognosis for patients with HBV-related cirrho-sis (compensated and decompensated), too, and even more
accurate than CTP and MELD scores.11 In a more recent
study, published as an abstract form, ALBI has been used to evaluate liver function in patients with decompensated cir-rhosis receiving direct acting antiviral (DAA) therapy, prov-ing that ALBI grade is a good indicator of likelihood of death and clinically significant deterioration after DAA therapy.12 Thus, the utility of this prognostic score could be
generalized in patients with decompensated cirrhosis irre-spectively of etiology of underlying liver disease. On the other hand, PALBI grade, has been validated in patients with
chronic liver disease and HCC,9 and recently has been used
as a predictor of mortality in patients with cirrhosis related
complications.13 Though, it has not been evaluated in
pa-tients with stable decompensated cirrhosis. Platelet count is considered a definite diagnostic marker for detecting
cir-rhosis.14 Inductively, it seems reasonable that PALBI grade
could as well been applied in patients with stable decom-pensated cirrhosis.
In general, the above-mentioned prognostic scores, ALBI and PALBI, have not been reclaimed in the same co-hort of patients with decompensated cirrhosis. We there-fore conducted our study in order to evaluate the prognostic significance of ALBI and PALBI grades and their ability to estimate the outcome of patients with sta-ble decompensated cirrhosis.
MATERIAL AND METHODS
Study characteristics
We conducted a prospective single-center study and evaluated patients with stable decompensated cirrhosis presented to our Department between 2010 and 2017.
Di-agnosis of cirrhosis was based on imaging techniques to-gether with clinical features such as ascites, thrombocyto-penia or gastro-oesophageal varices. Decompensated cirrhosis was defined as a history of ascites, variceal bleed-ing, encephalopathy or non-obstructive jaundice in pa-tients with known cirrhosis. All included papa-tients had been admitted for pre-liver transplantation (LT) evalua-tion and waiting list registraevalua-tion. Patients were stable re-garding their chronic liver disease: i.e. they had no active variceal bleeding, encephalopathy or infection, such as spontaneous bacterial peritonitis (SBP), during the last month before admission. Detailed clinical evaluation, lab-oratory measurements (white blood cells, C-reactive pro-tein, procalcitonin, blood cultures and ascitic fluid paracentesis) and radiological exams (chest x-ray, upper abdominal ultrasound), whenever necessary, were per-formed in order to exclude patients with clinical or sub-clinical infection.
On admission, for every patient we recorded demo-graphic and clinical characteristics: age; sex; cause and du-ration of liver disease; previous complications of cirrhosis (i.e. variceal bleeding, encephalopathy or SBP); medica-tion administered for the liver disease (duramedica-tion and dos-age); and vital signs (blood pressure, pulse rate). On admission to our Department, we also evaluated laborato-ry variables including albumin, protein, bilirubin (total and direct), clotting profile, creatinine, electrolytes [e.g. sodium (Na) and potassium (K)], aminotransferases
(as-partate and alanine), alkaline phosphatase, γ-glutamyl
transpeptidase and lactate dehydrogenase. Afterwards, we
estimated MELD score2 and CTP score,15 in order to
eval-uate the severity of liver disease. Using the literature
pro-posed equation we calculated ALBI grade [(log10 bilirubin
x 0.66) + (albumin x [-0.085]), where bilirubin is in μmol/L
and albumin in g/L].8 Accordingly, PALBI grade was
calculated as the following equation:
2.02 x log10 bilirubin - 0.37 x (log10 bilirubin)2 - 0.04 x
albumin - 3.48 x log10 platelets + 1.01 x (log10 platelets)2,
bilirubin was expressed in μmol/L, albumin in g/L and
blood platelet count in 1000/μL.9
cham-bers was indicative of intracardiac shunt.16 The renal
func-tion (“true” glomerular filtrafunc-tion rate, GFR) was assessed
in all patients using 51Chromium-EDTA (51Chr-EDTA)17
along with estimated GFR (eGFR) using the creatinine-based 4 variables Modification of the Diet in Renal
Dis-ease (MDRD) formula.18
We followed our included patients prospectively and analyzed their clinical and laboratory features. Primarily, we evaluated their outcome and its correlation with ALBI and PALBI grade. Survival was measured from the date of stratification to date of death or LT, or last follow-up.
The study protocol was approved by our Institutional Review Board and conformed to the ethical guidelines of the 1975 Declaration of Helsinki.
Statistical analysis
Continuous variables were presented as mean ± stand-ard deviation (normally distributed) or median with inter-quartile range (non-normally distributed). Categorical variables were expressed as frequencies or percentages. Comparisons of parameters between patients were per-formed using Student’s t or Mann-Whitney U tests, as
ap-propriate, for continuous variables and χ2 test for
categorical variables. Multivariable Cox’s proportional hazard model was carried out to identify independent fac-tors associated with the outcome (death or LT) through time and cumulative overall survival (OS) was calculated to estimate the hazard ratios. Factors with p < 0.05 in the univariate cox regression analysis were entered into the multivariable model. Survival rates were estimated by the Kaplan-Meier method and the differences were com-pared using the log-rank test. The discriminative ability of prognostic scores (including ALBI and PALBI) to predict the outcome of patients with decompensated cirrhosis was evaluated by using the area under the receiver operating characteristic curve (ROC). This has the true-positive and false-positive rates on the vertical and horizontal axes, re-spectively. As the AUC approaches 1.0, the model ap-proaches 100% sensitivity and specificity.19 P value < 0.05
was considered statistically significant. Statistical analysis was conducted by SPSS (version 23.0 IBM) and compari-son of ROC curves was performed with the MedCalc sta-tistical software.
RESULTS
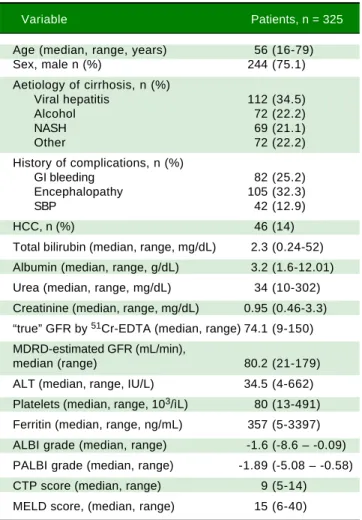
We evaluated prospectively 325 patients [244 males, age 56 (16-79) years]. Their baseline characteristics are shown in table 1. One hundred and sixty four patients (50.3%) had a previous history of cirrhosis related complications (i.e. gastrointestinal bleeding, hepatic encephalopathy or SBP).
Evaluation of kidney function using 51Chr-EDTA showed
median “true”-GFR at 74.1 mL/min (range: 9-150), while MDRD 80.2 ml/min (range: 21-179). Fifty seven patients (41.6%) out of 137 examined, had HPS. The median values of MELD and CTP scores were 15 (range: 6-40) and 9 (range: 5-14), respectively. ALBI grade median value was calculated -1.6 (range: -8.6 – -0.09) and PALBI grade had a median value of -1.89 (range: -5.08 – -0.58). During the follow up period (16.9 [range: 1-84] months) we evaluated their outcome (survival or death/LT). The median follow up period was 17 months (range: 1-84) for those who sur-vived (n = 135 patients), while the patients who died or underwent LT (n = 190, 58.5%) were followed up for a median time of 10 months (range: 1-52) until this clinical outcome (p < 0.001).
Characteristics of patients who survived or died/underwent LT
During the follow up period [16.9 (range: 1-84) months], 135 patients were alive (41.5%, group 1) and 190 patients died (n = 85) or underwent LT (n = 105) (58.5%,
Table 1. Baseline clinical and laboratory characteristics of 325 patients with stable decompensated cirrhosis.
Variable Patients, n = 325
Age (median, range, years) 56 (16-79) Sex, male n (%) 244 (75.1) Aetiology of cirrhosis, n (%)
Viral hepatitis 112 (34.5) Alcohol 72 (22.2) NASH 69 (21.1) Other 72 (22.2) History of complications, n (%)
GI bleeding 82 (25.2) Encephalopathy 105 (32.3) SBP 42 (12.9) HCC, n (%) 46 (14) Total bilirubin (median, range, mg/dL) 2.3 (0.24-52) Albumin (median, range, g/dL) 3.2 (1.6-12.01) Urea (median, range, mg/dL) 34 (10-302) Creatinine (median, range, mg/dL) 0.95 (0.46-3.3) “true” GFR by 51Cr-EDTA (median, range) 74.1 (9-150)
MDRD-estimated GFR (mL/min),
median (range) 80.2 (21-179) ALT (median, range, IU/L) 34.5 (4-662) Platelets (median, range, 103/ìL) 80 (13-491)
group 2). Group 1, compared to group 2 patients, had
sig-nificantly lower bilirubin [1.58 (range: 0.24-52) vs. 2.9
(range: 0.30-35) mg/dL, p < 0.001], INR [1.3 (range:
0.93-2.47) vs. 1.4 (range: 0.94-5.94), p < 0.001], urea [30.5
(range: 10-106) vs. 37.5 (range: 11-302) mg/dL, p < 0.001], creatinine [0.89 (range: 0.53-2.02) vs. 0.99 (range: 0.46-3.30)
mg/dL, p = 0.002], ALT [28 (range: 10-250) vs. 37 (range:
4-662) IU/L, p=0.002], ALBI grade [-1.9 (range: -4.9–
-0.36) vs. -1.42 (range: -8.6– -0.09), p < 0.001], PALBI
grade [-2.1 (range: -3.5 – -0.77) vs. -1.76 (range: -5.08 –
-0.58), p < 0.001], CTP (8 ± 2 vs. 9 ± 2, p < 0.001) and MELD score [12 (range: 6-27) vs. 16 (range: 7-40), p < 0.001]. In addition, group 1 had significantly higher albumin [3.4 (range: 1.6-7) vs. 3.1 (range: 1.6-12) g/dL, p < 0.001],
GFR [75 (range: 9-131) vs. 74 (range: 16-150) mL/min,
p < 0.001] and platelet count [88 (range: 19-491) vs. 74
(range: 13-309) 103/μL, 0.03] compared to group 2 (Table 2).
Factors associated with the outcome: univariate and multivariate analysis
Univariate cox regression analysis showed that age (HR: 1.01, 95%CI [1.001, 1.03], p = 0.04), urea (HR: 1.006, 95%CI [1.003, 1.008], p < 0.001), creatinine (HR: 1.73, 95%CI [1.26, 2.38], p = 0.001), INR (HR: 1.8, 95%CI [1.43, 2.27], p < 0.001), ALT (HR: 1.004, 95%CI [1.002,
1.006], p < 0.001) and serum ferritin (HR: 1.001, 95%CI [1.00, 1.001], p < 0.001) were statistically significant factors associated with our patients’ outcome (Table 3). Serum albumin levels (HR: 0.73, 95%CI [0.58, 0.92], p = 0.008) and “true” GFR (HR: 0.99, 95%CI [0.98, 0.99], p = 0.008) were protective factors against death/LT, while total bilirubin levels represented significant risk factor which burdens patients’ prognosis (HR: 1.02, 95%CI [1.01, 1.04], p = 0.002). MELD and CTP scores showed impor-tant prognostic role (HR: 1.09, 95%CI [1.06, 1.12], p < 0.001 and HR: 1.21, 95%CI [1.12, 1.31], p < 0.001, respectively). ALBI and PALBI grades had also significant association with our patients’ outcome. More specifically,
using the proposed cut off points for ALBI grade,8 we
cat-egorized our patients into three groups: ALBI grade 1
(score ≤ -2.60) (n = 30); ALBI grade 2 (more than -2.60
to ≤ -1.39) (n = 175); and ALBI grade 3 (> -1.39) (n = 120). According to the univariate cox regression analysis patients categorized as ALBI grade 3 presented significant-ly high risk of death/LT compared to ALBI grade 1 and 2 (HR: 2.13, 95%CI [1.59, 2.85], p < 0.001). Similarly, there were three groups of patients based on the proposed cut
off points of PALBI grade:9 PALBI grade 1 (score ≤ -2.53)
(n = 41); PALBI grade 2 (more than -2.53 to ≤ -2.09)
(n = 85); and PALBI grade 3 (> -2.09) (n = 199). Patients on PALBI grade 3 had almost twice the risk of death/LT
Table 2.Clinical and laboratory characteristics of patients who survived (group 1) or died/underwent liver transplantation (group 2).
Variables Group 1 (n = 135, 41.5%) Group 2 (n = 190, 58.5%) P value
Sex, male (n, %) 99 (40.6) 145 (59.4) 0.54 Age (years) 55 (26-73) 56 (16-79) 0.08 History of complications (n, %) 43 (32) 62 (32.6) 0.909
Encephalopathy 40 (29.6) 42 (22.1) 0.124 GI bleeding 17 (12.6) 25 (13.1) 0.89 Spontaneous bacterial peritonitis
Albumin (median, range, g/dL) 3.4 (1.6-7) 3.1 (1.6-12) < 0.001 Bilirubin (median, range, mg/dL) 1.58 (0.24-52) 2.9 (0.30-35) < 0.001 INR (median, range) 1.3 (0.93-2.47) 1.4 (0.94-5.94) < 0.001 Urea (median, range, mg/dL) 30.5 (10-106) 37.5 (11-302) < 0.001 Creatinine (median, range, mg/dL) 0.89 (0.53-2.02) 0.99 (0.46-3.30) 0.002 Glomerular filtration rate (GFR), (median, range, mL/min) 75 (9-131) 74 (16-150) < 0.001 ALT (median, range, IU/L) 28 (10-250) 37 (4-662) 0.002 Platelets (median, range, 103/μL) 88 (19-491) 74 (13-309) 0.03
Table 3. Clinical and laboratory characteristics of 325 patients with stable decompensated cirrhosis associated with the outcome (univariate analysis).
Variables 95% CI 95% CI
Hazard ratio p value Lower Upper
Sex (n, %) 0.86 0.41 0.62 1.21
Age (years) 1.01 0.04 1.001 1.03
History of complications (n, %)
Encephalopathy 1.08 0.61 0.79 1.47
GI bleeding 0.83 0.28 0.58 1.17
Spontaneous bacterial peritonitis 1.18 0.42 0.77 1.81 Albumin (median, range, g/dL) 0.73 0.008 0.58 0.92 Bilirubin (median, range, mg/dL) 1.02 0.002 1.01 1.04 INR (median, range) 1.8 < 0.001 1.43 2.27 Urea (median, range, mg/dL) 1.006 < 0.001 1.003 1.008 Creatinine (median, range, mg/dL) 1.73 0.001 1.26 2.38 Glomerular filtration rate (GFR), (median, range, mL/min) 0.99 0.008 0.98 0.99 ALT (median, range, IU/L) 1.004 < 0.001 1.002 1.006 Platelets (median, range, 103/μL) 0.99 0.08 0.99 1
Ferritin (mean ± SD, ng/mL) 1.001 < 0.001 1 1.001 ALBI grade (3 vs. 1 and 2) 2.13 < 0.001 1.59 2.85 PALBI grade (3 vs. 1 and 2 2.06 < 0.001 1.47 2.9 CTP score (mean ± SD) 1.21 < 0.001 1.12 1.31 MELD score (median, range) 1.09 < 0.001 1.06 1.12
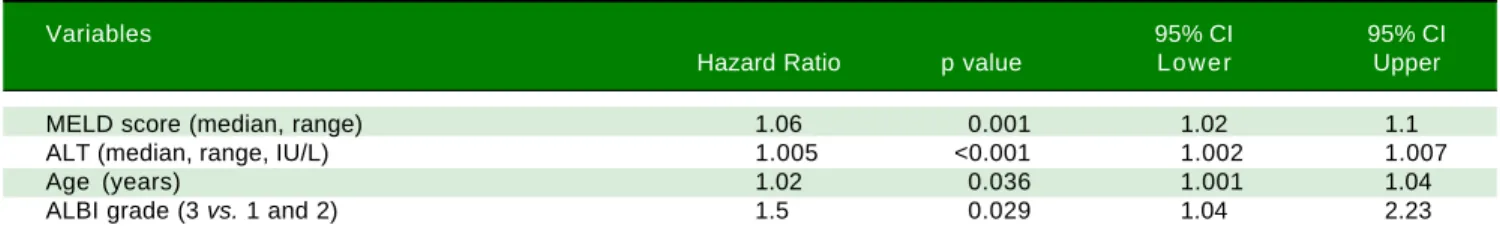
vs. PALBI 1 and 2 (HR: 2.06, 95%CI [1.47-2.9], p < 0.001). Multivariate Cox regression analysis showed that MELD score (HR: 1.06, 95%CI [1.02-1.1], p = 0.001), ALT (HR: 1.005, 95% CI [1.002-1.007], p < 0.001), age (HR: 1.02, 95%CI [1.001-1.04], P = 0.036) and ALBI grade (3 vs. 1 and 2) (HR: 1.5, 95%CI [1.04-2.23], p = 0.029) were inde-pendently associated with death/LT (Table 4).
Impact of ALBI and PALBI on survival
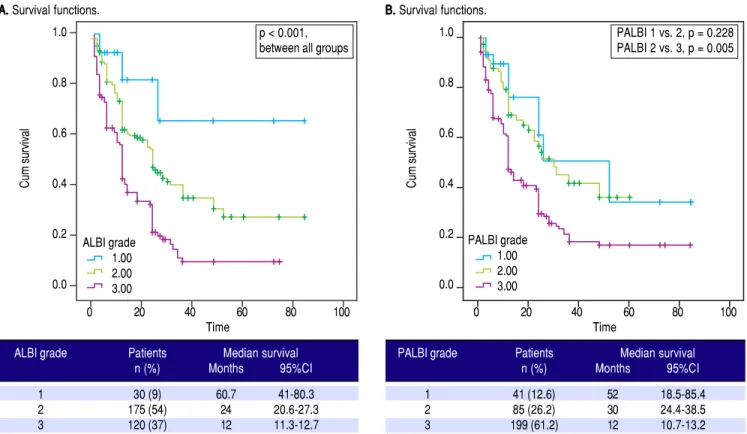
We applied survival analysis using the proposed cut off points for ALBI grade. The Kaplan-Meier curves detected statistically significant different survival between the three groups (Figure 1A). Specifically, ALBI grade 1 had a clear-ly superior median survival at 60.7 months (41-80.3)
com-pared to ALBI grade 2 [24 (20.6-27.3)] and ALBI grade 3 [12 (11.3-12.7)], p < 0.001. Then, we divided our cohort in two groups. those with ALBI grade 1 (n = 30, 9.3%) and those with ALBI grade 2 and 3 (n = 295, 90.7%), based on their different survival. The two groups were significantly
different regarding MELD [10 (range: 6-15) vs. 15 (6-40),
p < 0.001] and CTP score [7 (range: 5-10) vs. 9 (range:
5-14), p < 0.001].
As for PALBI, according to the survival analysis, pa-tients with PALBI grade 1 and 2 did not differ significantly (p = 0.228), though PALBI grade 2 had significantly dif-ferent median survival time against PALBI grade 3 [30
(21.4-38.5) vs. 12 (10.7-13.2) months, p = 0.005] (Figure
1B). Then, we divided our cohort in two groups. those with PALBI grade 1 and 2 (n = 126, 38.8%) and those with
Table 4. Multivariate analysis to identify the independent factors associated with the outcome in 325 patients with stable decompen-sated cirrhosis.
Variables 95% CI 95% CI
Hazard Ratio p value Lower Upper
p < 0.001 p < 0.001
Figure 1. Figure 1.Figure 1.
Figure 1.Figure 1. Performance of the ALBI and PALBI grade in patients with stable decompensated cirrhosis. Kaplan-Meier curves illustrate survival according to ALBI (AAAAA) (log-rank, p < 0.001 between all grades) and PALBI grades (BBBBB) (p = 0.228 between PALBI grade 1 and 2, p = 0.005 between PALBI grade 2 and 3).
Figure 2. Figure 2.Figure 2.
Figure 2.Figure 2. Kaplan-Meier curves with a cut-off point (AAAAA) the median value of ALBI (log-rank, p < 0.001), (BBBBB) the median value of PALBI (log-rank, p < 0.001).
0 20 40 60 80 100
Time
Cum survival
1.0
0.8
0.6
0.4
0.2
0.0 A
AA
AA. . . Survival functions.
p < 0.001, between all groups
0 20 40 60 80 100
Time
Cum survival
1.0
0.8
0.6
0.4
0.2
0.0 B.
B. B. B.
B. Survival functions.
PALBI 1 vs. 2, p = 0.228 PALBI 2 vs. 3, p = 0.005
ALBI grade 1.00 2.00 3.00
PALBI grade 1.00 2.00 3.00
ALBI grade Patients Median survival
n (%) Months 95%CI
1 30 (9) 60.7 41-80.3
2 175 (54) 24 20.6-27.3
3 120 (37) 12 11.3-12.7
PALBI grade Patients Median survival
n (%) Months 95%CI
1 41 (12.6) 52 18.5-85.4
2 85 (26.2) 30 24.4-38.5
3 199 (61.2) 12 10.7-13.2
0 20 40 60 80 100
Time
Cum survival
1.0
0.8
0.6
0.4
0.2
0.0 A
AA
AA. . . Survival functions.
0 20 40 60 80 100
Time
Cum survival
1.0
0.8
0.6
0.4
0.2
0.0 B.
B. B. B.
B. Survival functions.
ALBI grade Median survival
n, months 95%CI
≤ -1.6 31 21.4-40.6
> -1.6 12 11.4-12.6
PALBI grade Median survival
Months 95%CI
≤ -1.89 28 21.6-34.3
> -1.89 12 11.4-12.6
ALBI grade
≤ 1.6 > -1.6 0.00-censored 1.00-censored
PALBI grade
PALBI grade 3 (n = 199, 61.2%). The two groups had
sig-nificant variation regarding MELD [11 (range: 6-20) vs. 15
(7-40), p < 0.001] and CTP score [8 (range: 5-12) vs. 9
(range: 5-14), p < 0.001]. Interestingly, the group of pa-tients with PALBI grade 3, compared to those with PALBI grade 1 and 2, had significantly higher frequency of
cirrho-sis-related complications (encephalopathy: 17.5% vs.
39.7%, p < 0.001 and SBP: 4.8% vs. 17%, p = 0.004). Finally, we divided our patients in two groups using as cut-off points the median values of ALBI and PALBI grades. Patients with ALBI grade lower than the median value of ALBI, i.e. in our cohort -1.6, presented signifi-cantly higher time of survival against those with ALBI grade higher than -1.6; [31 (21.4-40.6) vs. 12 (11.4-12.6), p < 0.001]. Regarding PALBI grade, the results showed the same significance using as cut-off point the median value
of PALBI in our cohort, i.e. -1.89; [28 (21.6-34.3) vs. 12
(11.4-12.6)] (Figure 2).
Discriminative ability of prognostic scores based on ROC curves
The discriminatory capabilities of ALBI grade, PALBI grade, MELD score and CTP score, were tested using ROC curves. Based on the area under the curve, ALBI grade had very good discriminative ability to predict the outcome (death or LT) (AUC: 0.695, 95% CI [0.634, 0.755). It was not statistically different than MELD score (AUC: 0.722, 95%CI [0.664, 0.780]), p = 0.3255), though it came superior to CTP score (AUC: 0.611, 95%CI [0.546, 0.675]), p = 0.0044). The performance of PALBI grade (AUC: 0.683, 95% CI [0.621, 0.744]) (Figure 3A) came equally important against ALBI (p = 0.4737) and MELD score (p = 0.1542). Though it was significantly better than CTP score (p = 0.0140). Accordingly, we excluded pa-tients with HCC and estimated the discriminative abili-ties of ALBI and PALBI (AUC: 0.729, 95% CI [0.665, 0.794] and AUC: 0.714, 95%CI [0.647, 0.780], p = 0.4081). These were superior to that of CTP (AUC: 0.621, 95%CI [0.549, 0.693], p = 0.0007 and p = 0.0052, respectively) and similar to that of MELD (AUC: 0.745, 95%CI [0.682, 0.808], p = 0.6081 and p = 0.3014, respectively) (Figure 3B). Conducting further analysis we found that MELD score had the best discriminative ability (AUC: 0.826, 95%CI [0.726, 0.925]) in patients with NASH (n = 72, 22.2%) against PALBI grade (AUC: 0.674, 95%CI [0.539, 0.809], p = 0.02), and similar to that of ALBI and CTP (AUC: 0.746, 95%CI [0.626, 0.866], p = 0.1476 and AUC: 0.720, 95%CI [0.593, 0.847], p = 0.0626, respectively) (Fig-ure 3C). In patients with alcoholic decompensated cir-rhosis (n = 69, 21.1%) ROC analysis gave similar predictive capabilities for all scores, i.e. MELD (AUC: 0.702, 95%CI [0.570, 0.833], PALBI (AUC: 0.686, 95%CI
[0.558, 0.814]), ALBI (AUC: 0.656, 95%CI [0.527, 0.786], and CTP (AUC: 0.608, 95%CI [0.473, 0.742]) (Figure 3D) (p values always > 0.05 for all comparisons). Finally for patients with viral hepatitis (n = 112, 34.5%), MELD had better performance (AUC: 0.706, 95%CI [0.606, 0.806]) than CTP (AUC: 0.589, 95%CI [0.472, 0.706], p = 0.026), and similar to that of PALBI (AUC: 0.694, 95%CI [0.591, 0.717], p = 0.1870) and ALBI (AUC: 0.670, 95%CI [0.563, 0.778], p = 0.4819). PALBI also performed better than CTP score (p = 0.0229) (Figure 3E).
Then we excluded patients who underwent LT (n = 105), and studied the predictive ability of scores in patients who survived (n = 135) against those who died (n = 85). MELD score had the best predictive ability (AUC: 0.791, 95%CI [0.724, 0.858], though it was neither significantly different than ALBI (AUC: 0.754, 95%CI [0.686, 0.823], p = 0.2825), nor than PALBI (AUC: 0.754, 95%CI [0.686, 0.823], p = 0.2506), but it was superior to CTP (AUC: 0.705, 95%CI [0.632, 0.778], p = 0.0014). ALBI and PALBI came similar (p = 0.9977) each other and against CTP (p = 0.1548 and p = 0.1506, respectively) (Figure 3F).
DISCUSSION
We evaluated 325 patients with stable decompensated cirrhosis to estimate predictive capability of ALBI and PALBI grades regarding our patients’ outcome (death or LT). Our data analysis managed to validate these objective scores, in a heterogeneous population of patients enlisted for LT. ALBI and PALBI grades proved significant pre-dictive factors regarding our patients’ outcome.
Cirrhosis is an increasing cause of morbidity and
mor-tality in more developed countries.20 Many studies have
at-tempted to develop a classification system that can both characterize the degree of liver injury and predict the prognosis of patients with cirrhosis on the basis of
objec-tive clinical and laboratory variables.1 MELD and CTP
scores are mainly used for the assessment of prognosis in cirrhosis. A recent meta- analysis reviewed data to evaluate the diagnostic accuracy of CTP and MELD scores in pa-tients with cirrhosis and outlined the need for developing new scores that assess more accurately the prognosis of pa-tients with liver disease.21
Accordingly, Johnson, et al.8 created a new score,
ALBI grade, using only two biochemical parameters, se-rum albumin and total bilirubin levels. The principal idea was to present a simple, discriminatory method for assessing liver function, primarily introduced in pa-tients with HCC. These papa-tients had associated chronic liver disease, either at the stage of cirrhosis, or at a range of liver pathology from mild abnormalities to
ad-vanced fibrosis.8 Later data confirmed the utility of
Source of the curve ALBI PALBI MELD CTP Reference line
ALBI, AUC: 0.746 PALBI, AUC: 0.674 MELD, AUC: 0.826 CTP, AUC: 0.720
Source of the curve ALBI PALBI MELD CTP Reference line
ALBI, AUC: 0.656 PALBI, AUC: 0.686 MELD, AUC: 0.702 CTP, AUC: 0.608
Source of the curve ALBI PALBI MELD CTP Reference line
ALBI, AUC: 0.670 PALBI, AUC: 0.694 MELD, AUC: 0.706 CTP, AUC: 0.589
Source of the curve ALBI PALBI MELD CTP Reference line
ALBI, AUC: 0.754 PALBI, AUC: 0.754 MELD, AUC: 0.791 CTP, AUC: 0.705
Source of the curve MELD CTP PALBI ALBI Reference line
MELD, AUC: 0.722 CTP, AUC: 0.611 PALBI, AUC: 0.683 ALBI, AUC: 0.695
Figure 3. Figure 3.Figure 3.
Figure 3.Figure 3. ROC curves for the discriminative ability of the prognostic scores ALBI, PALBI, MELD, CTP to detect our patients’ outcome. A.A.A.A.A. Whole cohort of decompensated patients (n = 325 patients). B.B.B. Exclusion of HCC patients. C.B.B. C.C. Patients with NASH. D.C.C. D.D.D.D. Patients with alcoholic cirrhosis. E.E.E.E.E. Patients with viral hepatitis. F.F.F.F.F. Exclusion of patients who underwent LT.
0.0 0.2 0.4 0.6 0.8 1.0
1-Specificity Sensitivity 1.0 0.8 0.6 0.4 0.2 0.0 A AA AA
0.0 0.2 0.4 0.6 0.8 1.0
1-Specificity Sensitivity 1.0 0.8 0.6 0.4 0.2 0.0 B BB B B
0.0 0.2 0.4 0.6 0.8 1.0
1-Specificity Sensitivity 1.0 0.8 0.6 0.4 0.2 0.0 C CC CC
0.0 0.2 0.4 0.6 0.8 1.0
1-Specificity Sensitivity 1.0 0.8 0.6 0.4 0.2 0.0 D DD D D
0.0 0.2 0.4 0.6 0.8 1.0
1-Specificity Sensitivity 1.0 0.8 0.6 0.4 0.2 0.0 D DD DD
0.0 0.2 0.4 0.6 0.8 1.0
1-Specificity Sensitivity 1.0 0.8 0.6 0.4 0.2 0.0 E EE E E
Source of the curve ALBI PALBI MELD CTP Reference line
HCC patients.22 In general, studies have validated this
newly introduced score in HCC patients, showing
good prognostic power22-25 and the ability to define
pa-tients’ management.26-29
Subsequently, studies validated ALBI grade in patients
with chronic liver diseases. Zou, et al. demonstrated that
ALBI had high predictive capability for in-hospital mor-tality in a retrospective study of cirrhotic patients with acute upper gastrointestinal bleeding. However, the AUC for predicting the in-hospital mortality was not
significantly different between the ALBI (AUC: 0.808) vs.
CTP (AUC: 0.785), p = 0.5831, or MELD score (AUC:
0.834), p = 0.7033.30 Moreover, a large cohort with 806
HBV patients with compensated and decompensated cir-rhosis, confirmed the predictive efficacy of ALBI (AUC: 0.787, 95% CI [0.830, 0.833]) and found that ALBI grade 1 patients had the highest survival probability within 40 months (p = 0.0002), while the survival time of ALBI grade 2 was significantly longer than that of grade 3 (p < 0.0001). Lately, in a study published as an abstract form, ALBI was assessed in 626 patients with hepatitis C-relat-ed decompensatC-relat-ed cirrhosis during their DAA therapy and was announced to be an independent risk factor for clinical deterioration and death (HR: 1.9, 95% CI [1.3, 2.8]).12 As for our study, it is the first one in which ALBI
grade was assessed prospectively in a large cohort of pa-tients with stable decompensated cirrhosis of various eti-ology. We confirmed the discriminative ability of ALBI (AUC: 0.695), which was better than CTP score (AUC: 0.611, p = 0.0044) and rather comparable to that of MELD score (AUC: 0.722, p = 0.3255), regarding the long-term outcome (death or LT) in the total cohort, as well as in subgroups of patients based on the etiology of underlying liver disease. The predictive ability of ALBI came even stronger when the patients with HCC (n = 46, 14%) were excluded from our analysis. In addition, ALBI was a significant risk factor for death/LT (HR: 2.13, 95%CI [1.59-2.85], p < 0.001). Patients with ALBI grade 1 had the longest survival (at 60.7 months) com-pared to patients with ALBI grade 2 and 3 (log-rank, p < 0.001 between all grades). Interestingly, the median value of ALBI grade, proved ideal cut-off point of significant difference of survival in our patients. Finally, in multi-variate analysis we found that ALBI was an independent risk factor associated with patients’ outcome; patients with ALBI grade 3 had almost 1.5 times greater hazard of death/LT compared to ALBI grade 1 and 2 (HR: 1.5, 95%CI [1.04-2.23], P = 0.029).
Regarding PALBI grade, this was introduced in 2015
by Sasan, et al.9 as a new model which incorporated
plate-let count into the previously described ALBI grade, in order to predict survival of patients with HCC undergo-ing curative therapies. PALBI grade was validated by Liu,
et al.31 and they found that it had good prognostic power
in differentiating survival (higher AUC values compared
with MELD, CTP, and ALBI grade, all p < 0.05).31
Recently, PALBI was assessed in a cohort of 1,638 patients presenting with acute cirrhosis-related compli-cation, specifically acute variceal bleeding. The results showed that PALBI had better discriminative ability for
early mortality than CTP score (AUC: 0.847 vs. 0.672,
p < 0.001).13 Accordingly, we examined prospectively,
for the first time together with ALBI grade, the above-mentioned utility of PALBI in our various cohort of 325 stable decompensated patients. We showed that PALBI was an important risk factor (HR: 2.06, 95%CI [1.47-2.9], p < 0.001) associated with our patients’ outcome. Indeed, PALBI’s discriminatory ability for long-term outcome (AUC: 0.683) came better than CTP score in our cohort too (AUC: 0.611, p = 0.014), and similar to MELD’s score (AUC: 0.722, p = 0.1542). Survival analy-sis showed significantly different median survival times when diving our patients based on the median value of PALBI grade, too. When we excluded patients with HCC, PALBI had stronger prognostic power (AUC: 0.714), better than CTP (AUC: 0.621, p = 0.0052) and similar to that of MELD score (AUC: 0.745, p = 0.3014). So, we confirmed the potential of PALBI grade to assess the outcome of stable patients with decompensated cir-rhosis. Moreover, in our cohort patients with PALBI grade 3 had more frequently a previous history of cirrho-sis related complications. Further studies are needed to elucidate the predictive performance of PALBI for de-velopment of cirrhosis-related complications.
In general, our prospective study is the first to estab-lish the utility of both ALBI and PALBI in the largest heterogeneous cohort of patients with stable decom-pensated cirrhosis with various etiology of underlying liver disease awaiting for LT and we were able to con-firm their predictive role. Ideally, this could allow us to classify our patients according to their ALBI or PAL-BI grade and manage them based on their expected clin-ical outcome.
etc. Besides, it might be useful to assess how ALBI and PALBI changes in the course of the disease and what this means. Further studies are needed to establish the predic-tive utility of PALBI grade regarding cirrhosis related complications. Finally, we acknowledge there are restric-tions as it is a single center study.
In conclusion, our study presented strong evidence that ALBI and PALBI grades are trustworthy in predict-ing stable decompensated cirrhosis patients’ outcome. Further research is needed to confirm our findings. Though their significance is established and clinical ap-pliance is feasible.
ABBREVIATIONS
• ALBI: albumin-bilirubin grade.
• AUC: area under the curve
• CTP: Child-Pugh.
• DAA therapy: direct acting antiviral therapy.
• HCC: hepatocellular carcinoma.
• LT: liver transplantation.
• MELD: Model for End stage Liver Disease. • MELDNa: MELD-sodium score.
• PALBI: platelet count-albumin-bilirubin grade.
• PBC: primary biliary cholangitis.
• ROC: receiver operating curve.
• SBP: spontaneous bacterial peritonitis.
GRANTS AND FINANCIAL SUPPORT
Nothing to disclose.
CONFLICTS OF INTEREST
The authors declares that there is no conflict of interest regarding the publication of this article.
AUTHOR’S CONTRIBUTIONS
Conception and design: Theodora Oikonomou, Evangelos Cholongitas.
Analysis and interpretation of the data: Theodora Oikonomou.
Drafting of the article: Theodora Oikonomou, Ioannis Goulis, Evangelos Cholongitas.
Critical revision of the article: Petros Doumtsis, Theo-dora Tzoumari, Evangelos Akriviadis.
Final approval: all the authors.
ACKNOWLEDGEMENTS
No external funding was received for this study.
REFERENCES
1. Schuppan D, Afdhal NH. Seminar Liver cirrhosis. Lancet
2008; 371: 838-51.
2. Kamath PS, Wiesner RH, Malinchoc M, Kremers W, Therneau TM, Kosberg CL, D’Amico G, et al. A model to predict survival in patients with end-stage liver disease. Hepatology 2001; 33: 464-70.
3. Durand F, Valla D. Assessment of the prognosis of cirrho-sis: Chil Pugh versus MELD. J Hepatol 2005; 42: 100-7. 4. Said A, Williams J, Holden J, Remington P, Gangnon R, Musat
A, Lucey MR. Model for end stage liver disease score pre-dicts mortality across a broad spectrum of liver disease. J Hepatol 2004; 40: 897-903.
5. Cholongitas E, Marelli L, Shusang V, Senzolo M, Rolles K, Patch D, Burroughs AK. A systematic review of the per-formance of the model for end-stage liver disease (MELD) in the setting of liver transplantation. Liver Transpl 2006; 12: 1049-61.
6. Kim WR, Biggins SW, Kremers WK, Wiesner RH, Kamath PS, Benson JT, Edwards E, et al. Hyponatremia and mortality among patients on the liver-transplant waiting list. N Engl J Med 2008; 359: 1018-26.
7. Vitale A, Bertacco A, Gambato M, D’Amico F, Morales RR, Frigo AC, Zanus G, et al. Model for end-stage liver disease-sodium and survival benefit in liver transplantation. Transpl Int 2013; 26: 138-44.
8. Johnson PJ, Berhane S, Kagebayashi C, Satomura S, Teng M, Reeves HL, O’Beirne J, et al. Assessment of liver function in patients with hepatocellular carcinoma: A new evidence-based approach - The ALBI grade. J Clin Oncol 2015; 33: 550-8.
9. Roayaie PS, Jibara G, Berhane S, Tabrizian P, Park JW, Yang J, Yan L, et al. PALBI-An Objective Score Based on Plate-lets, Albumin & Bilirubin Stratifies HCC Patients Undergoing Resection & Ablation Better than Child’s Classification. In AASLD LiverLearning®; 2015.
10. Chan AWH, Chan RCK, Wong GLH, Wong VWS, Choi PCL, Chan HLY, To KF. New simple prognostic score for primary biliary cirrhosis: Albumin-bilirubin score. J Gastroenterol Hepatol 2015; 30: 1391-6.
11. Chen RC, Cai YJ, Wu JM, Wang XD, Song M, Wang YQ, Zheng MH, et al. Usefulness of albumin-bilirubin grade for evaluation of long-term prognosis for hepatitis B-related cir-rhosis. J Viral Hepat 2017; 24: 238-45.
12. Walker AJ, Johnson PJ, Berhane S. Liver function as meas-ured by albumin-bilirubin score within decompensated pa-tients receiving direct acting antiviral therapy. In: The International Liver Congress 2017. Amsterdam, The Nether-lands 19-23 April; 2017.
13. Elshaarawy O, Samea EA, Gomaa A, Allam N, Saad M. Palbi-The Platelet-Albumin-Bilirubin score- A better predictor of outcome of Acute Variceal Bleeding. In: The International Liver Congress 2017. Amsterdam, The Netherlands 19-23 April; 2017.
14. Udell JA, Wang CS, Tinmouth J, FitzGerald JM, Najib TA, Simel DL, Schulzer M, et al. Does This Patient With Liver Dis-ease Have Cirrhosis? JAMA 2012; 307: 832-42.
15. Pugh RNH, Murray-Lyon IM, Dawson JL, Pietroni MC, Wil-liams R. Transection Of The Oesophagus For Bleeding Oesophageal Varices. Brit J Surg 1973; 60: 1971-4. 16. Soulaidopoulos S, Goulis I, Giannakoulas G, Panagiotidis T,
Doumtsis P, Karasmani A, Oikonomou T, et al. Hepatopulmo-nary syndrome is associated with the presence of hepato-cellular carcinoma in patients with decompensated cirrhosis.
17. Fleming JS, Nunan TO, Society BNM. The new BNMS guide-lines for measurement of glomerular filtration rate. Nucl Med Commun 2004; 25: 755-7.
18. Levey AS, Bosch JP, Lewis JB, Greene T, Rogers N, Roth D. A more accurate method to estimate glomerular filtration rate from serum creatinine: a new prediction equation. Modi-fication of Diet in Renal Disease Study Group. Ann Intern Med 1999; 130: 461-70.
19. Hanley JA, McNeil BJ. A method of comparing the areas un-der receiver operating characteristic curves un-derived from the same cases. Radiology 1983; 148: 839-43.
20. Tsochatzis EA, Bosch J, Burroughs AK. Liver cirrhosis. Lan-cet 2014; 383: 1749-61.
21. Peng Y, Qi X, Guo X. Child–Pugh Versus MELD Score for the Assessment of Prognosis in Liver Cirrhosis. Medicine (Bal-timore) 2016; 95: 1-29.
22. Chan AWH, Kumada T, Toyoda H, Tada T, Chong CCN, Mo FKF, Yeo W, et al. Integration of albumin-bilirubin (ALBI) score into Barcelona Clinic Liver Cancer (BCLC) system for hepatocellular carcinoma. J Gastroenterol Hepatol 2016; 31: 1300-6.
23. Chan AWH, Chong CCN, Mo FKF, Wong J, Yeo W, Johnson PJ, Yu S, et al. Incorporating Albumin-Bilirubin grade into the Cancer of the Liver Italian Program system for hepatocellular carcinoma. J Gastroenterol Hepatol 2016; 32: 221-8. 24. Hiraoka A, Kumada T, Michitaka K, Toyoda H, Tada T, Ueki H,
Kaneto M, et al. Usefulness of albumin-bilirubin grade for evaluation of prognosis of 2584 Japanese patients with hepatocellular carcinoma. J Gastroenterol Hepatol 2016; 31: 1031-6.
25. Li MX, Zhao H, Bi XY, Li ZY, Huang Z, Han Y, Zhou JG, et al. Prognostic value of the albumin-bilirubin grade in patients with hepatocellular carcinoma: Validation in a Chinese co-hort. Hepatol Res 2017; 47: 731-41.
26. Kuo YH, Wang JH, Hung CH, Rau KM, Wu IP, Chen CH, Knee KM, et al. The ALBI grade predicts the prognosis of patients
with advanced hepatocellular carcinoma received sorafenib.
J Gastroenterol Hepatol 2017; 11 [Epub ahead of print]. 27. Ogasawara S, Chiba T, Ooka Y, Suzuki E, Kanogawa N,
Sai-to T, MoSai-toyama T, et al. Liver function assessment according to the Albumin-Bilirubin (ALBI) grade in sorafenib-treated pa-tients with advanced hepatocellular carcinoma. Invest New Drugs 2015; 33: 1257-62.
28. Wang YY, Zhong JH, Su ZY, Huang JF, Lu SD, Xiang BD, Ma L, et al. Albumin-bilirubin versus Child-Pugh score as a pre-dictor of outcome after liver resection for hepatocellular car-cinoma. Br J Surg 2016; 103: 725-34.
29. Ma XL, Zhou JY, Gao XH, Tian L, Wu J, Zhang CY, Zhou Y, et al. Application of the albumin-bilirubin grade for predicting prognosis after curative resection of patients with early-stage hepatocellular carcinoma. Clin Chim Acta 2016; 462: 15-22.
30. Zou D, Qi X, Zhu C, Ning Z, Hou F, Zhao J, Peng Y, et al. Al-bumin-bilirubin score for predicting the in-hospital mortality of acute upper gastrointestinal bleeding in liver cirrhosis: A ret-rospective study. Turk J Gastroenterol 2016; 27: 180-6. 31. Liu PH, Hsu CY, Hsia Y, Lee YH, Chiou YY, Huang YH, Lee
FY, et al. ALBI and PALBI grade predict survival for HCC across treatment modalities and BCLC stages in the MELD Era. J Gastroenterol Hepatol 2017; 32: 879-86.
Correspondence and reprint request:
Evangelos Cholongitas, M.D., Ph.D.
Associate Professor in Medicine, First Department of Internal Medicine, Medical School of National & Kapodistrian University
of Athens 17 Agiou Thoma street, 11527 Athens, Greece Tel.: +30 6936378903