14
SERVE PERFORMANCE OF THE MALE MASTER VOLLEYBALL
RENDIMIENTO DEL SAQUE DEL VOLEIBOL MÁSTER MASCULINO
Nelson Kautzner Marques Junior kautzner123456789junior@gmail Master in Science of the Human Motricity by the Castelo Branco
University, Rio de Janeiro Brazil Member of the Scientific Committee of the Revista Observatorio del Deporte Los Lagos University, Santiago Chile
ABSTRACT
The objective of the study was to determine of the male master volleyball the performance of the type of serve and the effect of the serve in the reception zone. The study was composed by 15 matches of the male master volleyball of the category 35 years or more. The volleyball matches were filmed and after was analyzed with the scout. The significance p and new statistic detected statistical difference of the serve continuity in two comparisons (16.87±8.92 of the overhand float serve versus 3.85±2.28 of the jump power serve, 14.07±6.47 of the jump float serve versus the jump power serve). Other result the significance p and new statistic detected statistical difference of the serve continuity in the reception zone in four comparisons (1.20±0.44 of the zone 2 versus 10.67±3.79 of the zone 5, zone 2 versus 13.67±5.36 of the zone 6, 2.87±3.39 of the zone 3 versus zone 5 and zone 3 versus zone 6). In conclusion, serve performance is important for the volleyball coach guides the player during the training and during the volleyball match.
Keywords: volleyball, sports, athletic performance, team sport.
RESUMEN
15
voleibol fueron filmadas y después fueron analizaron con un scout. La significación p y la nueva estadística detectaron la diferencia estadística de la continuidad del saque en dos comparaciones (16.87±8.92 del saque flotante versus 3.85±2.28 del saque potente con salto, 14.07±6.47 del saque flotante con salto versus el saque potente con salto). Otro resultado la significancia p y la nueva estadística detectaron la diferencia estadística de la continuidad
del saque en la zona de recepción en cuatro comparaciones(1.20 ± 0.44 de la zona 2 versus
10.67 ± 3.79 de la zona 5,zona 2 versus 13.67 ± 5.36 de la zona 6,2.87 ± 3.39 de la zona 3
versus zona 5 y zona 3 versus zona 6). En conclusión, el rendimiento del saque es importante para que el entrenador de voleibol oriente el jugador durante el entrenamiento y durante el partido de voleibol.
Palabras claves: voleibol, deportes, rendimiento atlético, deporte de equipo.
INTRODUCTION
The volleyball is a complex sport because the athlete needs of good technique and tactic,
adequate psychological preparation and excellent physical preparation. The volleyball
match is practiced with six skills during the game (Marques Junior and Arruda, 2017). The
serve, the attack and the block are the skills that the volleyball player practices point and
the reception and the set are the skills of construction and offensive development (Padilla,
Marques Junior and Lozada, 2018). The defense has the objective of avoid the point and
start the counterattack.
The volleyball skills determinants in the victory of the volleyball team are the skills with
high point production (attack, block and serve) (Cieminski, 2017). The serve is the first
“attack” of a volleyball team because a power serve has more opportunity of cause a point
or difficult the reception. The type of serve has influence on serve ball speed. The jump
power serve is the type of serve with more point and more error during the high level
professional volleyball because this serve practices greater speed on the ball (Kountouris,
Drikos, Aggelonidis and Laios, 2015). However, a greater number of serve studies are
about the professional volleyball (Denardi, Clavijo, Oliveira, Silva and Travassos, 2017;
Raiola, Altavilla, Luca and Tore, 2016) and with fewer number of research about serve of
16
What is the serve performance of the male master volleyball? What is the effect of the serve
in the reception zone of the male master volleyball?
The volleyball literature has no information about this theme. Then, a study about this
theme is important for the male master volleyball. The objective of the study was to
determine of the male master volleyball the performance of the type of serve and the effect
of the serve in the reception zone.
METHODOLOGY
Participants
The study was composed by 15 matches (total of 34 sets) of the male master volleyball of
the category 35 years or more during the Carioca Championship of 2016 and of 2017.
Procedures
The matches of the master volleyball were filmed with the camera Sony® handycam, model
DCR-SX20 on the tripod Mirage®. The data were collected with the camera in gymnasium,
at a distance and height of 2 meters (m) behind of the court because it was the best place to
film the master volleyball (Costa et al., 2016). Only a team filmed behind of the court was
analyzed with the scout at a distance of 1 m from the television. The researcher analyzed
the performance of the type of serve and determined the effect of the serve in the reception
zone with a scout adapted of Collet, Nascimento, Ramos and Stefanello (2011). Serve
analysis with the scout was at a distance of 1 meter from the Philips 42 LCD television with
the Compaq Presario CQ43 notebook. The analysis time of the serve was with 52.87±12.86
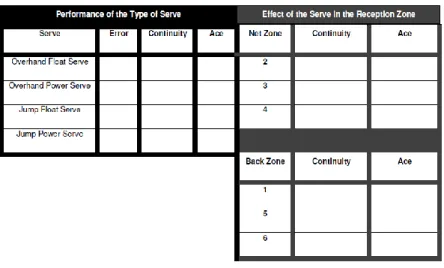
minutes. The scout used during the study had the size of an A4 sheet. The figure 1
17
Figure 1. Scout of the study.
The scale of three moments (error, continuity and ace) of the scout for determine the
performance of the type of serve and the scale of two moments (continuity and ace) of the
scout for determine the effect of the serve in the reception zone was adapted of Costa et al.
(2017). The scale of the scout used in the study had the following evaluation of the quantity
of actions: error (the volleyball player practiced a serve that did not go to the reception zone
and resulted in a point for the opponent, continuity (the volleyball player practiced a serve
with reception of the opponent) and ace (the volleyball player practiced a serve with point
and the opponent did not practice good reception). The author calculated the performance
coefficient (PC) of Coleman (2002) of each type of serve for determine the quality of the
skill. The equation was as follows: PC = [(4 x point) + (2 x continuity)] : total of actions
(point, continuity and error) = ?. The classification of the performance coefficient of the
serve for the male master volleyball of the category 35 years or more was as follows: 0 to 1
is a low performance, 1.1 to 2 is a medium performance and 2.1 to 3 or more is a high
performance. The researcher practiced the reliability of the serve performance and of the
18 Statistical analysis
The results were expressed as mean and standard deviation, minimum and maximum,
confidence interval of 95%, total and percentage. The effect size (ES) of Hedges and Olkin
(1985) was calculated in the Excel®. The classification of the ES was based in Corres,
Álvarez and Arderiu (2012), the classification was as follows: 0.20 or less is very small the
effect, 0.21 to 0.49 is small the effect, 0.50 to 0.79 is medium the effect and 0.80 or more is
great the effect. Based in Weinberg and Goldberg (1990), was calculated the probability of
points in the reception zone with the following equation: Probability of Point = [number of
points in the reception zone : total of actions in the reception zone (continuity and ace)] x
100 = ?%. The researcher verified the action (error, continuity and ace) and the
performance coefficient of the type of serve of all the 15 matches. Then, the normality of
the data was assessed by the Shapiro Wilk test (n = 50, p p≤0.05) and/or with the Kolmogorov Smirnov test (n>50, p≤0.05), but was observed the normality of the data
through of the histogram. In case of data normal, the difference was analyzed using one
way Anova and the Tukey post hoc was used to identify the difference. In case of data not
normal, the difference between was analyzed using Kruskal Wallis Anova and the Dunn
post hoc was used to identify the difference. After the calculation of the Anova, the new
statistic of Cumming (2014) was performed for the significance p to be more precise. The
same statistical models of the type of serve were applied in the effect of the serve in the
reception zone. All these statistical treatments of the significance p were performed with
accepted results with significance level of p≤0.05 and according to the procedures of the
19
RESULTS
The male master volleyball player of the category 35 years or more practiced 611 serves
during 15 matches or 34 sets. The type of serve the figure 2 illustrates the result, but the
player did not practice the overhand power serve.
Figure 2. Master volleyball serve.
The jump power serve the player practiced more error, the continuity the overhand float
serve the master player practiced more and the overhand float serve had more aces. The
20
Figure 3. Error, continuity and ace of the master volleyball serve.
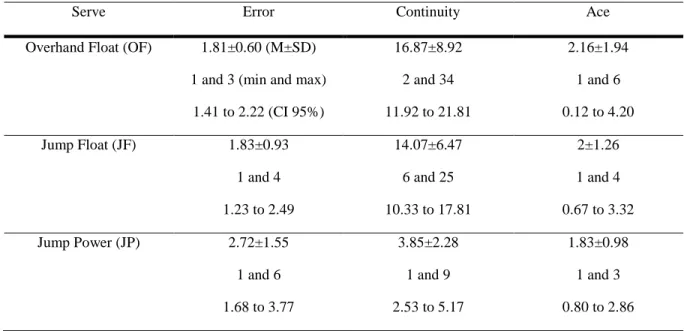
The table 1 the study showed the mean and the standard deviation (M±SD), the minimum
and the maximum (min and max), the confidence interval of 95% (CI 95%) of the error, of
the continuity, of the ace of each serve.
Table 1. Result of the quantity of error, of continuity and of ace of the type of serve.
Serve Error Continuity Ace
Overhand Float (OF) 1.81±0.60 (M±SD) 1 and 3 (min and max)
1.41 to 2.22 (CI 95%)
16.87±8.92 2 and 34 11.92 to 21.81
2.16±1.94 1 and 6 0.12 to 4.20 Jump Float (JF) 1.83±0.93
1 and 4 1.23 to 2.49
14.07±6.47 6 and 25 10.33 to 17.81
2±1.26 1 and 4 0.67 to 3.32 Jump Power (JP) 2.72±1.55
1 and 6 1.68 to 3.77
3.85±2.28 1 and 9 2.53 to 5.17
21
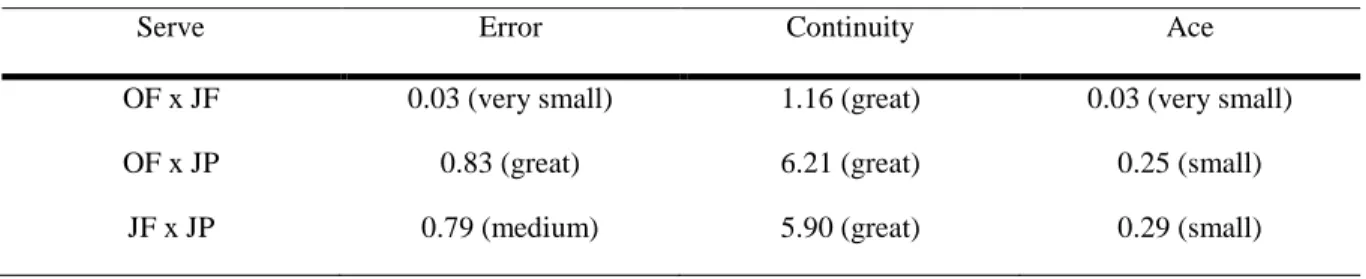
The table 2 the study showed the effect size (ES) and the classification of the error, of the
continuity, of the ace of each serve.
Table 2. Result of the ES and the classification of the quantity of error, of continuity and of ace of the type of serve.
Serve Error Continuity Ace
OF x JF OF x JP JF x JP
0.03 (very small) 0.83 (great) 0.79 (medium)
1.16 (great) 6.21 (great) 5.90 (great)
0.03 (very small) 0.25 (small) 0.29 (small)
The Shapiro Wilk test detected data not normal of the serve error and of the serve ace, but
the same test detected data normal of the serve continuity. The histogram illustrates the
result.
Serve Error
0 2 4 6 8
0 2 4 6 8 F re q u e n c y Serve Ace
0 2 4 6 8
0 1 2 3 4 F re q u e n c y Serve Continuity
0 20 40 60 80
0 2 4 6 F re q u e n c y
Fig. 4. Histogram.
Kruskal Wallis Anova did not identify statistical difference of the serve error [H (2) = 3.42,
p = 0.18] and of the serve ace [H (2) = 0.25, p = 0.87]. But the one way Anova identified
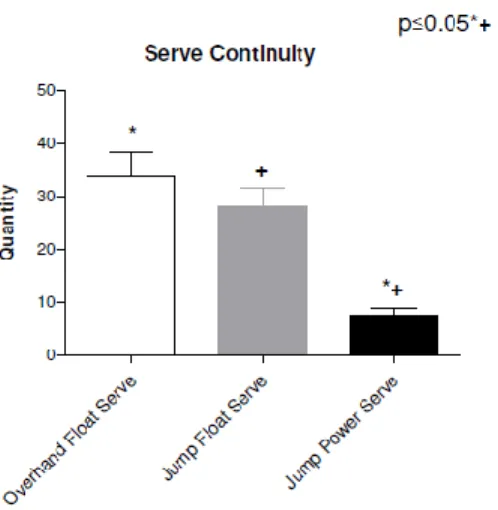
statistical difference of the serve continuity [F (2,40) = 15.51, p = 0.0001]. The post hoc
Tukey detected statistical difference (p≤0.05) of the serve continuity between the overhand
22
26.02), jump float serve (mean = 14.07) versus the jump power serve (mean difference =
20.43). The figure 5 illustrates the result with statistical difference.
Figure 5. Serve continuity.
After of the calculation of the one way Anova and Kruskal Wallis Anova, the researcher
practiced the new statistic of Cumming (2014) with the data of each serve. The new statistic
identified statistical difference of the serve continuity in two comparison (overhand float
serve versus the jump power serve, jump float serve versus jump power serve) because the
p was lower than 0.05 and the gap was greater than 2 for a n equal the 10 or more. The
figure 6 shows the results with statistical difference.
23
Figure 6. Result of the serve continuity.
Therefore, the significance p and new statistic detected statistical difference of the serve
continuity in two comparisons (overhand float serve versus the jump power serve, jump
float serve versus jump power serve). Then, these two comparisons of the serve continuity
were with statistical difference. The overhand float serve and the jump float serve practiced
more continuity. The table 3 the study showed the all the results of the new statistic of
Cumming (2014) about the serve error, the serve continuity and the serve ace.
Table 3. Result of the new statistic of each type of serve.
Comparison Error (n = 11 and 12) Continuity (n = 14 and 15) Ace (n = 6) OF x JF 1.77 (overlap), p = 1 1.35 (overlap), p = 0.33 1.76 (overlap), p = 0.91 OF x JP 0.66 (overlap), p = 0.06 -2.23* (gap), p = 0.001* 1.85 (overlap), p = 0.79 JF x JP 0.86 (overlap), p = 0.08 -2.11* (gap), p = 0.001* 1.66 (overlap), p = 0.70
n = 10 or more: Overlap of 0.50 or less*, Gap of 1 to more* and 2 to more* and p≤0.05* (statistical
difference). n = 3: Overlap of 1* and of 0.50*, p≤0.05* (statistical difference).
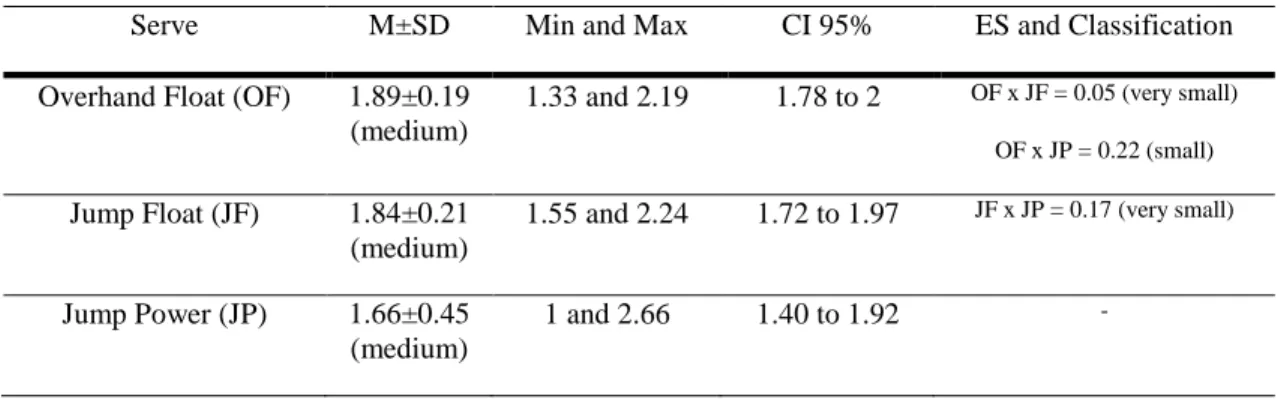
The table 4 was presented the results of the performance coefficient of each serve of the
master volleyball of the category 35 years or more.
Table 4. Result of the performance coefficient of the serve.
Serve M±SD Min and Max CI 95% ES and Classification Overhand Float (OF) 1.89±0.19
(medium)
1.33 and 2.19 1.78 to 2 OF x JF = 0.05 (very small) OF x JP = 0.22 (small)
Jump Float (JF) 1.84±0.21 (medium)
1.55 and 2.24 1.72 to 1.97 JF x JP = 0.17 (very small)
Jump Power (JP) 1.66±0.45 (medium)
24
The Shapiro Wilk test detected data not normal of the performance coefficient of each
serve. The histogram illustrates the result.
Performnce Coefficient of the Serve
0 1 2 3
0 2 4 6 8 10 F re q u e n c y
Figure 7. Histogram.
Kruskal Wallis Anova did not identify statistical difference of the performance coefficient
(PC) of each serve [H (2) = 5.09, p = 0.07]. But the overhand float serve was the best serve
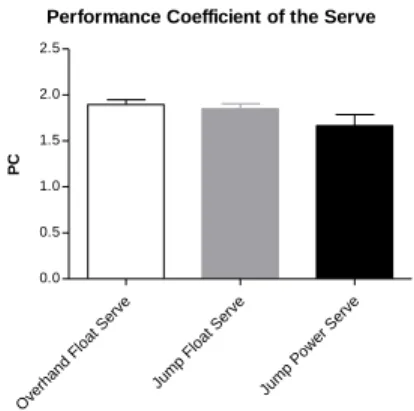
and the second serve was the jump float serve. The figure 8 illustrates the result.
Performance Coefficient of the Serve
Overhand Floa
t Serv e
Jum p Fl
oat S erv e Jum p P ower Serv e 0.0 0.5 1.0 1.5 2.0 2.5 PC
Figure 8. Result of the performance coefficient of the type of serve.
The table 5 the study showed the all the results of the new statistic of Cumming (2014)
about the performance coefficient of each serve.
25
Comparison Result OF x JF 1.96 (overlap), p = 1 OF x JP 0.83 (overlap), p = 0.09
JF x JP 0.85 (overlap), p = 0.10
n = 10 or more: Overlap of 0.50 or less* and p≤0.05* (statistical difference).
The figure 9 illustrates the probability of points of the serve in each reception zone with the
calculation of Weinberg and Goldberg (1990).
Figure 9. Probability of points of the volleyball serves in the reception zone.
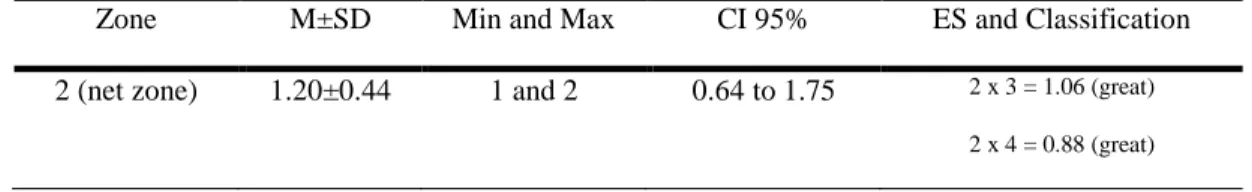
The table 6 the study showed the mean and the standard deviation (M±SD), the minimum
and the maximum (min and max), the confidence interval of 95% (CI 95%) of the serve
continuity in each reception zone.
Table 6. Result of the serve continuity in each reception zone.
Zone M±SD Min and Max CI 95% ES and Classification 2 (net zone) 1.20±0.44 1 and 2 0.64 to 1.75 2 x 3 = 1.06 (great)
26
2 x 1 = 3.87 (great)
2 x 5 = 6.62 (great)
2 x 6 = 7.36 (great)
3 (net zone) 2.87±3.39 1 and 11 0.03 to 5.71 3 x 4 = 0.06 (very small) 3 x 1 = 2.46 (great)
3 x 5 = 5.01 (great)
3 x 6 = 6.07 (great)
4 (net zone) 2.75±2.87 1 and 7 -1.82 to 7.32 4 x 1 = 2.45 (great) 4 x 5 = 4.93 (great)
4 x 6 = 5.82 (great)
1 (back zone) 6.73±3.90 2 and 17 4.57 to 8.89 1 x 5 = 2.67 (great) 1 x 6 = 4.20 (great)
5 (back zone) 10.67±3.79 2 and 16 8.56 to 12.77 5 x 6 = 1.83 (great)
6 (back zone) 13.67±5.36 4 and 27 10.69 to 16.64 -
The Shapiro Wilk test detected data not normal of the serve continuity in each reception
zone. The histogram illustrates the result.
Serve Continuity in the Reception Zone
0 10 20 30
0 2 4 6
F
re
q
u
e
n
c
y
Figure. 10. Histogram.
Kruskal Wallis Anova identified statistical difference of the serve continuity in each
reception zone, H (5) = 37.53, p = 0.0001]. The post hoc Dunn detected statistical
difference (p≤0.05) of the serve continuity between the zone 2 (mean = 1.20) versus the
27
13.67) (difference in rank sum = -40.67), zone 3 (mean = 2.87) versus the zone 5
(difference in rank sum = 26.61), zone 3 versus the zone 6 (difference in rank sum =
-33.64), zone 4 (mean = 2.75) versus the zone 6 (difference in rank sum = -34.39) and zone
1 (mean = 6.73) versus the zone 6 (difference in rank sum = -19.53). The figure 11
illustrates the result with statistical difference.
Figure 11. Serve continuity in each reception zone.
After of the calculation of the Kruskal Wallis Anova, the researcher practiced the new
statistic of Cumming (2014) with the data of the serve continuity in each reception. The
new statistic identified statistical difference of the serve continuity in each reception in six
comparisons because the p was lower than 0.05 and the gap was greater than 1 and the
overlap was lower than 0.50 (n = 10 or more). The table 7 the study showed the all the
results of the new statistic of Cumming (2014) about the serve continuity in the reception
zone.
Table 7. Result of the new statistic of the serve continuity in the reception zone.
Comparison Result Comparison Result
28 2 x 4
2 x 1
2 x 5
2 x 6
3 x 4
3 x 1
3 x 5
1.63 (overlap), p = 0.51
0.11* (overlap), p = 0.07
-1.30* (gap), p = 0.04*
1.83* (gap), p = 0.005*
1.56 (overlap), p = 0.96
1.46* (overlap), p = 0.02*
-1.15* (gap), p = 0.001*
4 x 1
4 x 5
4 x 6
1 x 5
1 x 6
5 x 6
0.80 (overlap), p = 0.08
-0.37 (gap), p = 0.002*
-0.93 (gap), p = 0.001*
0.24* (overlap), p = 0.01*
-0.65 (gap), p = 0.001*
0.85 (overlap), p = 0.09
n = 10 or more: Overlap of 0.50 or less*, Gap of 1 to more* and 2 to more* and p≤0.05* (statistical difference).
Therefore, the significance p and new statistic detected statistical difference of the serve
continuity in the reception zone in four comparisons (zone 2 versus zone 5, zone 2 versus
zone 6, zone 3 versus zone 5 and zone 3 versus zone 6). Then, these four comparisons of
the serve continuity in the reception zone were with statistical difference.
The table 8 the study showed the mean and the standard deviation (M±SD), the minimum
and the maximum (min and max), the confidence interval of 95% (CI 95%) of the serve ace
in each reception zone.
Table 8. Result of the serve ace in each reception zone.
Zone M±SD Min and Max CI 95% ES and Classification 1 (back zone) 1.80±1.09 1 and 3 0.43 to 3.16 1 x 5 = 0.19 (very small)
1 x 6 = 0.50 (medium)
5 (back zone) 1.57±0.78 1 and 3 0.84 to 2.29 5 x 6 = 0.30 (small)
29
The Shapiro Wilk test detected data not normal of the serve ace in each reception zone. The
histogram illustrates the result.
Serve Ace in the Reception Zone
0 1 2 3 4
0 2 4 6 8 10 F re q u e n c y
Figure. 12. Histogram.
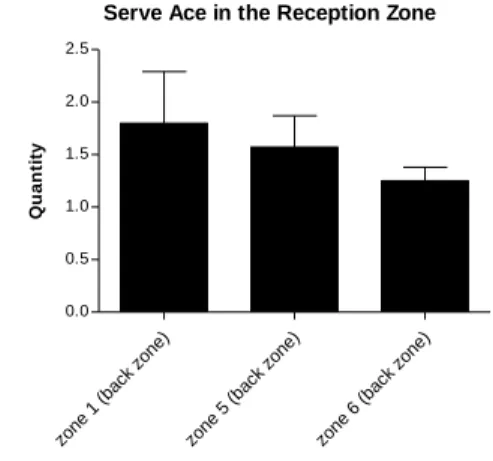
Kruskal Wallis Anova did not identify statistical difference of the serve ace in each
reception zone [H (2) = 3.07, p = 0.21]. The figure 14 illustrates the result.
Serve Ace in the Reception Zone
zone 1 (ba
ck z one)
zone 5 (ba
ck z one)
zone 6 (ba
ck z one) 0.0 0.5 1.0 1.5 2.0 2.5 Q u a n ti ty
Figure 13. Result of the serve ace in each reception zone.
The table 9 the study showed the all the results of the new statistic of Cumming (2014)
about the serve ace in each reception zone.
Table 9. Result of the new statistic of the serve ace in each reception zone.
30
zone 1 x zone 5 1.49 (overlap), p = 0.57 zone 1 x zone 6 0.68 (overlap), p = 0.08 zone 5 x zone 6 1.02 (overlap), p = 0.28
n = 10 or more: Overlap of 0.50 or less* and p≤0.05* (statistical difference).
DISCUSSION
The study detected a total of 611 serves. The quantity of serves was greater than the study
of the female university volleyball (76 to 480 serves) (Carrillo et al., 2016). The study had
different result (15% of the jump power serve, 38% of the jump float serve and 47% of the
overhand float serve, see figure 2) than the volleyball under 23 because the master player
practiced more the overhand float serve and men`s under 23 practiced more the jump float
serve (54.9 to 77.3%) (Stankovic, Llamas, Peric and Escudero, 2018). Perhaps the master
volleyball player practiced more the overhand float serve because this serve requires less
effort than the jump serves.
The number of jump power serve error was higher (42% in figure 3, 2.72±1.55 in table 1)
than the overhand float serve (28%, 1.81±0.60) and the jump float serve (30%, 1.83±0.93).
The result of the study was similar to the professional volleyball (Lirola, 2006). Other result
of the study was equal to the professional volleyball because the overhand float serve had
least quantity of error. The study detected more aces of the overhand float serve (36% in
figure 3, 2.16±1.94 in table 1), in second place was the jump float serve (33%, 2±1.26) and
in last was the jump power serve (31%, 1.83±0.98). This result was different of the
professional volleyball because the professional volleyball player practices more aces with
the jump power serve than the other serve (Ciuffarella et al., 2013). The study does not
know the cause, but perhaps the male master volleyball of the category 35 years or more
31
volleyball player needs to use this serve at appropriate moments of the volleyball match.
However, the serve error and the serve ace had no statistical difference.
The serve continuity had statistical difference in two comparisons (overhand float serve
versus jump power serve, jump float serve versus jump power serve). Then, overhand float
serve (50% in figure 3, 16.87±8.92 in table 1) and jump float serve (39%, 14.07±6.47) had
more continuity than the jump power serve (11%, 3.85±2.28). The study had the same
result of the professional volleyball because the jump power serve causes less continuity,
but this serve causes more aces and errors (Lirola, 2006). However, the study detected more
error, less ace of the jump power serve and the master volleyball player practiced less this
serve.
The type of serve practiced by the male master volleyball player had limitation of the study
because the researcher did not determine the type of serve practiced by the player`s
position, the type of serve of the winner and of the loser and the best moment for the player
practices a type of serve. However, the study determined the best serve for the male master
volleyball of the category 35 years or more. The overhand float serve had the best
performance coefficient with 1.89±0.19 (medium), in second place was the jump float serve
with 1.84±0.21 (medium) and in last was the jump power serve with 1.66±0.45 (medium).
These serves did not have statistical difference, but the master volleyball player needs to
practice more during the match the overhand float serve and the jump float serve because
these serve had the best performance. The master volleyball player of the category 35 years
did not practice overhand power serve, but the volleyball coach needs to guide the athlete
for practice this serve with the objective of verify the performance of the overhand power
serve during the volleyball match.
The study detected more serve continuity of the reception zone 1 (6.73±3.90 in table 6), 5
(10.67±3.79) and 6 (13.67±5.36). All these zones are of the back zone. In four comparisons
32
and zone 3 versus zone 6), the back zone (zone 5 and 6) had more serve continuity of the
reception zone than the net zone (zone 2 and 3). These results of the study were similar to
the Spanish university volleyball because the back zone the player practiced more serve
continuity (Moreno, Alcaraz, Moreno, Molina and Santos, 2007).
However, the net zone the player did not practice serve ace and the back zone the master
volleyball player practiced serve ace. The zone 1 the player practiced more serve ace with
1.80±1.09 and had more probability of point with 8.18% - see table 8. The others zones
with serve ace were the zone 5 (1.57±0.78 and 6.43% of probability of point) and the zone
6 (1.25±0.45 and 6.81% of probability of point). These results were different of the Spanish
university volleyball, the zone 6 had more serve ace (47 aces), in second was the zone 5 (16
aces) and 1 (15 aces) (Moreno et al., 2007).
Therefore, the male master volleyball of the category 35 years or more needs practice more
serve for the zone 1 because the study detected more serve ace. But the result about the
serve in the reception zone had a limitation because the author did no determine the
performance of the type of serve in the reception zone.
CONCLUSIONS
The study about the serve of the male master volleyball of the category 35 years or more
identified the performance of the type of serve and the serve performance in the reception
zone. The results determined the overhand float serve with the best serve and the serve ace
occurred more in the reception zone 1. In conclusion, serve performance is important for
the volleyball coach guides the player during the training and during the volleyball match.
REFERENCES
Arruda, D., e Marques Junior, N. (2015). Estudo dos fundamentos de jovens jogadores do
voleibol feminino. Revista Brasileira de Prescrição e Fisiologia do Exercício, 9(56),
33
Carrillo, J., Tormo, J., Rábago, J., and Marroyo, J. (2016). Análisis notacional de las
acciones de juego realizadas por jugadoras de voleibol en competición universitaria. Sport
TK-Revista Euroamericana de Ciencias del Deporte, 5(2), 113-122.
Cieminski, K. (2017). The efficiency of executing technical actions by female volleyball
palyers depending on their positions on the court. Baltic Journal of Health and Physical Activity, 9(3):44-52.
Ciuffarella, A., Russo, L., Masedu, F., Valenti, M., Izzo, R., and Angelis, M. (2013).
National analysis of the volleyball serve. Timisoara Physical Education and Rehabilitation
Journal, 6(11), 29-35.
Coleman, J. (2002). Scouting opponents and evaluating team performance. In D. Shondell,
and C Reynaud (Eds). The volleyball coaching bible (p. 321-346). Champaign: Human
Kinetics.
Collet, C., Nascimento, J., Ramos, V., and Stefanello, J. (2011). Construção e validação do
instrumento de avaliação do desempenho técnico-tático no voleibol. Revista Brasileira de
Cineantropometria e Desempenho Humano,13(1), 43-51.
Corres, R., Álvarez, J., y Arderiu, X. (2012). The effect size: beyond statistical
significance. EJIFCC, 23(1), 1-5.
Costa, G., Maia, M., Capuzzo, J., Evangelista, B., Freire, A., Nora, F., Campos, M., and
Ugrinowitsch, H. (2016). Offensive structuring in men`s high-level volleyball: analysis of
the attack zone. Revista Brasileira de Cineantropometria e Desemepenho Humano, 18(5),
611-619.
Costa, Y., Sousa, M., Silva, J., Araújo, J., Neto, G., and Batista, G. (2017). Indicadores de
rendimento técnico-tático em função do resultado do set no voleibol escolar. Motricidade,
34
Cumming, G. (2014). The new statistics: why and how. Psychological Science, 25(1), 7-29.
Denardi, R., Clavijo, F., Oliveira, T., Silva, S., Travassos, B., and Corrêa, U. (2017). The
influence of defender`s positional gap on the aces in the sport of volleyball. Journal of Human Sport and Exercise, 12(2), 286-293.
Hedges, L., and Olkin, I. (1985). Statistical methods for meta-analysis. New York: Academic Press.
Kountouris, P., Drikos, S., Aggelonidis, T., and Laios, A. (2015). Evidence for differences
in men`s and women`s volleyball games based on skills effectiveness in four consecutive
Olympics tournaments. Comprehensive Psychology, 4(9), 1-7.
Lirola, D. (2006). Estudio y análisis del saque en el voleibol masculino de alto rendimiento.
Revista Internacional de Ciencias del Deporte, 5(2), 12-28.
Marques Junior, N, and Arruda, D. (2017). Fundamentos praticados por uma equipe
feminina de voleibol sub 15 durante o campeonato paranaense de 2015. Educación Física y
Ciencia, 19(1), 1-17.
Moreno, M., Alcaraz, A., Moreno, A., Molina, J., and Santos, J. (2007). Estudio de la
dirección del saque en la superliga masculina de voleibol. Motricidade. European Journal
of Human Movement, -(18),111-34.
Padilla, J., Marques Junior, N., y Lozada, J. (2018). Análisis del tiempo del rally y de la
pausa en el voleibol master. Revista Arrancada, 18(33), 38-49.
Raiola, G., Altavilla, G., Luca, C., and Tore, P. (2016). Analysis on some aspects of the
35
Stankovic, M., Llamas, G., Peric, D., and Escudero, M. (2018). Analysis of serve
characteristics under rules tested at volleyball men`s under 23 World Championship. Retos,
-(33), 20-6.
Weinberg, S., and Goldberg, K. (1990). Statistics for behavioral sciences. Cambridge: Cambridge University.