The non-linear method of gas bubbles detection in the bottom sediments
PACS: 43.30.Lz
Jaromir Jakacki; Zygmunt Klusek; Jaros³aw Têgowski Institute of Oceanology, Polish Academy of Sciences, Powstañców Warszawy 55,81-712 Sopot, Poland, phone: +48 58 5517283, e-mail: [email protected]
ABSTRACT
Nonlinear acoustic method was applied to estimate concentration of gas bubbles in the surficial layers of sediments. The method is based on the theory of non-linear response of a damped single gas bubble in a fluid-like medium at resonance frequency to a high-intensity sound. The measurements were performed with two signals emitted at different frequencies and nonlinear components of backscattering signals were observed. The gas bubble concentration was estimated using the amplitude of sum component in echosignals generated only by gas bubbles. Results received for different types of bottom sediments in the Gulf of Gdañsk in the Baltic Sea have been presented.
INTRODUCTION
It is well known that the ocean bottom sediments are saturated with free gas bubbles [4, 5, 6]. Gas occurring in the surficial layer of marine sediments can be of biological origin, that is, could have been formed by bacterial reduction of organic matter, or be a product of migration out of the deeper layers from older hydrocarbons or clathrate deposits.
Gas from biological sources is composed mostly of methane. The gas originating from deeper layers of sediments may contain also higher hydrocarbons and carbon dioxide. The presence of gas creating dead areas in the water can seriously affect the marine environment. Therefore the animals and plants living at the bottom of a sea or lake suffer seriously from changing water chemistry.
Gas fluxes from the sea bottom have been poorly studied and their effect on atmospheric carbon dioxide and methane levels has not been evaluated. Information on bubble distribution and abundance is important in understanding the factors that control the formation, migration and distribution of shallow gas deposits. Information on bubble distribution and abundance is necessary to determine the impact of gas on the global environment.
NON-LINEAR ACOUSTIC METHOD
The method is based on the theory of the non-linear response of a damped single gas bubble submerged in a fluid-like medium at resonance frequency to a high-intensity sound. It utilises the fact that the value of the nonlinear parameter B/A of gas free sediments does not exceed 12 while in gassy sediments the nonlinearity is much higher, in fact, up to 106 [2].
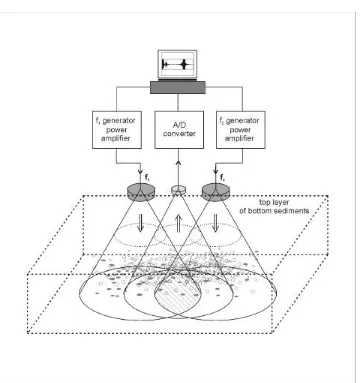
The idea behind the method is based on the fact that free gas in sediments substantially increases the non-linear acoustic properties of the medium [3]. Therefore, we could recognise the free bubble presence measuring the nonlinearity of sediments. This approach is particularly effective in cases where low gas concentrations are invisible to conventional acoustic methods. When a free gas bubble is insonified by a harmonic acoustic signal of frequency f and of high amplitude (hundreds of kPa), it generates a backscattered signal not only at the pulse frequency but also at its harmonics, that is, at multiples of the driving frequency: 2f, 3f, etc. In the case of a two-frequency system, two signals with frequencies f1 and f2 are transmitted. Those frequencies are close to each other (less than 10% different) so that non-linear spectral components could be received only from the bubbles driven around their resonance frequency. The spectrum of the received echo signal will contain, beside their primary frequencies and their harmonics, also signals at the sum f1+f2 and at the difference |f1-f2|. Measuring these non-linear spectral components of echo-signal in different frequency bands and using an inversion procedure, one can obtain information on bubble size and concentration. The algorithm of the inversion procedure is described below.
The intensity of acoustic waves scattered at the volume dV is defined as follows:
dV
r
s
I
dI
v ir 2
4
π
ωo
=
, (1)where: I0 is the sound intensity of the incident wave, rthe distance from scattering volume, sv the volume scattering coefficient. The volume scattering coefficient
s
v is dependent on bubbledensity n(ao) and scattering cross-section of a single bubble at given frequencyσ(ao).
∫
∞=
0)
(
)
(
a
oa
oda
on
s
vσ
. (2)where a0is the bubble radius. The presented method analyses the oscillations of gas bubble at
the sum of two driven frequencies. The scattering cross-section
σ
Ω+for the sum frequency is expressed in the following form:(
)
(
)
[
]
(
)
[
]
[
(
)
4]
[
(
2 2)
2 2 4]
2 2 2 2 2 2 4 1 2 2 2 1 2 2 2 2 1 2 2 1 2 2 2 1 2 4
3
1
+ + + Ω
Ω
+
Ω
−
+
−
+
−
+
+
−
+
Ω
=
+δ
ω
ω
δ
ω
ω
ω
δ
ω
ω
ρ
ω
ω
ω
ω
ω
γ
π
σ
o o o o o oa
P
P
, (3)
whereΩ+ =ω1+ω2.
Assuming that only bubbles resonating to driven signals answer at sum frequency, the formula for volume scattering coefficient at sum frequency could be easily obtained
(
)
(
)
[
]
(
)
[
]
rr v
a
a
n
P
P
s
3 4 2 4 1 4 2 2 2 2 2 2 1 2 2 1 2 2 2 1 2 44
)
(
1
3
δ
π
ω
ω
δ
ω
ρ
ω
ω
ω
ω
ω
γ
π
×
×
Ω
+
Ω
−
+
+
−
+
Ω
=
+ + + + Ω o oo . (4)
Putting this coefficient to the equation (1) and taking into account calibration parameters we can obtain the formula for the bubble density.
the water-bottom interface and the acoustic wave attenuation in sediments should be taken into account to acquire real values of I0in sediments.
EXPERIMENTAL METHODOLOGY
[image:3.596.120.481.163.546.2]The geometry of the experimental set-up [7, 8] is shown in Figure 1.
Figure 1. The geometry of experimental set-up.
RESULTS OF GAS BUBBLES MEASUREMENTS IN BOTTOM SEDIMENTS
[image:4.596.146.451.240.491.2]The registration of gas bubbles concentration in the bottom sediments was performed from board of r/v Oceania at stations distributed in the shallow areas of the Gulf of Gdañsk. The measurements were made along the transects marked with the thick lines (Figure 2) every 0.5 nautical mile. The transect, considered in this article, started near the Hel peninsula at point 1 and finished at point 14. In the investigated area, the dominating sediments were marine silts and clays with gas bubbles formed by bacterial reduction of organic matter. Marine silts and clays are acoustically soft, so a deep penetration of the acoustic signal could be expected. There appear, however, the acoustical anomalies characterised by small penetration of acoustical waves. The reason for this phenomenon is, at all probability, a gas layer. It can be presumed that part of gassy sediments is a product of migration processes out of deeper layers from hydrocarbons deposits.
Figure 2. Acoustical transects of gas bubble research in sediments in the Gulf of Gdañsk.
The types of top layer of sediments: 1 - gravel, stones, 2 - sands, 3 - marine silty clay, 4 - marine clayey silt, glacial marine clay [9].
Figure 3 shows the example of mean spectrum of echosignals scattered at the bubbly layer in the sediment. The spectrum was obtained by averaging 500 pulses collected at the one station. We can see the presence of both emitted linear frequencies f1 and f2, harmonic frequencies 2f1 and 2f2 and sum frequency f1+ f2. Differential frequency was filtered out. The sum frequency is the result of the nonlinear oscillations of gas bubbles only. This effect is not visible in signals backscattered at gas free sediment. Using the linear method only, we could not distinguish between the gassy and other classes of sediments.
In Figure 4, the profiles of gas bubble concentration registered at fourteen stations along the profile A (Fig. 2) are presented. At each station, the measurements were carried out from drifting ship. The results of measurements indicate that resonant gas bubble concentration vary from about 0 to 350 m-3µm-1. The measured concentration is strongly variable and does not depend on the sea depth. The highest values of concentration were registered at stations 3 and 10 for marine silty clay, whereas there were almost no bubbles at the stations 6-8 for marine clayey silt and glacial marine clay.
the averaging procedure was conducted for all pings at one measurement point (for approximately 500 pings). The results of averaging are shown in Fig. 5.
[image:5.596.169.428.114.338.2]
Figure 3. The mean spectrum of received signals with double and sum frequencies (marked with arrows). 53.0 53.5 54.0 54.5 55.0 55.5 56.0 56.5 57.0 d e p th [ m ]
number of pulses
44.0 44.2 44.4 44.6 44.8 45.0 45.2 45.4 45.6 45.8 50.0
4 0 . 5
4 1 . 0
4 1 . 5
4 2 . 0
4 2 . 5
5 4 . 0
5 4 . 2
5 4 . 4
5 4 . 6
5 4 . 8
5 5 . 0
5 5 . 2
5 5 . 4
5 5 . 6
5 5 . 8
5 6 . 0
5 4 . 0
5 4 . 2
5 4 . 4
5 4 . 6
5 4 . 8
5 5 . 0
5 5 . 2
5 5 . 4
5 5 . 6
5 5 . 8
5 6 . 0
5 4 . 0
5 4 . 5
5 5 . 0
5 5 . 5
5 6 . 0
5 6 . 5
5 1 . 0
5 1 . 2
5 1 . 4
5 1 . 6
5 1 . 8
5 2 . 0
5 2 . 2
5 2 . 4
5 2 . 6
5 4 . 8
5 3 . 0
4 7 . 5
4 8 . 0
4 8 . 5
4 9 . 0
4 9 . 5
5 0 . 0
4 4 . 0
4 4 . 5
4 5 . 0
4 5 . 5
4 6 . 0
4 6 . 5
4 7 . 0
3 9 . 0
3 9 . 2
3 9 . 4
3 9 . 6
3 9 . 8
4 0 . 0
4 0 . 2
4 0 . 4
4 0 . 6
4 0 . 8
4 1 . 0
3 0 . 0
3 0 . 5
3 1 . 0
3 1 . 5
3 2 . 0
3 2 . 5
3 3 . 0
3 3 . 5
3 4 . 0
2 8 . 0
2 8 . 2
2 8 . 4
2 8 . 6
2 8 . 8
2 9 . 0
2 9 . 2
2 9 . 4
2 9 . 6
2 9 . 8
3 0 . 0
2 7 . 0
2 7 . 5
2 8 . 0
2 8 . 5
2 9 . 0
2 9 . 5
3 0 . 0 2 5 . 0
2 5 . 2
2 5 . 4
2 5 . 6
2 5 . 8
2 6 . 0
2 6 . 2
2 6 . 4
2 6 . 6
2 6 . 8
2 7 . 0
101 101 . 4 1 . 8 2 . 2 2 . 6 3 . 0 3 . 4 3.810 10 10 10 10 10
1 2 3 4 5 6 7
8 9 10 11 12 13 14
0 200 400 0 200 400 0 200 400 0 200 400 0 200 400 0 200 400 0 200 400 0 2 0 0 4 0 0 0 2 0 0 4 0 0 0 200 400 0 200 400 0 200 400 0 200 400 0 200 400
d e p th [ m ]
number of pulses
n ( a ) [ m
0 - 3
µm ]-1
Figure 5. The averaged values of bubble concentration at the successive measurement stations from transect (compare with Fig. 2).
CONCLUSIONS
The method of nonlinear acoustics allows determining gas bubble concentration in the water body and in the upper layer of sediments. The nonlinear component of echo signal – the sum frequency generated by gas bubbles trapped in sediment - distinguishes bubbles from various sediment components with a high precision. The highest values of concentration were observed for marine silty clay, whereas there were almost no bubbles in marine clayey silt and glacial marine clay. The presented method can be useful for oil and gas deposits exploration, control of gas emanation during drilling, ecological monitoring of a sulphide hydrogen appearance in the top sediment layers. The method gives information about nonlinear bottom sediment properties useful for the remote bottom classification.
REFERENCES
1. Biot M.A., 1956, - Theory of Propagation of Elastic Waves in a Fluid-Saturated porous Solid, J. Acoust. Soc. Am., 28.
2. Boyle, F.A. and Chotiros, N. P., 1998, Nonlinear acoustic scattering from a gassy poroelastic seabed, J. Acoust. Soc. Am. 103, 1328.
3. Hamilton, E. L. and R. T. Bachman, 1982, Sound velocity and related marine properties of marine sediments, J. Acoust. Soc. Am. 72.
4. Anderson, L. and Hampton, L. D., 1980, Acoustics of gas bearing sediments. I. Background, J. Acoust. Soc. Am. 67, 1865–1889.
5. Anderson, L. and Hampton, L. D., 1980, Acoustics of gas bearing sediments. II. Measurements and models, J. Acoust. Soc. Am. 67, 1890–1903.
6. Kaplan, I. R. 1974, Natural Gases in Marine Sediments, Plenum Press, New York and London.
7. Klusek, Z., Matwiejew, A. L., Potapow, A. I. and Sutin, A. M., 1995, Observation of non-linear scattering of acoustical waves at sea sediments, Acoustics Letter 18, No 11, 198-203.
8. Karpow, S. W., Klusek, Z., Matwiejew, A. L., Potapow, A. I. and Sutin, A. M., 1996, Non-linear scattering of acoustical waves at gas bearing sea sediments, Akust. Zh, 42(4), 527-533.