SERIE DO C UM ENTO S DE TRA BA JO
No . 1 5 2
M a rzo 2 0 1 4
EQUALITY OF EDUCATIONAL OPPORTUNITIES IN COLOMBIA: A
METROPOLITAN AREA COMPARISON
Luis Fernando Gamboa
Erika Londoño
Equality
of
Educational
Opportunities
in
Colombia:
A
Metropolitan
Area
Comparison
.
Luis Fernando Gamboa1
Profesor Facultad de Economía, Universidad del Rosario.
Erika Londoño
Facultad de Economía, Universidad del Rosario.
February 2014 Abstract
This document aims to provide evidence about the existence of different patterns in equality of opportunities in academic achievement during the last fifteen years in Colombia. The outcomes selected for measuring inequality are the scores obtained on SABER 11 in math as well as reading. It is found that inequality has grown around 11% in the country, and that this trend is common for all the metropolitan areas included in the analysis. Most of the increase found comes from factors related to the school market. The fraction of unfair inequality, conditional to the circumstances included in the definition of “types”, is higher than 20% of gross inequality in 2012.
Keywords: Inequality of Opportunities, Education, Colombia JEL: I24, O15, O54
The authors acknowledge the financial support provided by the “Fondo de Investigación
Universidad del Rosario (DVG‐061) and the “Fundación para la Promoción de la Ciencia y la Tecnología”, (3227). They also acknowledge the access to data provided by ICFES and the research support of José Trujillo.
1.
Introduction
The typical pattern in Latin America for the distributions of socio‐economic indicators is
one of large inequalities in areas such as education and health. The unequal distributions
of education are worrying for a number of reasons, which include limitations on economic
growth and under‐exploitation of potential positive externalities of education. They also
limit, for an important fraction of the population, the prospects of leading a materially
comfortable life. The discussion about inequalities in education has been highly
interesting in terms of theoretical and empirical works (Ferreira and Gignoux, 2011; Paes
de Barros et al., 2009; Gamboa and Waltenberg, 2012; Wendelspiess and Soloaga, 2013).
Economists explicitly recognize that education has an important economic value (Schultz,
1963; Becker, 1964; Hanushek and Woessmann, 2007). Educational outcomes are
important means for achieving a wide array of personal goals. Indeed, educational
achievements can be good predictors not only of an individual's future earnings capacity,
but also of her access to college and of the social position she will hold in the future. There is
evidence indicating that test scores and future productivity are correlated (Currie and
Thomas, 2001). Furthermore, education is likely to be positively correlated to outcome
variables or "advantages" valued by various theories of distributive justice, and not
exclusively within the specific normative framework adopted by economists. In other
words, being educated arguably has an intrinsic value, regardless of the effect education
might have on other contemporaneous or future goals. As a consequence, the existence
of inequalities is one constraint for acquiring development. Finally, from a macroeconomic
viewpoint, education quality, as measured by test scores, seems to be a key determinant
of economic growth (Hanushek and Woessmann, 2007).
Inequality in education (achievement or access) implies that some fraction of the
population does not have the same tools for working or for having higher access to the
markets. However, it is not clear why inequality is so important and what are the main
problems related to it. Distributive justice approaches are focused on studying the causes
and implications of allowing inequality in some spaces versus in others. One of these
approaches is the equality of opportunities.
The purpose of the document is to identify how different are inequality levels in academic
achievement among the main metropolitan areas in Colombia and to characterize their
recent evolution. We use the equality of opportunities approach in order to isolate those
circumstances beyond the individual control from other aspects such as effort and luck.
We deal with metropolitan areas instead of regions because of the great differences
between the urban and rural populations in big regions compared to small and low
in to each metropolitan area. The measurement of inequality starts with the choice of the
variable. This is crucial for the policies designed to control and reduce inequality, and for
its implications for latent inequalities in other spaces. Individuals seek many outcomes
with different priority levels, but among them it is easy to find one that influences others.
Education is one life dimension that provides several aspects to the people. More
educated people can buy more goods and services, enjoy broader freedom sets and
anticipate negative income or health shocks with higher accuracy than can less educated
people. Thus, the analysis of inequality in education can be understood as a precursor to
the study of economic inequality.
This approach also allows us to form an idea about whether convergence exists in regional
inequality in academic achievement. However, our approach is not free of critics. First, our
results are only representative of the fraction of the population that finishes secondary
education. As it is well known, Latin American countries have been characterized by
considerable drop‐out levels in basic and secondary education. Thus this fraction of the
population does not benefit from the added value of education. Second, we do not have a
longer period that allows us to gain a better idea about the existence of trends
surrounding equality indicators. Additionally, for some years (2004‐2007) there is no
available information about parents' schooling, which is the most used circumstance in
the literature. Last but not least, the choice of the set of circumstances is not always free
of subjectivity. More detail in the circumstances implies more precision in the space of
opportunities faced by the individual but less variability in the samples with respect to
statistical significance and unbiasedness. As a consequence, we provide an estimation of
the lower bound of inequality, but it is a lower bound equally defined for all the
metropolitan areas.
The rest of the document is divided as follows. Section 2 briefly summarizes the equality
of opportunities approach, the previous attempts to measure it and the state of the art of
regional equality in education in Colombia. Section 3 describes the methodology and the
database used for the empirical section of the paper. Section 4 presents the results
regarding the measurement of equality of opportunities using two alternative
methodologies and their relationship with other educational indicators (gross inequality
and quality). Section 5 discusses the results and their implications for future research.
2.
The
Equality
of
Opportunities
approach
A liberal‐egalitarian theory of justice that has been widely discussed in recent years is that
of “equality of opportunity” (EOp), popularized among economists by John Roemer,
inequalities due to choices made by the individuals are acceptable (Roemer, 1998).
Different methodologies have been proposed in an attempt to translate the theory into
measuring procedures (e.g., Checchi et al., 2010; Dunnzlauf et al., 2010). Two recent
extensive surveys are available documenting the vast literature produced over the course
of the last ten years (Pignataro, 2012; Ramos and Van de Gaer, 2012).
The set of variables that are out of people's control is known in the literature as the set of
circumstances. Belonging to any specific set of circumstances is also defined as being part
of any type because the kind of opportunities faced by each one. From this definition, we
have equality of opportunities when there are no differences a priori between the
outcomes reached by one or another type. The main question with this perspective is
therefore how to define the threshold between something controllable and non‐
controllable. Many important aspects of this question remain unanswered. Some authors,
such as Pignataro (2012) and Ramos and Van de Gaer (2012), have carried out detailed
surveys about the implications of the choice of the set of circumstances and the
definitions of equality of opportunities, but the discussion remains unsolved. As an
example, scores in math should be very similar between boys and girls with equal
socioeconomic and genetic conditions2
.
Following Pignataro (2012), according to equality of opportunity, a society “should split
equally the means to reach a valuable outcome among its members; once the set of
opportunities have been equalized, which particular opportunity, the individual chooses
from those open to her, is outside the scope of justice” (p. 801). This approach calls for an
initial intervention that eliminates or compensates ex ante inequalities.
Different methodologies have been proposed attempting to translate the theory into
measuring procedures (Dunnzlauf et al. 2010; Pignataro, 2012; Ramos and Van de Gaer,
2012). The main concern is not the gross inequality itself but the part which comes from
factors beyond the individual’s control. That is, a part of inequality comes from factors
under people’s control and another part does not. Although educational systems are
designed to provide education to those who demand it, there are multiple reasons that
limit the perceived benefits of this system. This assumption relies on the definition of any
threshold that splits the set of inequality sources between those that are controllable by
the individual and those that are not. In the economic and political philosophy literature
the discussion about equality of opportunities has received a great deal of attention since
John Roemer’s approach. The problem widely discussed in the literature is the definition
of the set of circumstances. Gamboa and Waltenberg (2012) discuss the tradeoff between
an accurate definition and the statistical significance. Some of the variables used to
2 For more detail about this literature see Peragine, 1999; Peragine, 2002; Peragine, 2004a and Peragine, 2004b.
determine whether the individual has control or not are socially determined by
institutional arrangements or previous conditions.
The study of regional disparities in Colombia has been analyzed from different
perspectives (Galvis and Meisel, 2010; Bonilla, 2011; Bonilla and Galvis, 2012). There are a
few works that undertake the equality of opportunities approach on education for
Colombia. In Gamboa and Waltenberg (2012), the authors provide a measure of equality
of opportunities in academic achievement (math, reading and sciences) using the test
scores available from the Programme for International Student Assessment (PISA).
According to their work, colombian pupils belong to a more egalitarian educational system
than other Latin American countries such as Argentina and Brazil in 2006. By means of
inequality index decomposition and following the approach of Checchi et al. (2010), they
found that independent of the set of circumstances included in the analysis, Colombia
exhibits lower unfair inequalities than its counterparts. In PISA 2009, the equality level
decreases a few points and the rankings show some changes. These changes could be the
consequence of multiple factors such as sample design, internal educational, social
policies and previous interventions. In a similar approach, Gamboa (2012) studied recent
trends in unfair inequalities (inequality of opportunities) using the scores obtained by the
students on the SABER 11 test. The methodology employed in this study consists of the
decomposition of inequality indices among the fraction of inequalities explained by
circumstances such as parents' level of schooling, gender and type of school (public or
private).
One of the main concerns that emerge from the measurement of inequalities in education
from the analysis of inequality in academic achievement is the role of other variables
related to educational outcomes. In response, De Carvalho et al. (2013) propose a bi‐
dimensional index of equality of opportunities that includes the access and the
achievement dimensions as a way to be fair to those educational systems that make
efforts to improve quality, to keep students in the system and to provide facilities for
those who are vulnerable. All the studies carried out in this field state that one of the main
challenges is the choice of the threshold between what can be considered a circumstance
and what cannot, because of the role played by the student in his academic process.
Nonetheless, it is also important to establish that in the face of different findings obtained
by distinct methodologies, it is necessary to read them with the appropriate caution.
One important feature of equality of opportunities is the choice of the variable of interest.
This choice is important as a consequence of the effect that it has on other spheres. For
example, if we increase the liberty of freedom equality space, this could imply more
inequalities in the market of goods and services. In our approach, we deal with equality of
opportunities in academic achievement. As it can be noted, education is an important
on equality of access than equality of results. This debate can generate some unexpected
results. For instance, we assume that the central government designs some specific
programs oriented to reduce inequality of access by promoting a reduction in drop‐out
levels in schools. As a result, many principals might choose to reduce time‐intensive tasks
and modify grading schemes to increase promotion among academic levels. This choice
will lead to a reduction in quality or an increase in inequality of achievement, since the
degree of effort is not recognized in the same way.
The equality of opportunities approach has been studied from two perspectives: ex ante
and ex post. The former (ex ante) promotes the equality of outcomes among those people
who belong to the same type ‐the set of people who face the same set of initial
conditions‐, making their values as equal as possible. According to this approach, there is
equality of opportunity if everybody enjoys the same opportunities. In this context, any
policy oriented toward the reduction of inequality of opportunity has to be focused on
reducing inequality between individual opportunity sets. Under this perspective, it is easy
to classify Bourguignon et al. (2007), Ferreira and Gignoux (2011) and Lefranc et al. (2008).
The second perspective (ex post) seeks to compensate for the inequality generated by
different initial circumstances. This requires identification of the effort levels of
individuals, and then an emphasis on the inequalities within groups of individuals at the
same effort levels3
. There is equality of opportunity if the same outcome is achieved for
those who exert the same effort. This approach has been empirically used by Checchi et
al. (2010), Pistolesi (2009), Lefranc et al. (2009) and Gamboa and Waltenberg (2012).
The convenience of using each of the previous frameworks depends on the kind of public
policy designed to fight inequality. The ‘a priori’ approach will contain those policies that
tend to reduce outcome inequalities among opportunity sets. In contrast, the ex post
approach includes policies targeted at compensating individuals who exert the same
effort. These alternative frameworks allow us to provide a broader view of the recent
equality of opportunities literature since the publication of Roemer's 1998 and 2003
works.
Roemer’s approach calls for a fair method that does not generate adverse incentives.
Following Pignataro’s argument, “it is necessary to distribute goods to neutralize unequal
initial conditions but efficiency‐based goals must also be considered” (p. 803). This idea is
crucial for the comprehension of this field by the justice distributive theory because the
goal should not be the “leveling down” of those individuals with marked advantages.
Some advantages can be understood as circumstances, generating methodological
3 The term effort is traditionally used in this literature as a synonym for all the things under an individual’s control.
problems for the equality of opportunities approach, since the distinction between what is
a circumstance and what is not is at the core of the problem.
The individual will be responsible for her choices. The effort involved in seeking any
specific goal will be a function of her position in the type distribution. That is, when the
population is divided into n‐types, those individuals located at the same percentile of each
distribution are individuals considered to have similar effort levels. Therefore the
expected outcome should be very similar.
3.
Methodology
There are several approaches designed to quantify the degree of inequality in specific
cases such as wealth, income, land and other outcomes (Bourgignon et al. (2007a),
Dardanoni et al. (2005), Ferreira and Gignoux (2011), Lefranc et al. (2009), Paes de Barros
et al. (2009), Checchi et al. (2010)). These approaches can be classified into three different
branches: i. Regression‐based measures, characterized by using functional forms in order
to estimate some outcome as a function of a set of variables representing circumstances
and other aspects; ii. Non‐parametric approaches: in this branch, the main purpose is to
describe and characterize the entire picture of inequality and not to provide a specific
value. An important tool used in this branch is stochastic dominance analysis (Lefranc et
al. 2009); iii. Index decomposition: although it can also be located within group ii, it is
better to set this method apart because the methodology used decomposes gross
inequality into its “components” using alternative methods. On one hand, Checchi et al.
(2010) decompose gross inequality using smooth artificial distributions. On the other
hand, Oppedisano and Turati (2012) use regression analysis to estimate the concentration
index. They also decompose it through an elasticity method. The next section describes
each of the methods used.
We adopt the regression based approach throughout this document. In this field, the
framework rests on the importance of inequality indices and their properties. As Ferreira
and Gignoux (2011) mention, measurement of inequality needs some index with specific
conditions such as invariance and scale translation. Since Gini's and Theil's index
decompositions cannot be used for these reasons, the strategy adopted comes from
another method. Ferreira and Gignoux (2011) use a regression based approach in which
the outcome is explained by a series of variables. Let Yi be the score obtained by the pupil
i in a standardized test. Assume that Yi is a function of the set of circumstances she faces,
Ci, other variables under her control, xi, and an error term, e.
The variance of (Var[Y]= Var[F(C, X, e)]), is the gross inequality in educational
achievement. This variance can be expressed as follows:
Var(Y)= Var(C) + Var(X)
Gross inequality is equivalent to the sum of the inequality due to circumstances (Var(Ci)
and the other terms. In practical terms, the estimation can be carried out by using a
regression model such as the following:
Y=βC+u
For our purpose, inequality of opportunities is measured as the fraction of total variance
explained by the circumstances included in the model. Under this perspective, the R2
coefficient of a regression of the (student i in the subject j) on an X vector of
circumstances can be read as the percentage of inequality that comes from factors out of
the individual’s control, which is also a measure of inequality of opportunities.
This index has at least two advantages in practical terms. First, the advantage of the R2
coefficient is that it is easy to interpret, since 0< R2 <1. That is, R2 = 1 is a signal of high
inequality of opportunities, because it implies that the variance is completely explained by
circumstances. Second, the measurement of inequality through this index is a lower
bound of the real inequalities, since the introduction of additional circumstances into the
regression does not reduce the R2 coefficient. This is an important starting point because
most of the discussion is about the eligibility of any particular circumstance and the most
accurate definition of types. Thus the R2 coefficient does not decrease as the number of
circumstances included increases.
3.1.Data
The measurement of equality of opportunities on academic achievement at a regional
level requires merging information from different databases. The main databases used for
this task are the Saber 11 database, the form C‐600 and the demographic data from the
Statistic National Office (DANE). Since the end of the 1980s, all students in their final year
of secondary education must take the National Test Saber 11, which is administered by
the ICFES. This test is intended to obtain information about students' academic
competences and has been traditionally used by universities (mainly private ones) as a
measure of applicant quality. This test is taken twice per year in order to obtain
information about the pupils from the schools that follow different academic calendars.
Although there are three different calendars (A, B and F); calendar A is most frequently
The structure of the test includes questions about subjects such as mathematics, natural
and social sciences, reading comprehension and other optative areas. Since its creation,
there have been some changes in its structure, scale of scores, number of questions and
main objectives. These are important changes when we are dealing with time‐
comparisons. We will mention below how we proceeded with this constraint.
The database includes information from 1997 to 2012. The strategy adopted here consists
in comparing the first set of years (1997‐2003) against the last set (2008‐2012). The period
between 2004 and 2007 is not considered because during these years there is no
information available about parents' schooling, which is far the most important variable in
international literature.
In the depuration process of the database we drop out all the missing values, and we also
exclude from the analysis those students who are not in the 15‐20 year age range, in order
to reduce the dispersion in the characteristics of the population4
. Further, we restrict our
sample to schools that provide education on a full‐day or morning schedule, since in
Colombia, some schools serve different socioeconomic populations in different hours.
Also, in order to have similar and comparable statistical distributions, the scores have
been standardized using mean and standard deviation from each test. We constructed a
balanced panel with the same schools in each year (3.376), since the structure of the
student population could change considerably over the period and the availability of
information at school level is not continuously reported by all the schools. This strategy
allows us to avoid biased estimations from re‐localization, creation or modification of the
schools included in the sample.
After the depuration carried out in the database, the composition of the sample does not
change considerably. This depuration was done as a function of the set of variables
necessary to find the estimations of equality of opportunities. The criterion employed for
selecting the variables is that we are only interested in circumstances. Due to the
availability of information, parents' schooling, gender and type of school are the variables
selected as circumstances.
The assessment of regional disparities is always done with a subjective component related
to the definition of the geographical units. This case is not an exception. The analysis is
carried out using a subjective definition of geographic spaces based on the similitude of
the geographic conditions and the importance of a big city in the region. Traditionally,
most development analysis in Colombia has been collected at the regional level, but the
definition of economic region used by the National Statistics Office (DANE) is very wide
4 This is, however, an important fraction of the educational population, comprised mainly of students are workers or who already have a family.
and includes cities and small towns with very different characteristics. Additionally, these
regions do not have a unique government that allows us to assess their performance. In
this document, we opt for the use of a metropolitan area approach. The advantage of this
approach lies in the similarity in the living conditions faced by the students in each area
and the influence of a big city on the small cities located around it.
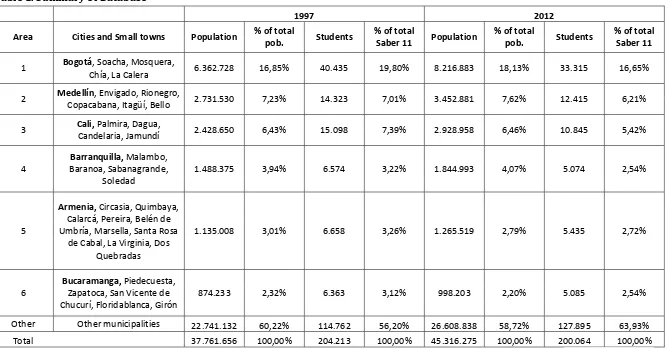
Each area was defined according to the cities where economic development has been
more stable during the last decade. As we can see in Table 1, the structure of each area is
composed of a big capital and a set of small towns surrounding it. There are 6 main
metropolitan areas (Bogotá, Medellín, Cali, Barranquilla, Armenia and Bucaramanga) that
are studied in this document. Although the definition of each area or the number of areas
can be discretional and subjective, we will show that the inclusion or exclusion of any
small city does not produce an important change in the estimations.
Table 1 summarizes the structure of the database in terms of geographic composition and
its importance with respect to total population. We only show a few years (initial and
final) in order to provide a gross description of how the student population changed
during this period over the sample of schools.
During this period, the two most‐populated areas (Bogotá and Medellín) increased their
total population with respect to the other areas, but there is not a positive increase in
terms of student population and total enrollment in the last year of mandatory education.
This fact is the result of multiple factors. First, the demographic change exhibited during
the 1980s and 1990s was more evident in the big cities where the demand for children
decreased as a result of the opportunity cost of having children for more educated
families. Second, there was a considerable change in the supply of education provided by
the private sector. Two important and frequent facts were the creation of new models of
schools and the re‐localization out of the cities. The combination of these factors has
implications for the evolution of the opportunities available for all the students and other
unobserved factors. In order to reduce the bias coming from unobserved factors, we
chose a balanced sample of schools. This strategy does not avoid all problems but it allows
us to compare the same set of schools across time.
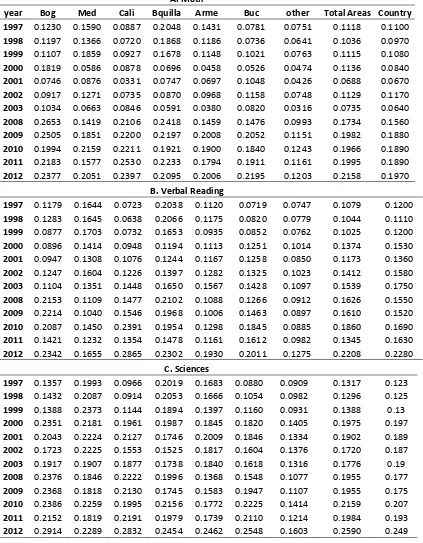
Once we have described the database, we proceed to study the evolution of quality
measured by average scores in Saber 11. The average performance is considered only in
relative terms (Figure 1). That is, we are interested in seeing how far the scores are from
each other. Our period is very short for making inferences about long run trends. Since,
but we make a standardization of the scores, we are able to provide some comments
about the scores' evolution; however, this is not the core of the problem. The relative
performance observed in each area changes over time and over each subject. In 1997,
performed worse. For that year, the rankings are similar in math, verbal and reading
scores. Although it is common in the literature to work only with math and reading, we
also include sciences in order to check whether there are considerable differences. At the
end of the period, the differences among areas have been reduced and it is easy to see
that there is a change in the rankings. Bogotá obtained the highest average score in two of
the three subjects and Cali improved its position. One interesting fact is that the set of
municipalities belonging to the category “Other” underperformed compared to the
national average and its performance is decreasing over time.
4.
Results
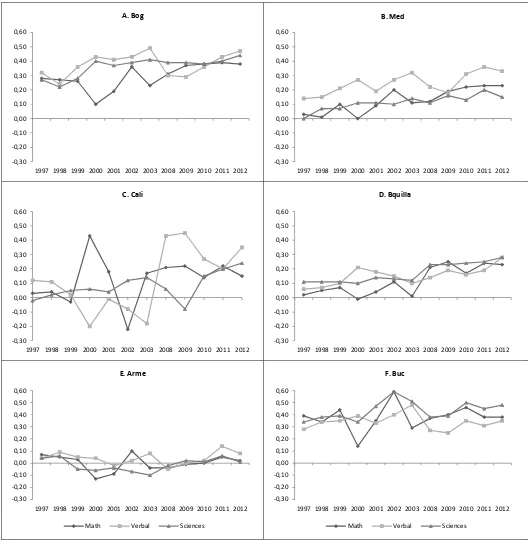
The analysis is carried out for two sub‐periods. As we can see in Figure 2, before the year
2000, there were similar and very stable dispersion levels among regions in the three
subjects. However, it is interesting to note that Bogotá, which is the most populated
metropolitan area, does not have the highest inequality levels. Bogotá is the biggest
receiver of migrants (forced and unforced) from the rest of the country.
Bucaramanga and Cali exhibit important differences with respect to other areas in terms
of inequality. In the first decade of the twenty‐first century, more oscillations are found
for these areas. In particular, Cali showed strong fluctuations with respect to similar
developed areas (Bogotá and Medellín) that are similar to the economic cycle. After the
drug war of the last decade of the twentieth century, cities such as Medellín and Cali
suffered from a decrease in the expected value of education. It is found that there is an
increase in gross inequality through the decade mainly in math and sciences. These
subjects are more related to the use of scholarly inputs and technology than verbal or
reading skills. Verbal learning requires other inputs, such as time with parents or books.
These latter subjects do not exhibit change over the period.
It is not clear how effective it is to reduce the heterogeneity of the student population. For
those who are in favor of tracking policies, it is better to have small courses with fewer
differences in the performance achieved by the students. But for those who are against
these policies, the main outcome of these types of interventions is discrimination against
the subset of students who are in the low‐track courses. As a consequence it is not
possible to affirm that heterogeneity is positive or negative for the entire educational
system.
In this part of the document, we provide an estimate of the level of inequality of
opportunities by using two alternative methods. The first is based on Ferreira’s approach,
and the second is done by following the decomposition of the concentration index
account the importance of the factors involved in its evolution. The evolution of inequality
of opportunities in academic achievement is summarized in the Table 2. The set of
variables used in the definition of the circumstances that are beyond the individual’s
control were: gender, father's and mother's level of schooling, size of the city and type of
school (calendar and management, private or public). This small set of variables provides a
good description about the type of circumstances which affect pupils5
.
The set of variables used as circumstances is crucial for the interpretation of the results.
More variables imply a better definition of the kind of life the individual lives, but at the
same time this set reduces the precision and robustness of the results. Our findings are
therefore conditional to this set of variables. It is possible that by including additional
variables we could get a more detailed description of the “type” of the students, but this
strategy does not always provide additional information since the variables already
included explain an important fraction of the scores. Since the methodology adopted by
Ferreira and Gignoux (2011) starts from the fraction of the gross inequality that is
explained by the set of circumstances, the results can be read in percentage terms.
There is a common feature in the size of inequality of opportunities (IOp) for the three
subjects: a decrease from 1997 to 2003 and a jump to a higher value in 2008 accompanied
by a subsequent reduction (See the Appendix A.1). During this period, Colombia faced at
least two important changes in terms of educational policy. First, some strategies were
implemented to improve student retention in order to prevent enrollment in guerrilla and
paramilitary groups. Second, a new contract scheme was designed for teachers in the
public sector. It is also important to mention that the changes included in the test might
also explain the differences. Before 2000, the test included more emphasis on knowledge
than on competences. Thus the effect of preparatory courses on achievement could be
smaller in the years following 2000.
To follow, since the set of circumstances can be divided into household and school factors,
the relative importance of each one has been estimated. The fraction of inequality that
comes from school factors grew during the period from 27% in 1997 to 40% in 2011 for
math (38% to 48% in reading and 26% to 37% in sciences). Most of these increments are a
consequence of the private education system's capability of adapting to changes in
resources and teaching strategies into the private education. For example, the constraints
faced by the public sector in its negotiations with labor unions such as FECODE (Federación
5
One of the most questionable variables is the type of school. The main justification for its inclusion is the impossibility of choice of type of school for most of pupils, even in the most developed cities.
Colombiana de Educadores). In regional terms, this trend is very similar at both the
metropolitan and state levels (See Appendix A.2. and A.3)6
.
In general terms, equality of opportunities has deteriorated over the period. Most of this
trend took place at the end of the period. The size of the change is so evident that while
in 1997 about 11% out of the total inequality was explained by circumstances, in 2012 this
figure rose to 22% at the national level in math and reading (13% to 26% in sciences). The
most important observation is that gross inequality has tended to decrease, which implies
that among the set of variables that explain the differences in academic achievement, the
relative importance of those related to circumstances beyond the control of the individual
increased (See Appendix A.6.). The evolution among metropolitan areas and subjects is
diverse, and some show higher increases in equality than others.
At the national level, the indicator of unfair inequalities ranges from 11% to 19,7% in
math, the subject with small change. Sciences and reading vary from 12,3% and 12% in
1997 to 24,9% and 22,8% in 2012. It is not clear what explains these differences, but it is
important to take it into account since most international studies about academic
achievement only deal with math. The set of maps that show the change in EOp from
1997 to 2012 summarize these facts. The number of departments with the highest
category of inequality increases regardless of the subject employed as outcome.
As a way to check the robustness of the results, we carry out a simple strategy consisting
of adding or subtracting one municipality to each area. The results of this strategy are
summarized in the Appendix A.7. As it can be noted, the previous findings are highly
stable because there are no cases where the variation will be more than 1%. These results
suggest that the importance of circumstances might be similar in all the metropolitan
areas. Then, we provide a brief description of the evolution of the inequality for each area:
Bogotá
In spite of its stable trend over the period, it has the highest fluctuation of gross
inequality with respect to the other areas. At the end of the period, Bogotá
remains the most unequal area after Bucaramanga and Barranquilla. The level of
inequality of opportunities rose during this period faster than in other regions,
obtaining its highest value in 2008. This feature is accompanied by the fact that
average performance is considerably high although the structure of the population
is very diverse.
6 Although this measurement it is not comparable at a state level, we also calculate EOP for all the states. Results are shown in Appendix A.4, and the maps in the Appendix A.5.
Medellín
This metropolitan area was below the national average in terms of gross inequality
in mathematics. This privileged position changed with time, as gross inequality
increased during the first years of the simple period. At the end of the period, the
inequality level was similar to that of the capital of the country. The evolution of
inequality of opportunities is part of a rising trend but as of 2009 was changing
more slowly than other areas. One important aspect of this region is that lower
inequality is accompanied by lower performance. This is the conjunction of two
adverse factors is not always desirable in educational policy. Medellín has
improved its performance in other subjects as a result of multiple efforts to link
several institutions, and now this gap with other regions has disappeared.
Cali
This is the metropolitan area with highest gross inequality during the first four
years, far above the national average. Additionally, Cali and Bucaramanga are
characterized by considerable fluctuations represented in the lowest and highest
inequality levels. At the end of the period, its gross inequality level decreased to
that of second place in the regional rankings. When this feature is compared with
the inequality of opportunities achieved using the Ferreira and Gignoux method,
we find different conclusions. Cali obtains first place in inequality of opportunities
as a result of multiple factors commonly latent in economies after a crisis. The
relative performance of its students is variable with respect to other regions, but in
some cases these differences are not significant in statistical terms (they obtain the
highest average in 2000 and the lowest in 2010).
Barranquilla
While this area is not characterized by oscillating, behavior, it is the most
deteriorated region according to its gross inequality on mathematics achievement.
Its relative position changed from last place (most equal) to second place. What is
most important to state is the evolution of unfair inequalities over this decade. It is
important to mention that while the comparisons are carried out with respect to
other regions, the metropolitan area labeled as “Other” includes a considerable
proportion of the population included in the national average. Its performance on
mathematics rose during the period but no so fast as to improve its relative
performance with respect to other areas analyzed.
Armenia
This is a small region in terms of economic activity but is the biggest in
geographical size of the regions selected in this study. However, most of the
economy is based on the same production. As a result, this region shows small
fluctuations with respect to the national average and the other metropolitan areas.
It is the only region which is located under the national average during the course
of the decade in terms of gross inequality. However, the evolution of inequality of
opportunities is similar to that exhibited the other regions, and performance is
lower with respect to other areas.
Bucaramanga
This region is located in second place in terms of gross inequality in 2002, with a
rising trend toward the end of the period. In contrast, the area moved from the
highest unfair inequality in 2001 to the lowest inequality. In general performance,
Bucaramanga and surroundings are characterized by outstanding performance in
mathematics, even above other more developed regions such as Bogotá and
Medellín.
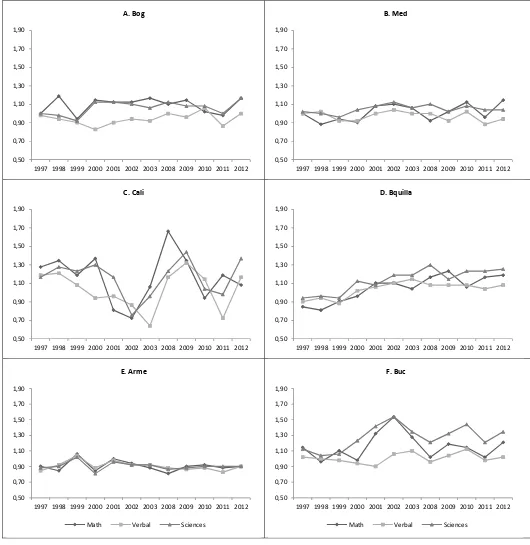
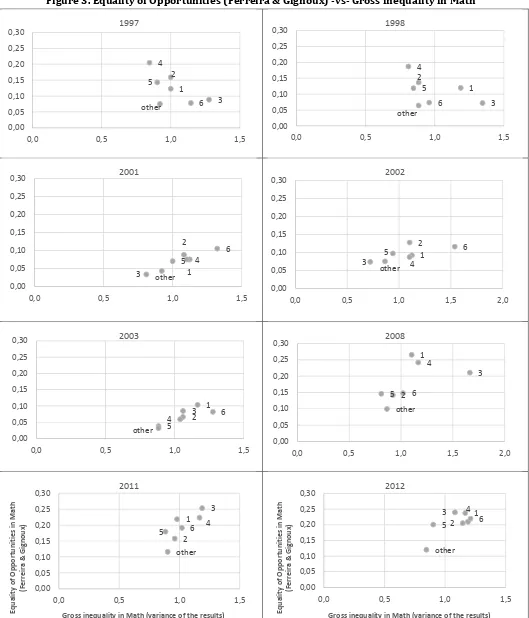
As a complementary way to show the relationship between the two types of inequality
studied over the document, we plot a scatter for a selected sample of years that allows us
to check for correlations between the two types. The results seem to suggest a positive
association between them beginning in 2001 (Figure 3). Regions such as Bucaramanga (in
2001‐2003) and Cali (2008) are located far from the group in the right‐upper side of the
figures. That is, these are regions with higher values in gross as well as unfair inequalities.
Since the methodology employed defines the inequality of opportunities as a fraction of
gross inequality, the values found are more disperse among regions in the first years.
However, at the end of the period the “distances” among them tend to disappear,
excluding the region labeled as “Other”.
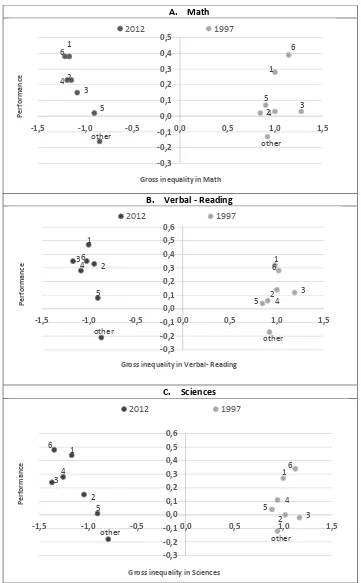
When two different indicators such as performance and equity are taken jointly, the
relationship seems not to be robust. Many authors suggest that increases in quality
measured by performance on standardized tests imply changes in equality, but at least for
the case of Colombia we do not find evidence of this hypothesis (See Figure 4).
The previous graph shows the relationship between average performance in each subject
at a metropolitan level and gross inequality per subject. We compare 1997 (right hand)
and 2012 (left hand) and find two interesting facts. On the one hand, the average
performance in math and sciences, but not verbal scores, is very similar. In this subject,
there is more convergence in almost all the regions over the period. On the other hand,
them are under the national average, which could be a consequence of the size of the
control area (Other).
These results are very interesting due to the implications for regional development and
future quality of life. The challenge for regional governments is finding the most efficient
way to reduce unfair inequalities, leveling the playing field for all the social groups and
increasing the chances of a better future.
In order to obtain a more detailed picture of this phenomenon, the total index of
inequality was decomposed between factors related to household and schools. In almost
all the regions – with the exception of Armenia ‐ in 1997 the home‐related circumstances
explain a larger fraction of the total inequality than the school‐related circumstances. This
difference is more pronounced in Cali than in other places, as the unfair inequality
indicator explained by the education of the parents is 8% in mathematics, while 0,8% is
explained by the school’s characteristics in all the subjects (in reading and sciences 6,4%
and 9% is explained by the home issues, respectively). This may be occurring due to the
unique calendar and private nature of the schools of the region. Nevertheless, Armenia is
the only place where the inequality derives from the scholarship effects, although in 2012
this ceases to occur in all subjects.
In 1997, Barranquilla presents the greatest total inequality in all the regions. In
mathematics, this city surpasses Bucaramanga, the less unequal region in that proof, by
12,2%. During this period the difference between the inequality among all the regions and
in every subject became more pronounced. This is true in total inequality as well as in the
fractions explained by the home‐related and school‐related factors. By the end of the
period, these fractions tended to be more similar.
At the end of the period, we obtain that the household factors continue to explain the
larger part of the inequality7, although the school‐related factors have a major
participation at the beginning of the sample. This suggests that the increase in the levels
of inequality in the last years is due to scholarship factors. Also, the household‐related
factors have a similar behavior for every subject, where Bogotá is the most unequal city
with 16,2% and Armenia the least unequal (12%) in all the knowledge areas. Although no
area presents a higher level of inequality than the average of all the regions, the
increasing trend is evident in each of these. At the beginning, Barranquilla was the region
with the greatest inequality although, it has kept its rate constant over the entire sample
(20,5% to 21% in 15 years). On the contrary, Bogotá doubled its level by 2012, with a
growth of 12% in the mathematics test (7,8% explained by the household‐related
characteristics and 4,2% by the school‐related issues). However, there are many
differences between the knowledge areas and it is not possible to affirm which region is
more or less unequal in all the subjects. For example, Cali has the greatest inequality in
mathematics but in reading it has less inequality (24% and 17%, respectively).
We also decomposed EOp for all the states. Although this measure at state level is not
comparable with that of metropolitan areas level, it is important to note the differences in
levels of inequality and its decomposition between departments (state). Contrary to the
finding in the analysis at the metropolitan level, there are departments where the only
inequality is explained by characteristics related to households. Most of these are part of
the Orinoco and Amazon regions, which often have the lowest educational provision in
the country. However, among these same departments differences in inequality levels are
evident. Guainía reaches a 32% level of inequality in the mathematics test at the end of
the period, while Guaviare displays the least amount of inequality, 3,9%, for the same test.
This indicates that there is significant heterogeneity in levels of parental education. In
contrast, at the school level there are no differences, possibly due to low educational
supply in these regions. In addition, we observe that there are large differences between
knowledge tests during the study period. The most extreme case is still Guainía, whose
math test is the most unequal in the whole period. It also turns out to be one of the
regions with lower inequality in 2012 in reading and science. This confirms the fact that
for most of the departments for which inequality is explained solely by parental
education, there was a reduction in overall inequality at end of the period.
Finally, as in the analysis between metropolitan areas, at the departmental level we find
that the decomposition of inequality follows the same pattern: the levels of inequality
have increased in most departments and this increase is mainly due to the characteristics
of the schools. These results allow us to highlight the dual structure of the provision of
basic education. Private schools can react faster to changes in demand preferences or
technical change than public ones. Thus it is possible that most of the inequalities come
from the institutional arrangements and parental preferences toward education.
5.
Discussion
We provide new evidence about the evolution of recent inequalities in academic
achievements at a regional level. Given that economic development is very unequal across
the country, we undertake a different and subjective division. In our approach, we choose
six metropolitan areas surrounding the highest and more developed cities. The most
in all the metropolitan areas. In some cases, such as Bogotá and Cali, the increase in
inequality was higher than 100% during this period. Although the choice of the set of
circumstances is always questionable, it is clear that in the case of this document a lower
bound of the inequality has been obtained. The available set of explanations is wide and
ranges from institutional to educational factors. From the institutional point of view,
income inequalities have encouraged the segmentation of educational markets to such a
level that the choice of school is used in some cases for locating socioeconomic segment.
Private schools can be seen as “clubs” or means to strengthen “social networks”. As a
result, the incidence of students with highly educated parents in public schools decreased
monotonically, generating higher differences in the quality of educational services
between students from low income households and those from middle and high income
families. In addition, most of the external investments and benefits of economic growth
have been located in a few cities that can capitalize on their public programs.
On the educational side, the freedom of private schools to manage their inputs (teachers,
laboratories, schedules, information and communication technologies) allow them to react
faster to market changes, but at the same time, they also employ parental commitment to
achieve their goals. It is clear that high income is correlated with attendance of private
schools in countries such as Colombia, but this is not a choice in some medium and small
cities. The explanation is that in these cities, the absence of competition among public
schools does not give them an incentive to increase inequality of opportunities. For this
reason, the set of explanatory variables includes parents, schooling, type of schools and
size of the city. It is important to state that we are not saying that private schools are
better than public schools. What we can say is that revealed preferences by parents are
incorporated more quickly into the production function of private than public schools. The
analysis of the relative importance of each circumstance on the size of inequality of
opportunities is out of the scope of this study and is one aspect that deserves future
research.
There is not enough evidence to provide policy recommendations designed for reducing
these unfair inequalities, but it is clear that a set of national and local policies are
necessary. From the national point of view it is necessary to reduce demand barriers and
to promote competition among schools using teacher policies focused on encouraging
their initiatives and rewarding their achievements. This strategy could reduce the
consequences of the inertial behavior of public schools. The structure of the public supply
of education might be more flexible in terms of student capabilities and interest. Some
exceptional students should have access to more specific tools that it can be offered by
private as well other public institutions.
The local authorities also play an important role in this crucial task. The first step is to
increase the expected value of education for all the agents involved (principals, teachers,
parents and students). Second, the use of public resources to incentivize performance
among those who face higher income barriers is one way to level the playing field. A
revision into the scheme of payments could be modified in order to promote higher effort
and continuous training for teachers from public schools. It is clear that inequalities are
common in areas such as education, but the main concern in the Colombian case is the
widening of the gap.
6.
References
Becker, G. S. (1964). “Human capital”. New York: Columbia University Press.
Bonilla, Leonardo. (2011). “Diferencias Regionales en la Distribución del Ingreso”. Revista Sociedad y Economía.
Bonilla, Leonardo and Galvis, Luis A. (2012). “Desigualdades regionales en el nivel educativo de los profesores en Colombia”. Revista de Economía Institucional, 14(26), pp. 223‐240.
Bourguignon, F., Ferreira, F. H. and Menendez, M. (2007). “ Inequality of opportunities in Brasil”. Review of Income and Wealth 53(4): 585–618.
Bourguignon, F., Ferreira, F. and Walton, M. (2007a). "Equity, efficiency and inequality traps: a esearch agenda", Journal of Economic Inequality, 5, 235‐256.
Checchi, D., Peragine, V. and Serlenga, L. (2010). “Fair and Unfair Income Inequalities in Europe”. IZA Discussion Paper No. 5025.
Currie, J. and Thomas, D. (2001). “Early Test Scores, Socioeconomic Status, School Quality and Future Outcomes”. Research in Labor Economics 20, 103‐132.
Dardanoni, V. G.; Fields, J.; Roemer and Sanchez, M. (2005).” How demanding should equality of opportunity be, and how much have we achieved?”, in S.L. Morgan, D. Grusky and G. Fields (eds). Mobility and Inequality: Frontiers of research in Sociology and Economics, Stanford University Press, Stanford.
De Carvalho, Márcia; Gamboa, L. F. and Waltenbert, F.D. (2013). “Equality of educational opportunity employing PISA data: Taking both achievement and access into account”. ECINEQ Working Paper N. 277.
Dunnzlauf, L.; Neumann, D.; Niehues, J. and Peichl, A. (2010). “Equality of opportunity and redistribution in Europe”. IZA Discussion Papers 5375, Institute for the Study of Labor (IZA). Ferreira, F. and Gignoux, J. (2011). “The Measurement Of Inequality Of Opportunity: Theory And An
Application To Latin America”. Review of Income and Wealth, 57(4) pp 622‐657.
Galvis, L.A. and Meisel, A. (2010). “Persistencia de las desigualdades Regionales en Colombia: Un análisis espacial”. Documentos de Trabajo sobre Economía regional No. 120 Enero.
Gamboa, L.F. and Waltenberg, F.D. (2012). “Inequality of opportunity for educational achievement in Latin America: Evidence from PISA 2006–2009”. Economics of Education Review, Volume 31, Issue 5, October 2012, Pages 694‐708.
Gamboa, L. F. (2012). “Análisis de la evolución de la igualdad de oportunidades en educación media, en una perspectiva internacional”. El caso de Colombia. En Estudios sobre la Calidad de la Educación en Colombia, ICFES, Noviembre pp.1‐43
Gamboa, L.; García, A. and Otero, J. (2010). “Statistical inference for testing Gini coefficients: An application for Colombia”. Ensayos sobre Política Económica. 28 (62) pp. 226‐238.
Hanushek, E. and Woessmann, L. (2007). “The Role of Education Quality in Economic Growth”. World Bank Policy Research Working Paper 4122.
Kakwani, N. C. (1980). “Income Inequality and Poverty: Methods of Estimation and Policy Applications”. New York: Oxford University Press.
Kuznets, Simon. (1955). “Economic Growth and Income Inequality”. The American Economic
Review, Vol. 45, No. 1, pp. 1‐28.
Lefranc, A.; Pistolesi, N. and Trannoy, A. (2008). “Inequality of opportunities vs. inequality of outcomes: are western societies all alike?” Review of Income and Wealth 54(4): 513–546. Lefranc, A.; Pistolesi, N. and Trannoy, A. (2009). "Equality of opportunity and luck: Deffinitions and
testable conditions, with an application to income in France", Journal of Public Economics, vol. 93(11‐12), 1189‐1207.
Oppedisano V. and G. Turati. (2012). “What Are the Causes of Educational Inequality and its Evolution over Time?”. Evidence from PISA. Education Economics, Vol. 22(1).
Paes de Barros, R.; Ferreira, F.; Molinas, J. and Saavedra, J. (2009). “Measuring Inequality of Opportunity in Latin America and the Caribean”, The World Bank, Washington DC.
Peragine, V. (1999). “The distribution and redistribution of opportunity”. Journal of Economic Surveys 13, 37‐69.
Peragine, V. (2002). “Opportunity egalitarianism and income inequality”. Mathematical Social Sciences 44, 45‐64.
Peragine, V. (2004a). “Ranking income distributions according to equality of opportunity”. Journal of Economic Inequality 2, 11‐30.
Peragine, V. (2004b). “Measuring and implementing equality of opportunity for income”. Social Choice and Welfare 22, 187‐210.
Pignataro, G. (2012). “Equality of opportunity: policy and measurement paradigms”. Journal of Economic Surveys. 26 (5), 800‐834. doi: 10.1111/j.1467‐6419.2011.00679.x.
Pistolesi, N. (2009). “Inequality of opportunity in the land of opportunities, 1968.2001”. Journal of Economic Inequality, vol. 7, issue 4, pp 411‐433
Profamilia, (2010). “Fecundidad” En: Profamilia, Encuesta Nacional de Demografía y Salud – ENDS, 108‐126.
Rey, Sergio. (2004). “Spatial Analysis of Regional Income Inequality”, en Michael F. Goodchild y Donald G. Janelle, editores, Spatially Integrated Social Science: Examples in Best Practice. Oxford University Press, Oxford.
Roemer, J. (1998). “Equality of opportunity”. Cambridge, MA: Harvard University Press.
Roemer, J.; Aaberge, R.; Colombino, U.; Fritzell, J.; Jenkins, S.; Lefranc, A.; Marx, I.; Page, M.; Pommer, E. and Ruiz‐Castillo, J. (2003). "To what extent do fiscal regimes equalize opportunities for income acquisition among citizens?" Journal of Public Economics, Elsevier, vol. 87(3‐4), pages 539‐565, March.
Schultz, T.W. (1963). “The economic value of education”. New York, USA. Columbia University Press.
Tables
and
Figures
Table1.SummaryofDatabase
1997 2012
Area Cities and Small towns Population % of total
pob. Students
% of total
Saber 11 Population
% of total
pob. Students
% of total Saber 11
1 Bogotá, Soacha, Mosquera,
Chía, La Calera 6.362.728 16,85% 40.435 19,80% 8.216.883 18,13% 33.315 16,65%
2 Medellín, Envigado, Rionegro,
Copacabana, Itagüí, Bello 2.731.530 7,23% 14.323 7,01% 3.452.881 7,62% 12.415 6,21%
3 Cali, Palmira, Dagua,
Candelaria, Jamundí 2.428.650 6,43% 15.098 7,39% 2.928.958 6,46% 10.845 5,42%
4
Barranquilla, Malambo, Baranoa, Sabanagrande,
Soledad
1.488.375 3,94% 6.574 3,22% 1.844.993 4,07% 5.074 2,54%
5
Armenia, Circasia, Quimbaya, Calarcá, Pereira, Belén de Umbría, Marsella, Santa Rosa
de Cabal, La Virginia, Dos Quebradas
1.135.008 3,01% 6.658 3,26% 1.265.519 2,79% 5.435 2,72%
6
Bucaramanga, Piedecuesta, Zapatoca, San Vicente de Chucurí, Floridablanca, Girón
874.233 2,32% 6.363 3,12% 998.203 2,20% 5.085 2,54%
Other Other municipalities 22.741.132 60,22% 114.762 56,20% 26.608.838 58,72% 127.895 63,93%
Total 37.761.656 100,00% 204.213 100,00% 45.316.275 100,00% 200.064 100,00%
[image:24.792.77.745.137.486.2]