www.econo.unlp.edu.ar/depeco
Globalisation and Inequality. The Case of Argentina
Ricardo Bebczuk y Leonardo Gasparini1 Documento de Trabajo Nro. 32
Julio 2001
1
Globalisation and Inequality The Case of Argentina
*1. Introduction
Between the 1930s and the 1970s the integration of Argentina to the world economy was rather limited. In the 1990s, after some transitory and weak attempts at opening in the seventies and eighties, the authorities pursued a number of policy measures which, along with changes in the international environment, greatly increased the degree of trade and financial integration. In a few years, Argentina, formerly a typical closed economy, became a member of the global economy.
Externally oriented reforms were complemented and often reinforced by a number of domestic measures. Most markets were deregulated and many state-owned firms were privatised. Perhaps the most important complement to external opening was macroeconomic stabilisation. Inflation was controlled after decades of instability and a brief period of hyperinflation.
The combination of macroeconomic stability, drastic reduction of the state interference in the economy and integration to the global economy resulted in a GDP growth of around 50% during the decade. In contrast to these favourable results, the nineties were also characterised by two worrying economic phenomena: the explosive growth of inequality and unemployment. The Gini coefficient increased from 44.2 in 1992 to 50.1 in 1998, while the unemployment rate augmented almost 10 points in only a few years. Never before the Argentine economy enjoyed such a high income level as in the nineties, but at the same time, it has not experimented such high inequality and unemployment levels, either. Even though the structural transformation and increased globalisation of the economy seem to have created the basis for long-term growth, it is possible that they have impacted in a negative way over many sectors of the population.
The central objective of this paper is to study the links between changes in Argentina’s integration to the world economy and the growth of income inequality and poverty . To that aim, both phenomena are described and the links relating them are analysed. The article does not deepen into the analysis of some particular cause, and it does not provide concluding evidence of alternative hypothesis. Its contribution consists in presenting in a systematic way different explanations of the development of inequality in Argentina and in evaluating their relative importance in the light of the economic theory and the available empirical evidence. The paper concludes that the increasing integration to the global economy was very likely a significant determinant of the inequality jump in the nineties. Two are the main channels that link globalisation to inequality. The first one operates through sector reallocations. Being Argentina a country relatively abundant in natural resources and skilled labour, trade liberalisation implied
*
a shift towards production and employment in sectors that use those factors more intensively, and in turn an increase in the relative return to natural resources and a widening of the wage gap between the skilled and the unskilled workers. The available evidence shows however that this story explains only a small part of the observed change in the income distribution. Globalisation can affect inequality through a second channel. The fall in the price of capital and the introduction of new skilled labour intensive technologies, both likely consequences of the greater integration of Argentina to the world markets, implied an increase in the intensity of use of skilled labour in all the productive sectors, and hence an increase in the skill premium. This effect seems to be a more significant source of increasing income disparities.
Globalisation is not the only factor behind the increase in inequality in the nineties. The decrease of labour unions power, a social environment more permeable to accept wage differentials, the fall in the minimum wage, the increase in unemployment, the increase of the relative size of the poorest families, and the increase in the dispersion of pensions payments also contributed to increasing income inequality in Argentina to unprecedented levels. Fortunately, not all factors played an inequality-increasing role. The severe macroeconomic crises and the hyperinflation that dramatically affected income distribution in the late-eighties were not present in the nineties. Fiscal and social policies did not have a very active role in alleviating the effects of increasing poverty and inequality. Actually, inequality and poverty trends are basically unchanged when government transfers (cash and in-kind) are included in family income.
Although there seems to be links between globalisation and inequality, opposing to integration and new technology incorporation is not a reasonable policy option, since economic growth is related to the capability of inserting the country in the global economy and of increasing the productivity through the absorption of new technologies. The Argentine successful growth story in most of the nineties is itself an example of this assertion. Two policy options remain: in the short-run the extension of the social safety net seems inevitable. This calls for more resources but also, and perhaps especially, for a more efficient use of public funds. In the medium and long run a sizeable increase in the supply of skilled labour through formal education and training can help to reduce the wage gap between the skilled and the unskilled. The rest of the work is ordered in the following way. In section 2 the main transformations occurred in the Argentine economy during the last three decades are reviewed, with particular accent in the changes related to globalisation: the opening of trade of goods and services, the reception of direct foreign investment and the absorption of technology. Section 3 presents the evolution of inequality, poverty, and aggregate welfare in Argentina. Part of the literature on labour inequality is concentrated on the analysis of the wage gap between skilled and unskilled workers. Section 3 also gives evidence about this gap for the Argentinean case. Section 4 constitutes the core of the work. It presents alternative explanations for the growth in inequality, with particular emphasis in the ones related to globalisation. Section 5 concludes with an evaluation of the main results and some policy lessons.
This section summarises the main changes that took place in the Argentine economy during the last three decades, particularly in the last 10 years, characterised by deep structural internal changes as well as changes in the degree of integration with the rest of the world. Table 2.1, at the end of the paper, reproduces the main economic variables for the 1970-1999 period. The objective of this review is to present the economic scene for the distributive changes outlined in the Introduction and documented in the following section.
The first part describes the Argentine economic experience since the 70s and the economic and institutional factors that led to the ongoing integration process with the rest of the world. In the second part, the causes and challenges posed by this process beginning in the 90s are described. The third and last part tackle in a greater detail the quantitative and qualitative effects over the endowment and accumulation of productive factors, the goods markets, the services markets, the transfer of technology, and the migration flows.
2.1. An overview of the Argentine economy, 1970-1999
Several stages in the Argentine economic development can be distinguished:
(i) Between 1945 and 1975 the country was involved in an import substitution process, conceived for promoting industrialisation based in national production. The government took over the provision of public utilities and the production in industries that were considered strategic, as iron, oil, and petrochemical products. At the same time, it established strong regulations and an intricate scheme of taxes and subsidies over the private activity. Some controlover the application of public and private banks’ deposits and the imposition of trade barriers were part of the widespread state intervention during this period.
(ii) The failure of this development strategy determined a radical change between 1976 and 1982 towards a policy of commercial and financial openness, although the state did not give up the economic activities under its direct management.
(iii) After the 1980 financial crisis and the 1982 external debt crisis, between 1983 and 1990 the government withdrew the previous reforms and there was a failed attempt at promoting industrial activity through fiscal instruments. The budget deterioration and the inflationary spiral, which started in 1975, led to the hyperinflationary episodes of 1989 and 1990.
(iv) The social consensus around the need of eliminating inflation and returning to the growth path after the stagnation of the two previous decades was crystallised in 1991 with some structural reforms that included a renewed fiscal and monetary order, massive privatisations, commercial and financial opening, and deregulation of the private activity. The inflation rate fell to international levels and the per capita income raised by more than 50% over the decade. On the other hand, social problems worsened because of the growth of unemployment and inequality.
privileged the redistribution towards wage earners and generated strong pressures over the fiscal accounts. The military government instrumented since 1976 a program intended to reduce the inflation rate througha quick commercial liberalisation and a scheme of small and decreasing devaluations. The deregulation of the financial system and the removal of capital controls encouraged the external indebtedness of the private and public sectors. The combination of internal factors (insolvency of local producers of exportable goods, deficient supervision and regulation of the financial system) and external ones (rise in the international interest rate since the late 70s) produced a financial collapse that led the government to assume a great part of the private external debt and to finance the banking system rescue through the inflationary tax. As in other developing countries, the adverse internal and external shocks generated serious difficulties to make the debt services, which caused the exclusion of the country of the voluntary international credit market until 1991.
The economic situation continued to be disappointing after the democratic restoration in 1983. Despite reversing the external opening and deregulation measures of the previous administration, prices continued their rising path, together with the fiscal deficit (that averaged an annual 5.5% in 1983-1989). A heterodox anti-inflationary plan, the Austral Plan, enjoyed a temporary success between 1985 and 1987, but it did not prevent inflationfrom returning with unusual virulence in 1988. Several incentive programs for capital intensive industries and for sectors with chronic problems (sugar, tobacco) - financed through tax benefits, subsidised public utilities prices, and preferential credit rates - were carried out. While the annual estimated cost of these subsidies was high (between 1% and 2% of the GDP), the results were not successful at all, as a consequence of the deficient design and supervision of the beneficiaries.1 Trade protectionism amplified the distortions generated by the governmental
intervention. Being inflation the policymakers’ top priority, the conformation of a coherent development plan was not a crucial goal at the time. According to a well-known Argentine economist, Argentina was “ socialism without a plan and capitalism without a market”.
Since the 90s Argentina experienced remarkable changes in its macro and microeconomic structure. Towards 1989 the country was immerse in a deep crisis characterised by galloping inflation and productive recession, together with a distorting state intervention in the financial system, the public utilities, and other various activity branches. The climate of uncertainty and recession gave birth to a solid social consensus concerning the need of putting an end to inflation as a precondition for any subsequent development strategy. After some failed attempts, the peronist administration initiated in 1989 managed to stop the inflationary process in 1991, through the pegging of the exchange rate and a program of fiscal austerity. The first measure was directed at stopping the price inertia, because prices used to be adjusted according to the rate of devaluation.2 Budget discipline was aimed at controlling the monetary
emission that financed the fiscal deficit –the main cause of the inflationary race. Obviously, both instruments were intimately related: the credible fixing of the exchange parity required a
1
See Porto (1991).
2
severe budget management, otherwise the monetary financing would have eroded Central Bank reserves that were necessary to achieve the exchange target. The ambitious Convertibility Plan, launched at the beginning of 1991, imposed by law the prohibition to finance the government and banking system through the expansion of the monetary base. Any increase in the monetary base should be backed up by an increase in the international reserves of the Central Bank.
The confidence induced by the plan, both inside and outside the country, favoured a marked productive reactivation. The remonetisation of residents and the inflow of foreign capitals contributed to the revitalisation of the financial system and the expansion of the aggregate expenditure via banking credit. The control of tax evasion and the increase of the tax base, together with the privatisations, made possible the increase of public resources and the achievement of fiscal equilibrium, in spite of the increase of public expenditure. The massive capital inflows more than compensated the trade and current account deficits, contributing to the sustainability of the fixed exchange rate of one peso for one dollar.
Summing up, the plan enjoyed immediate success not only regarding inflation, but also with respect to growth. The annual rate of inflation, that had reached a maximum of 5000% in 1989, decreased to 3.8% in 1994, while the average GDP growth rate jumped to 8.2% in 1991-1994 from - 1.1% in 1980-1989. The favourable expectations and the decrease of the interest rate stimulated credit and expenditure, without generating inflationary pressures due to the high idle installed capacity and the increase in labour productivity. The fast growth of 1991-1994 was possible without a considerable increase in investment and employment. As a complement to the macroeconomic stabilisation, the government launched a series of structural reforms. Privatisations had the double purpose of raising funds for the state and of increasing the efficiency in the provision of public utilities, of disastrous functioning under the state monopoly. The decrease of utilities rates encouraged lower domestic prices, and the removal of trade barriers promoted efficiency improvements in productive units, reducing at the same time the cost of imported inputs. Another important point was the creation in March 1991 of the Mercosur, a customs union with Brazil, Uruguay and Paraguay. Concerning the financial system, the supervision and regulation of private institutions was strengthened, with high reserve and capital requirements so as to reinforce financial stability. The full opening to the international credit markets and the reform of the pensions system contributed to the deepening of capital markets, translated into a higher volume of banking credit to the private sector and new issues of stock and debt in the market (see Bebczuk (2000)). Finally, the state itself adhered to the new economic frame reducing its payroll, simplifying administrative procedures and eliminating subsidies and different regulations that represented a burden for the private sector.
their expectations, generating an important capital outflow and a significant reduction of deposits in the financial system. The trade and current account deficits since 1991, the apparent exchange rate overvaluation, the deterioration of the public accounts since the beginning of 1994 and the increase of unemployment, also since 1991, were some of the negative signals arising from the new economic scene. But it must be kept in mind that Argentina was at the time enjoying a rapid GDP growth with low inflation, and that the external and fiscal unbalances were not particularly pronounced compared to most emerging economies.
The causes of these complications are not clearly elucidated yet, but some hypotheses do offer convincing explanations. The negative trade balance was a consequence of the demand recovery, that was partially translated into greater imports: while exports grew 65% between 1991 and 1994, imports increased 413%, generating a trade deficit of U$S 4,100 millions in 1994 (it is noteworthy that in 1990, when GDP decreased 2.9%, commercial surplus reached a historical maximum of U$S 8,100 millions). The current account deficit reached U$S 11,000 millions (4.3% of the GDP) in 1994, from a level of U$S 647 millions (0.4% of GDP) in 1991. The appreciation of the peso (the real exchange rate fell 42% between 1990 and 1994) is the joint result of the fixed exchange rate regime and the price inflation of non-tradable goods as a consequence of a stronger domestic demand. The fiscal deficit observed since 1994 (an average of 1.4% of GDP in 1994-1999) was due to the growth in public expenditure, while the tax and other public receipts reached a plateau, in a partial reversion of the fiscal austerity maintained over 1991-1993. Finally, the reduction of the payrolls of the private sector, motivated by the need of productivity increases in a competitive environment), the legal rigidities of the labour market, the greater activity rate and the firings in the public sector appear to be the most evident causes of the growth in unemployment.
After the Mexican crisis, both the activity level and the financial system were rapidly recomposed since the second half of 1995, without needing to abandon the convertibility and the fixed exchange rate, strengthening this way the macroeconomic credibility of the country. Nevertheless, some previously cited weaknesses still persist: external deficit, unemployment, fiscal deficit, and wide activity level fluctuations. Being a small economy, open to commercial and financial flows and with a high and increasing external debt, the world economic conditions exacerbate, via the interest rate and the terms of trade, the macroeconomic volatility.3,4
The lack of any independentmonetary policy because of the Convertibility Law and the restrictions to fiscal policy due to the need of reaching budget equilibrium has inhibited any counter-cyclical policy measures.
Table 2.1.b displays some qualitative indicators that reflect the main changes in Argentina’s economic situation since 1970:
Table 2.1.b
3
Avila et al. (1997) present evidence for Argentina that changes in the country risk premium affect foreign capital inflows, and that these inflows have a positive effect on industrial activity.
4
Some Qualitative Indicators for Argentina, 1970-1999
Period GDP Inflatio n
External Trade Financial State Developme n t
Trend in Trend in
Growth Debt Opennes s
Openness Intervention in
Strategy Unemployme n t
Inequality
Economic Activity
1970-75 Moderate High and Stable Low Low High Import Medium Stable increasin
g
Substitution
1976-82 Moderate High and Increasing Low High High Free trade Medium Increasing increasin
g
1983-89 Low High and Increasing Low High High Subsidisation Medium Increasing increasin
g
of some domestic Industries
1990-99 High Low Increasing Relatively High Low Free trade High Increasing
High and markets
2.2. The process of international integration of the Argentine economy in the nineties
At the time of evaluating the degree of integration of Argentina to the world economy, a difference must be highlighted in terms of trade and financial openness. At the trade level, as tariff and non-tariff protection obstructed the flow of goods, Argentina clearly was a closed economy until 1990. But regarding financial policy, there were no major legislative changes in recent years for attracting international credit: in 1976 and 1977 most legal constraints on capital movements had already been removed, and the financial system had been liberalised. As a matter of fact, it was the agitated credit history of the country in the 80s and the macroeconomic and institutional instability that isolated Argentina from the international credit circuit between 1982 and 1990. The perception by foreign investors of a greater economic stability and of a greater rule of law, more than a new legal frame, stimulated capital inflows since 1991. The decrease of the country risk premium (the difference between the Argentine bond return in dollars and the U.S. Treasury bond return for the same maturity) reflects this phenomena: after reaching an average of 25 percentage points (2500 basic points) in 1988-1990, it fell to an average of 4 percentage points (400 basic points) in 1991-1994.
policy goal, generating an unprecedented consensus around the lowering of inflation at any cost. The same society that had opposed to the previous attempts of reducing the fiscal deficit and selling public enterprises was now favourably disposed to these changes.
Along with the previously described fiscal and monetary measures, the government initiated in the early 90s a program of deregulation, privatisation and trade opening. The authorities had not planned any development strategy at the moment of executing these changes. Deregulation and integration, both financial and commercial, were rapidly carried out, under the urgency of the circumstances, and there was not any gradual schedule to allow the private sector adjustment to the new circumstances. Anyway, it was thought that an economy free of distortions would be able to allocate efficiently its resources and to exploit its static and dynamic comparative advantages; the plain failure of the import substitution strategy and the promotion of domestic industries up to the early 80s, supported, by opposition, this new paradigm.5 With very few exceptions, there has not been in the 90s any subsidies for the
productive sector. In retrospect, these policies and the lack of any supporting social policies in the context of an abrupt change from a protected and regulated economy, set the ground for an increase of inequality and unemployment.
Certainly, the international financial conditions, particularly the decrease of the interest rate in the U.S., contributed to the success of the Convertibility Plan through the inflow of foreign capitals and the return of domestic capitals which had left the country in the past. Since 1991 different factors contributed to the financial reintegration of the country to the world economy. These factors, shared with other emerging economies, can be classified in pull factors
(domestic changes that made the country more attractive) and push factors (changes in developed countries that made investment in other countries attractive). Among the pull factors it can be mentioned: (i) the control of inflation, (ii) the reduction of the fiscal deficit, (iii) the privatisations and deregulations, (iv) the regularisation of the external debt through the Brady Plan of 1992, (v) the pegging of a credible exchange rate, (vi) the trade opening, (vii) the solvency and liquidity of the financial system under an adequate state regulation and supervision, and (viii) the complete absence of legal, tax and bureaucratic constraints to foreign capital movements. The main push factors include: (i) the decrease in the international interest rate at the beginning of the decade, (ii) the growing importance of institutional investors and their associated need to diversify their portfolios, and (iii) the expanded use of new communication technologies.
The access to external credit had for Argentina various positive aspects:
(i) It constituted an expansive factor of the aggregate demand in the short run. The reactivation of 1991-1994 is partially explained by foreign capital inflows.
(ii) It allowed the country to increase fixed investment without sacrificing current consumption.
5
However, these benefits have several actual and potential costs associated:
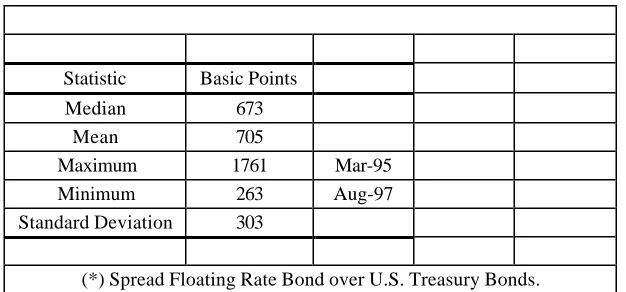
(i) The foreign investors’ expectations are volatile and not always based on the economic fundamentals of the recipient economy. The contagion among emergent economies and herding behaviour on the part of international investors constitute frequent phenomena.6
The notorious oscillations of capital flows and the country risk premium in short periods clearly supports this assertion:
6
Table 2.2
Country risk premium of the Argentine government (*) 1993-1999
Statistic Basic Points
Median 673
Mean 705
Maximum 1761 Mar-95
Minimum 263 Aug-97
Standard Deviation 303
(*) Spread Floating Rate Bond over U.S. Treasury Bonds.
(ii) The activity level in small open economies is particularly sensitive to capital inflows and outflows, generating very steep cycles.7
(iii) The increase of the external debt intensifies the financial vulnerability in the presence of external shocks to the interest rate. In the Argentine case, the total external debt has augmented from 29.9% to 51.7% of the GDP between 1991 and 1999.
(iv) The higher degree of openness amplifies the effect of variations in the terms of trade, that have shown an erratic evolution in the last decade:
Table 2.3
Terms of Trade for Argentina, 1991-1999 Index 1993=100
Year Exports Imports Terms
Price Price of Trade
Index Index
1991 95.9 105.2 91.2
1992 99.7 102.5 97.3
1993 100.0 100.0 100.0
1994 102.7 101.5 101.1
1995 108.4 107.0 101.3
1996 115.5 105.9 109.0
1997 112.0 103.4 108.3
1998 100.2 98.1 102.2
1999 89.0 92.5 96.3
Source: INDEC.
(v) In order to satisfy the expectations of international investors and consolidate the country’s external credibility the use monetary and fiscal instruments to smooth the business cycle is severely constrained.
(vi) The debt financing of fiscal unbalances elevates the external debt stock without improving the ability to repay it.
7
[image:11.612.172.439.460.618.2]It is hard to draw any definite conclusion about the net benefit of the process for Argentina. In the first place, a longer experience is required in order to make a sounder evaluation of pros and cons. Secondly, beyond the theoretical advantages of opening the economy, the final outcome depends both on domestic policies and exogenous shocks. For example, the instability associated to capital flows can be created either by the lack of a consistent fiscal policy or by international contagion unrelated to the country’s fundamental. Concerning commercial opening, the preliminary evaluation is also controversial: against its well-known long-run benefits, the reallocation of factors between sectors is likely to have some adverse effects in the short- and medium-term.
2.3. Effects of the integration of the Argentine economy to the world economy
2.3.1. Changes in factor endowments and the sources of growth
As many other developing economies, Argentina was a closed economy until the first part of the 70s. Keeping in mind that the initial conditions could have limited the economic and institutional performance of the country during the present globalisation process, this section briefly describes the main structural characteristics in the 1965-1975 decade and then reports the changes that took place in the subsequent 25 years.
Table 2.4
Some structural economic indicators. Average 1965-1975. Mean values for different regions and Argentina.
Variable World OCDE South East South Latin Argentina
Mean Asia Africa America
Per capita GDP (1985 U$S) 2,679 7,079 1,546 917 2,601 5,018
Real growth rate of GDP 2.8% 3.4% 4.7% 1.9% 2.3% 1.9%
Annual inflation rate 10.0% 6.0% 23.0% 6.0% 15.0% 31.0%
Capital/labor ratio (relative to OCDE) 0.33 1.00 0.07 0.05 0.15 0.26
Investment rate 0.16 0.29 0.18 0.10 0.16 0.17
Infrastructure index (*) 1.43 3.62 0.80 -0.50 1.51 2.59
Secondary schooling (in years) 0.57 1.29 0.61 0.15 0.51 0.66
Technolgy level (relative to OCDE) (**) 0.68 1.00 0.54 0.44 0.67 0.87
Exports/GDP 0.28 0.27 0.39 0.28 0.26 0.07
Imports/GDP 0.30 0.28 0.44 0.32 0.28 0.06
Primary exports/GDP 0.74 0.40 0.80 0.88 0.81 0.76
Contribution of agriculture to GDP 0.25 0.08 0.31 0.37 0.19 0.10
Population density (inhabitants per km2) 3.11 1.99 7.39 1.09 1.43 0.81
Area (in mill. Km2) 2.77
Population (millions) 22.3
(*) Simple average of the logarithm of the number of telephone lines per worker, kilometers of paved roads per worker and energy production per worker. (**) [per capita GDP(region)/per capita GDP(OECD)]^-0.4. See Romer (1994).
Source: Author’s calculations based on data from the World Bank.
While the proportion of primary exports with respect to total exports is consistent with the relative endowments of physical and human capital (higher than the OECD average and lower than other developing countries), the country presents export and import ratios to GDP considerably lower than the other regions, a point that would be analysed later.8
The county's performance in terms of growth and its sources is displayed in the following table:
Table 2.5
Sources of Argentine growth. As percentage
Period Average annual Inputs without adjusting by quality
growth rate Labor Capital TFP
of GDP
1940-1980 3.60 0.95 1.55 1.10
1980-1989 -1.06 0.70 0.04 -1.80
1990-1997 6.09 0.74 1.42 3.94
Source: Elías (1992) and Meloni (1999).
Several sharp differences call the attention:
(i) The growth rate in the 90s was considerably higher than in the previous decade –when it was negative - and also higher than the growth rate in 1940-1980;
8
[image:13.612.160.451.539.616.2](ii) Total factor productivity was the main cause of the contraction of the 80s and the expansion of the 90s. Changes in the degree of government intervention in the economic system, trade openness, and productive technology and efficiency are behind this different growth scenarios over time;
(iii) The weight of physical capital (relative to labour) was higher in the 90s than in the 80s. As expected, capital intensity moved inversely with its relative price: the capital/labour ratio increased 32% between 1991 and 1998, while its relative price decreased 40% in the same period.9
2.3.2. Goods market
The low import and export levels, although suggestive, can not be taken as a definitive proof of the export weakness or of the presence of distortions and trade barriers. In the long run, a country’s export performance is determined by its import needs, on the demand side, and by its export competitiveness, on the supply side.
A regression of the ratio of exports to GDP against a series of variables susceptible of capturing these effects is likely to uncover the level of theoretical exports, a prediction of the equilibrium value based on the structural characteristics of the country.10 The estimated
coefficient allows to predict the theoretical exports and to confront them with the observed ones in the period 1965-1995: in 1965-1995 the export level was on average a 7.7% of the GDP, but the country should had exported a 17.2% according to its structural determinants. In the 90s, the export coefficient jumped from 7.7% in 1990-1994 to 10.2% in 1995-1999, revealing a higher degree of openness, but still far from the theoretical level. Comparing the 80s and the 90s, an increase of exports from 6.3% to 8.9% of GDP and a significant growth of imports from 4.4% to 10.4% is observed.11
The same methodology has been used to predict the theoretical level of primary exports as a proportion of total exports (the rest corresponds to manufacturing exports) for the same sample of countries.12 Argentina’s primary exports in 1965-1995 (76.7% of the total) are
similar to the theoretical ones (75.2%). In spite of the widely spread belief that Argentina is excessively biased towards its primary exports, the econometric analysis shows that the actual export structure responds to the comparative advantage of the country in this sector.
9
See Bour and Susmel (1999).
10
The estimation (not reported but available on request) ratifies the stated hypothesis and presents a good adjustment. The included variables were population, area and latitude (negative sign) and per capita product, investment rate and infrastructure (positive sign).
11
As it will be shown below, the production of tradable goods (agriculture and industry) fell in relation to non-tradable ones (services). This process is common to most economies as they develop, though.
12
Although a good part of the explanation relies on structural determinants, the trade policy has deepened this relative isolation. Table 2.6 shows the average export and import taxes between 1967 and 1996. This period has been split into four sub-periods according to the prevailing external orientation: up to 1975, the import substitution policy had a clear bias towards trade autarchy; the military administration of 1976-1982 gave priority to outward orientation, situation that was reverted in the first stage of the democratic period (1983-1990); finally, since 1991 a renewed tendency towards openness can be identified.
Table 2.6
Import and export taxes Argentina, 1967-1996.
Period Average Export Average Import
Tax Tax
1967-1975 0.09 0.14
1976-1982 0.05 0.14
1983-1990 0.11 0.15
1991-1996 -0.04 0.12
Source: Calculations based on Gay A. (1998).
The average import tariff has been high over the whole period, with a slight decrease in the 90s. Export taxes – an instrument used to extract rents from the agricultural sector- were particularly high in 1967-1975 and in 1983-1990, becoming negative in the last sub-period. Evidently, tariffs do not seem to reflect the changes in trade orientation.13
This impression is different when quantitative restrictions and exchange controls are taken into account (see Rodríguez (1997)). Between 1983 and 1988, more than 50% of the tariff positions. Since then, and with particular strength since 1991, these restrictions were removed, surviving nowadays only a few exceptions. Regarding exchange controls, a means to offer a differential treatment to exports and imports, they were intensively used only in the early 70s and in 1983-1990.
Another structural change in the trade front was the creation of the Mercosur regional trade agreement, together with Brazil, Uruguay and Paraguay in 1991 after some partial agreements initiated in 1986. The Mercosur is a customs union, with free trade between its members and a common external tariff. The treaty is still in process of consolidation after its rather prompt implementation. Economic and diplomatic tensions have emerged recurrently, as a consequence of the loss of competitiveness of specific sectors and the persistence of some national subsidies (especially in Brazil). However, the results are, in general terms, auspicious. More than the 90% of the tariff positions have been liberalised for intra-regional trade and a similar fraction is subject to the common external tariff. The association, to which Bolivia and
13
Chile had partially adhered in recent years, has increased intra-regional trade. In the case of Argentina, the exports to Mercosur went from 7.9% of total exports in 1985 to 35.1% in 1998, while imports increased from 18.3% to 25.7%.14 Anyway, the Argentine trade exhibits
[image:16.612.107.504.181.247.2]a high degree of international geographic diversification:
Table 2.7
Export destination and import origins for Argentina in 1998 Percentage of total
MERCOSUR NAFTA European Union Rest Total
Exports 35.1 9.8 17.4 37.7 100
Imports 25.7 22.8 27.4 24.1 100
Source: Informe Económico del Ministerio de Economía y Servicios Públicos.
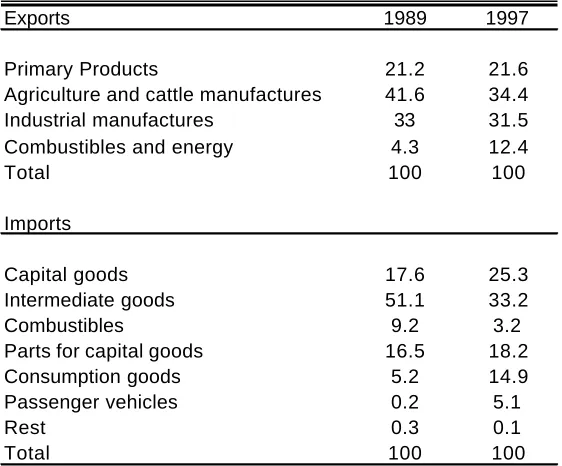
The changes in the structure of exports and imports are presented in the following table:
Table 2.8
Import and export structure in 1989 and 1997
Exports 1989 1997
Primary Products 21.2 21.6
Agriculture and cattle manufactures 41.6 34.4
Industrial manufactures 33 31.5
Combustibles and energy 4.3 12.4
Total 100 100
Imports
Capital goods 17.6 25.3
Intermediate goods 51.1 33.2
Combustibles 9.2 3.2
Parts for capital goods 16.5 18.2
Consumption goods 5.2 14.9
Passenger vehicles 0.2 5.1
Rest 0.3 0.1
Total 100 100
Source: Informe Económico del Ministerio de Economía y Servicios Públicos.
It is not easy to find, at first glance, a substantial modification in terms of specialisation in primary and industrial products from the comparison of the structure before and after the opening process. An increase in oil and energy at the expense of agricultural goods at the export level, and the growth of capital and consumption imports in detriment of intermediate goods appear as the main trends.
14
[image:16.612.166.447.332.565.2]As the country has a comparative advantage in primary goods, it is expected that capital and intermediate goods imports constitute a significant portion of total investment. The evolution of investment and its components over time is presented in the following table:
Table 2.9
Composition of fixed gross internal investment, 1970-1997. As percentage of total.
Period Gross Domestic Construction Durable equipment for production
Investment Total Domestic Foreign
1970-1975 100 60.7 39.3 29.1 10.2
1976-1982 100 62.4 37.6 24.6 13.0
1983-1990 100 65.8 34.2 26.2 8.0
1991-1997 100 53.2 46.8 16.8 30.0
Source: Martínez et al (1998).
The proportion of imported goods reached its highest levels in 1976-1982 and particularly in 1991-1997, which is coherent with the preceding observations.
2.3.3. Services markets
Up to 1990 there was virtually no international competition in the services sector. Public utilities were in hands of the state, preventing any external or domestic competition. The only sector where foreign participation was relevant was the financial sector. In May 1977, on the eve of the financial reform of June of that year, 17 of the 119 banks established in the country were of foreign origin; by the end of 1981, foreign banks ascended to 32 out of 199. While the expansion in the number of domestic banks was followed by an important contraction along the 80s, foreign-owned banks had a more permanent character, as 31 of the 181 institutions functioning in 1987 were of foreign capital.
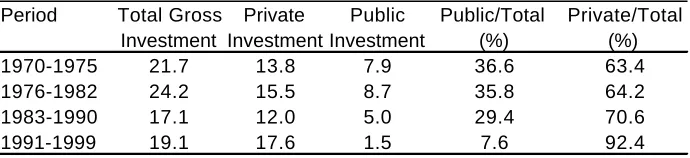
The last decade has been witness of a marked change in the services market. The state has sold public enterprises and franchised a number of public services to the private sector since 1990. By doing this, public investment displayed a drastic fall that continued the tendency registered since 1970:
Table 2.10
Public and private investment in Argentina, 1970-1999. As percentage of GDP.
Period Total Gross Private Public Public/Total Private/Total
Investment Investment Investment (%) (%)
1970-1975 21.7 13.8 7.9 36.6 63.4
1976-1982 24.2 15.5 8.7 35.8 64.2
1983-1990 17.1 12.0 5.0 29.4 70.6
1991-1999 19.1 17.6 1.5 7.6 92.4
[image:17.612.134.479.629.708.2]Almost 60% of the revenues generated by the privatisations in 1990-1998 (U$S 18,173 millions) came from foreign investors. At the same time, of the total direct foreign investment in 1992-1996, 47% was directed to the service sectors.
Table 2.11
Sector destination of foreign direct investment, 1992-1996.
Sector Millions of U$S % of total
Extractive activities 3169 16.2
Manufacturing industry 6033 30.9
Services 9140 46.8
Electricity, gas and water 4959 25.4
Communications 1059 5.4
Trade 1149 5.9
Banking 1973 10.1
Others 1176 6.0
TOTAL 19518 100
Source: Kulfas and Hecker (1998).
2.3.4. Capital markets and foreign capital participation
Another relevant measure of the integration to the world economy is the contribution of foreign saving (the current account of the balance of payments) in the financing of domestic investment. Though this variable is influenced by domestic factors that are independent of the degree of financial integration15, Argentina is, a priori, a foreign saving recipient. Not until the
90s the country went through a extended process of external indebtedness:
Table 2.12
Saving, investment and current account in Argentina, 1970-1999. As percentage of GDP.
Period Gross Investment Gross Saving Current Account Foreign Direct Investment
1970-1975 21.7 20.5 -1.2 0.3
1976-1982 24.2 24.4 0.2 0.5
1983-1990 17.1 15.8 -1.3 0.4
1991-1999 (*) 19.1 15.9 -3.2 1.6
(*) Foreign direct investment corresponds to the period 1992-1997
Source: Martínez et al (1998), Urbiztondo (1998) and Kulfas and Hecker (1998).
From a global inspection of the balance of payments and its components (not reported) it can be concluded that over the period 1992-1999: a) in spite of the fact that the country had accumulated an external deficit of 74.7 thousand million dollars, the Central Bank increased its international reserves in 19.9 thousand million, indicating that capital inflows more than compensated the financing needs; b) exports and imports, measured in current dollars, grew 88% and 75 % respectively, between 1992 and 1999; c) financial and real services explain an
15
[image:18.612.112.498.492.571.2]important part of the deficit compared to the trade balance; d) regarding the capital account, it can be observed that the non-financial private sector was the main international borrower up to 1994, with the government taking over that place since then, in a macroeconomic situation of lower growth and higher fiscal deficit.
The direct foreign investment has moved in a similar fashion. Between 1912 and 1970, direct foreign investment represented annually only the 0.5% of the GDP, going down to 0.3% in 1971-1976, to return to 0.4% in the following fifteen years. Although Argentina absorbed only 1% of the world’s direct foreign investment in 1991-1996, its volume in terms of the product has increased fourfold with respect to the 80s, reaching 1.6% of the GDP.16
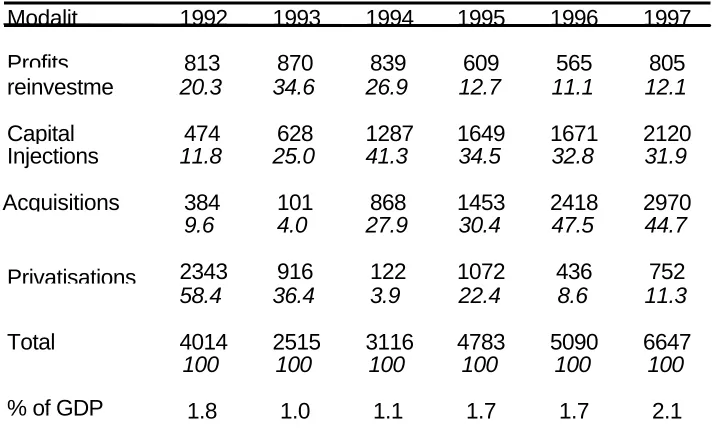
[image:19.612.127.486.321.537.2]The principal sources of these flows had been the United States (33%), Chile (10.7%), France (5.9%) and Spain (5.5%). The following table shows the different foreign investment modalities between 1992 and 1997:
Table 2.13
Modalities of foreign direct investment in Argentina. In million dollars and as percentage of the total.
Modalit 1992 1993 1994 1995 1996 1997
Profits 813 870 839 609 565 805
reinvestme 20.3 34.6 26.9 12.7 11.1 12.1
Capital 474 628 1287 1649 1671 2120
Injections 11.8 25.0 41.3 34.5 32.8 31.9
Acquisitions 384 101 868 1453 2418 2970
9.6 4.0 27.9 30.4 47.5 44.7
Privatisations 2343 916 122 1072 436 752
58.4 36.4 3.9 22.4 8.6 11.3
Total 4014 2515 3116 4783 5090 6647
100 100 100 100 100 100
% of GDP 1.8 1.0 1.1 1.7 1.7 2.1
Note: first file in million dollars; second file as percentage of the total. Source: Kulfas M. and H. Hecker (1998).
No legal restrictions explain the relatively low (yet increasing) participation of foreign capital. On the contrary, since 1976 it has been offered equal treatment to domestic and foreign capital. Besides, since 1989, foreign investment is not subject to pre-approval and its inscription in the Registro de Inversiones Extranjeras is optional; on the other hand, there are no restrictions to profit remittances and capital repatriation. Surely, the still high country risk and the numerous alternatives of international diversification explain the limited interest of foreign investors, even after the macroeconomic ordering in the 90s.
16
The stock of foreign investment in Argentina reached in 1999 63 billion dollars (23% of the GDP). Considering the 160 highest-selling manufacturing firms, the 96 multinational companies in this group generated in 1997 62.5% of the sales (36% in 1990) (see Kulfas and Hecker (1998)).
Financial integration is also low in terms of the loan interest rate available to domestic borrowers in the financial system. While the deposit rate is reasonably arbitraged, the loan rate is considerably higher than the one the international markets, with the only exception being the segment of bigger firms (see Buera and Nicolini (1998)).
2.3.5. Technological transfer
Against the expectations of its creators, the import substitution policy instrumented between 1940 and 1980 produced frustrating results in terms of technological progress. The combination of a perverse incentive scheme and scarce international competition led to an industrialisation process characterised by a strong productive inefficiency. The brief deregulatory and opening experience of 1976-1982, far from improving the situation, deteriorated the solvency of domestic firms in the presence of increased imports and domestic currency overvaluation.
The reforms of the 90s have promoted a substantial and sustainable change in productivity and technological advance. Both the absence of state intervention in the economy and the removal of barriers to international trade induced the private firms to seek the productivity gains necessary to stay in business.
Particularly, the renewed export and import dynamism allowed domestic firms to gain access to the state-of-the-art technologies from developed countries. Personal interaction and the possibility of copying and adopting these processes tends to stimulate technological advance in developing countries entering the phase of trade liberalisation.17 Katz (1999) presents some
reflections about the technological innovation process in Argentina and other Latin American countries in the 90s, pointing out the predominant role of the private sector over the state and of the adoption of foreign technologies over domestic research and development as central features.
It can not be ignored here the role played by direct foreign investment. Besides promoting improvements in the management and international marketing of domestic firms, it tends to favour the access to foreign technologies: by keeping the control over the use and benefits by the owner, direct foreign investment eliminates the usual resistance to technological transfer towards economies with a weak protection of property rights. Likewise, through the contact with providers and clients, the firms receiving foreign investment - for example, the local subsidiaries of multinational firms- generate knowledge spillovers over other domestic firms.18
17
See Pissarides (1997) for a theoretical analysis.
18
Even if, by its own nature, it is difficult to obtain quantitative information about technological transfer, we show some indicators to back up the previous hypotheses. Provided that the technology is frequently incorporated in new capital goods19
[image:21.612.205.407.340.444.2], the noticeable increase of private investment as a proportion of GDP (44% between 1983-1990 and 1991-1999, see Table 2.10) and the decrease of the average age of the capital stock, (from 8.8 years in 1989 to 5.9 years in 1996) seem to ratify what was previously stated. Imported capital goods are an important vehicle for technology transfer. As it can be observed in Table 2.9, these goods represented a 30% of total investment in 1999 from a level of 8% in 1983-1990. The intermediate and capital goods imports as proportion of total imports grew from 36% in the 80s to 45% in 1997. The favourable tariff treatment for capital imports, the real exchange rate appreciation, and the lower interest rate stimulated the acquisition of foreign equipment and inputs. Finally, a prediction consistent with the importance of trade in the technology transfer is that the productivity gap between tradable and non-tradable goods has to grow, as the following table shows:20
Table 2.14
Production and relative productivity of tradable goods.
Period Tradable Relative
Production/ Productivity
Total Tradables/
Non tradables
1967-1975 0.34 91.9
1976-1982 0.32 95.4
1983-1990 0.30 117.4
1991-1996 0.29 164.3
Source: Calculations based on Gay (1998).
2.3.6. Migrations
The Argentine workforce has been relatively immobile at an international level, both in periods of openness and isolation. Nevertheless, Argentina has received migrants from neighbouring countries such as Bolivia, Paraguay, Uruguay and Chile, especially during the cycles of domestic reactivation. Although the economic integration started in 1986 with the Mercosur, labour movements to and from Brazil had been scarce.
The only source of reliable information is the Household Permanent Survey. Arruñada and others (1999) analyse the migratory structure shown by this survey in October 1997, finding that internal migrants represent 24% of total population, while foreign migrants represent around the 8%. In particular, recent international immigrants do not reach a 1%; the majority of domestic and foreign immigrants have more than five years of residence in the country,
19
See Grossman and Helpman (1994).
20
indicating that the economic recovery of the 90s has not have a great impact over the migratory decisions, surely because of the simultaneous rise of the unemployment rate. The average instruction level of the immigrants, who are mainly employed in low-skilled jobs, is lower than that of the natives: the 20% of the immigrants has low education against 7% in the case of the natives.
3. Inequality trends in Argentina
Inequality and poverty had been consistently measured since 1974, date in which the first Household Permanent Survey (EPH) was taken in the Greater Buenos Aires. 21
However, it was only in the nineties when the survey was extended to cover all the urban population of the country. The EPH has the usual deficiencies of most household surveys in the world: non-negligible non-response, income underreporting and difficulties for capturing some income sources (e.g. capital income). In addition it only asks incomes, not expenditures or consumption, and it does no cover rural areas. Various authors have made several corrections for dealing with these problems.22
It is systematically found that the inequality and poverty trends are not modified when these adjustments are made.
Table 3.1 summarises the main statistics of inequality for the Greater Buenos Aires from 1974 to 1999.23,24 The equivalent household income of all the individuals with complete and
consistent responses is taken as argument of the inequality indexes.25
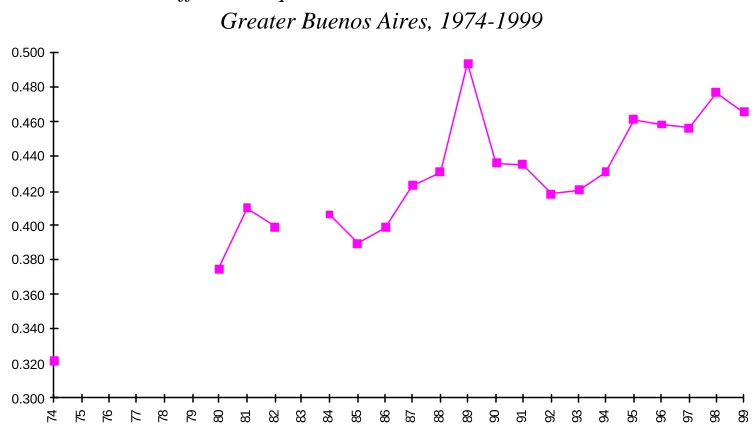
Figure 3.1 shows the Gini coefficient.
Table 3.1
Inequality measures. Equivalent household income distribution. Greater Buenos Aires, 1974-1999
21
The Greater Buenos Aires is an urban area of 12 millions inhabitants, around one third of the Argentine population.
22
Llach and Montoya (1999) and Gasparini and Sosa Escudero (2000) correct by income underreporting and non-response. Using data from the Household Expenditure Survey (ENGH) Sosa Escudero and Gasparini (2000) impute income from own-housing and Navajas (1999) calculates consumption inequality.
23
The survey covers around 11,000 individuals in that urban area.
24
As it was mentioned, the geographic covering of the EPH was extended in the nineties. The evolution of inequality for the total of the urban areas in that decade does not significantly differ from that of Greater Buenos Aires.
25
Gini Theil d10/d1
1974 34.5 0.185 8.0
1980 39.0 0.241 10.9
1981 42.7 0.308 14.1
1982 42.0 0.298 13.2
1984 42.0 0.347 14.3
1985 40.9 0.262 12.4
1986 41.7 0.289 13.0
1987 44.4 0.329 15.9
1988 44.9 0.333 17.3
1989 51.5 0.478 23.9
1990 46.1 0.370 16.1
1991 46.1 0.390 16.0
1992 44.2 0.311 14.7
1993 44.3 0.316 17.0
1994 45.7 0.346 16.4
1995 48.4 0.395 21.2
1996 48.4 0.388 20.5
1997 48.0 0.384 21.3
1998 50.1 0.415 24.3
1999 48.8 0.388 22.6
[image:23.612.115.493.408.627.2]Source: Author’s calculations based on the EPH. October waves. Note: d10/d1 is the ratio of the mean household equivalent income of the top decile over that mean for the bottom decile.
Figure 3.1
Gini coefficient. Equivalent household income distribution Greater Buenos Aires, 1974-1999
0.300 0.320 0.340 0.360 0.380 0.400 0.420 0.440 0.460 0.480 0.500
74 75 76 77 78 79 80 81 82 83 84 85 86 87 88 89 90 91 92 93 94 95 96 97 98 99
Source: Author’s calculations based on the EPH. October waves.
Inequality has been increasing for the last 25 years in Argentina.26
The periods of greater acceleration are the second half of the seventies, the last three years of the eighties, and the middle and last part of the nineties.
26
Inequality strongly increased during the second half of the seventies and the first part of the eighties, coinciding with a period of more international trade openness, suppression of civil liberties, restrictions to the action of the labour unions, and by the end of the period, macroeconomic crisis. The first part of the democratic government, started in 1983, shows relative stability in the inequality indicators. In contrast, towards the last part of the eighties income distribution worsens drastically, in association with the hyperinflationary process. The stability achieved since the implementation of the Convertibility Plan generates a reduction of inequality to levels a little higher than those of the previous period of macroeconomic stability.27
Since 1992/93 the argentine economy returns to a pattern of growing inequality to the point of reaching levels only comparable to the ones experimented during the hyperinflationary peak. Frequently the discussion over the determinants of inequality is carried out in terms of the wage gap between skilled and unskilled workers. Table 3.2 presents the real and relative wage of various socio-demographic groups in four years of relative macroeconomic stability: 1980, 1986, 1992 and 1998. The average real wage decreased strongly between 1980 and 1986, descended moderately towards 1992 and recovered in the nineties, reaching a similar level to that in 1986, but significantly lower than in 1980.
[image:24.612.96.535.524.663.2]The most interesting phenomenon of the table is the different evolution of the hourly wage income between educational groups. Between 1980 and 1992 wages fell in greater magnitude for college graduates, reducing the income gap. In contrast, between 1992 and 1998 while real hourly wages did not significantly change for workers with a high school degree or less, they substantially increased for the group of college graduates. The relative wage of college graduates, that has fallen from 2.20 to 1.85 in the eighties, recovered by the ends of the nineties reaching a level of 2.32.
Table 3.2
Real and relative wages by sociodemographic groups Greater Buenos Aires, 1980, 1986, 1992 y 1998
Hourly wages ($ 1998) Relative hourly wages
1980 1986 1992 1998 1980 1986 1992 1998
Total 15.16 9.80 8.25 9.75 Gender
Males 15.82 10.39 8.42 9.99 1.04 1.05 1.02 1.02 Females 13.93 8.86 7.97 9.39 0.92 0.90 0.96 0.96 Education
Without a high school degree 12.03 7.79 6.39 6.57 0.74 0.77 0.80 0.75 High School graduates 20.25 11.93 9.55 10.12 1.24 1.19 1.20 1.16 College graduates 35.97 20.97 14.77 20.26 2.20 2.08 1.85 2.32 Age
18 to 30 12.82 8.10 7.02 7.40 0.84 0.82 0.85 0.76 31 to 50 16.33 11.08 9.13 10.69 1.07 1.13 1.11 1.10 51 to 65 16.76 9.70 8.25 11.66 1.10 0.99 1.00 1.19
inequality started to increase in the mid-seventies (Altimir, 1986 and Gasparini, 1999a).
27
Source: Author’s calculations based on the EPH. October waves. Wages deflated by the CPI. The relative wage of a given group is obtained by dividing the real wage of that group by a weighted average of all real
wages, where the weights are the mean of the labour shares of the group over the four years considered.
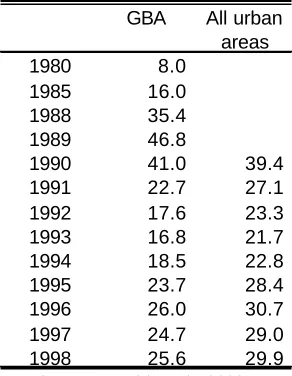
Broadly, poverty has evolved similarly to inequality. Table 3.3 shows the evolution of the headcount ratio for Greater Buenos Aires and all the urban areas covered by the EPH. Considering other poverty indexes does not modify the main conclusions.28
Poverty increased strongly in the eighties, particularly during the hyperinflationary peak. The macroeconomic stabilisation implied a decrease to levels comparable to those of the previous stability period.29
[image:25.612.233.379.278.466.2]From 1993 to 1996 poverty increased significantly, and then it has descended slightly. Poverty is now situated in a level only exceeded during the hyperinflationary crises.
Table 3.3
Poverty headcount ratio Argentina, 1980-1998
GBA All urban
areas 1980 8.0
1985 16.0 1988 35.4 1989 46.8
1990 41.0 39.4 1991 22.7 27.1 1992 17.6 23.3 1993 16.8 21.7 1994 18.5 22.8 1995 23.7 28.4 1996 26.0 30.7 1997 24.7 29.0 1998 25.6 29.9
Source: World Bank (2000)
An economy’s performance should be evaluated in terms of both its average income and the dispersion in the distribution. The aggregate welfare functions allow this joint evaluation. Figure 3.2 presents the evolution of various aggregate welfare indicators that capture alternative value judgements. After deep fluctuations, the evaluation that all the considered functions make in 1994 is similar to the one of 1980. Incontrast, the dispersion of opinions is magnified in the following years. While for some functions 1998 was a better year than 1994, the evaluation is the opposite for others. This disparity in the evaluations has no precedents in the recent Argentine economic history and responds to the combined phenomenon of a mild economic growth and a substantial increase in inequality in the second half of the nineties.
28
See the official statistics of the INDEC, World Bank (2000) and Llach and Montoya (1999).
29
Figure 3.2 Welfare indicators Argentina, 1980-1998
60 65 70 75 80 85 90 95 100 105 110
1980 1982 1985 1986 1987 1988 1989 1990 1991 1992 1993 1994 1995 1996 1997 1998
Wb Ws y Wa(1) Wk Wa(2)
Note: Abbreviated welfare functions: Wb=Bentham, Ws=Sen,
Wk=Kakwani and Wa(ε)=Atkinson
Source: Gasparini and Sosa Escudero (2000).
4. Explaining inequality
Explaining inequality changes is not an easy task since most economic factors affect income distribution. Take for instance the substantial increase in inequality in the nineties. There are multiple hypotheses concerning the determinants of that increase, mainly as a result of the temporal coincidence with the numerous economic transformations detailed in section 2. During the last decade the economy experimented a strong trade liberalisation process, globalisation promoted technological changes, almost all the state-owned firms were privatised, most markets were deregulated, the pension system and the labour laws were reformed, new macroeconomic policies helped to control inflation, unemployment grew to unprecedented rates, the labour unions lost power, the population’s average educational level increased substantially, the proportion of young people and women in the labour market increased, the tax system and the size and structure of public expenditure were modified, the political scene changed and possibly, many social norms and behaviours were altered. All these factors, many of them surely related, could have affected income inequality in the nineties.
4.1. A characterisation of inequality changes
[image:27.612.182.429.289.419.2]A first step in the study of the causes of inequality changes is to quantify the effect of various direct determinants, through a decomposition analysis. The literature has identified various potentially relevant factors: changes in the returns to education, to experience and unobservable factors, changes in the wage gap between genders, changes in the occupational choices of individuals and transformation in the age and educational structure of the population. Gasparini, Marchionni and Sosa Escudero (2000) present evidence about the importance of most of these factors. Table 4.1 reproduces the results for the equivalent household labour income distribution in Greater Buenos Aires.30
Table 4.1
Microeconometric decomposition of changes in the Gini coefficient Equivalent household labour income distribution
Greater Buenos Aires, 1986, 1992, 1998
86-92 92-98 86-98
Observed 0.7 8.5 9.2
Effects
1. Returns to education -0.9 2.8 1.8
2. Gender wage gap 0.1 -0.1 0.0
3. Returns to experience -0.5 0.7 0.3
4. Unobservables 0.4 1.7 2.1
5. Hours of work 1.0 1.8 3.0
6. Participation -0.1 0.1 -0.1
7. Education 0.2 0.5 0.9
8. Rest -0.3 1.5 1.1
Source: Gasparini, Marchionni and Sosa Escudero (2000).
The figures in the table should be read in the following way. Between 1992 and 1998 the Gini coefficient of the distribution of equivalent household labour income increased 8.5 points. The value 2.8 in the second column for the returns to education implies, roughly, that the change in the Gini would have been 2.8 points if only the returns to education had changed between 1992 and 1998. Given that 2.8 is a positive and large number compared to the rest of the column, we conclude that changes in the returns to education explain a very significant part of the increase in income inequality in period 1992-1998. Changes in the returns to unobservable factors and in hours of work have also a significant role.31
The former effect probably captures an increase in the return to unobservable skills, while the latter reflects the dramatic reduction in the hours worked by unskilled individuals.
It is interesting to notice the minor relevance of other factors. For instance, although the wage gap between men and women has been substantially reduced, the gender effect on household income inequality is negligible, basically due to the fact that working women are evenly distributed along the household income distribution.
30
Gasparini (1999b), González Rozada and Menéndez (1999) and Altimir et al. (2000) study the changes in inequality through different types of decompositions, reaching similar conclusions.
31
One of the most notorious economic facts in the nineties was the drastic increase in the unemployment rate. This rate climbed from 6% at the beginning of the decade to nearly 14% at the end of 1999, reaching a peak of 18.4% in May, 1995.32
This significant rise was in great part accompanied by a decrease in the inactivity rate of roughly the same magnitude, implying that the sum of unemployed and inactive individuals did not vary very much in the period.33
Consequently, in spite of the explosive increase in the unemployment rate, the proportion of people with zero income remained relatively constant during the period, implying a small labour participation effect over inequality (see row 6 in Table 4.1).
The following story seems to have characterised the labour market in the nineties. The rationalisation of the public administration, the privatisation of firms, the technological changes, and the adjustment in some sectors due to trade liberalisation implied a loss of numerous jobs. However, at the same time the Argentine economy grew at high rates, creating employment. An additional phenomenon shows up in the labour story of the nineties. A very significant number of individuals, particularly women and young people, entered the labour market. This substantial fall in the inactivity rate had an essential role in explaining the increase in unemployment.
Which factors operated with particular force in the nineties so as to increase the returns to formal education, experience and unobservable skills, and reduce the hours worked by the unskilled? The following four subsections are aimed to discuss these points based on a simple supply and demand model of the labour market, incorporating two potentially relevant institutional factors: the labour unions and the minimum wage.
4.2. Labour supply
The two phenomena that have characterised labour supply over the last decades all over the world - the increase in the participation of women and skilled workers - had also taken place in Argentina. Women represented the 32.5% of the economically active population of Greater Buenos Aires in 1980. This value grew to 40.5% in 1998. Table 4.2 shows the shares of three educational groups in total labour and in employment. In less than two decades college graduates increased their participation in almost 7 points in total labour and 16 points in employment. The increase was particularly strong during the 1992-1998 period. The share of unskilled individuals has substantially shrunk in total labour supply and employment.34 These
changes are the result of both individual decisions as a response of persistent high returns to education and government efforts to expand education.35
32
These values correspond to all urban areas covered by the EPH.
33
This aggregate behaviour is repeated, in general, for all the educational groups.
34 The available evidence shows that neither the foreign nor the domestic migrations seemed to have altered the labour supply in a significant way during this period in the Greater Buenos Aires. See Arruñada, Basch and Escanes (1999).
35
Table 4.2
Share of total labour and employment by educational group
Share Change in share
Educational group 1980 1986 1992 1998 80-86 86-92 92-98 80-98
Total labour
Without a high school degree 71.4 66.7 61.5 56.1 -4.7 -5.2 -5.4 -15.3
High School graduates 21.5 23.7 27.5 30.0 2.2 3.7 2.5 8.5
College graduates 7.1 9.6 11.0 13.9 2.4 1.5 2.9 6.8
Employment
Without a high school degree 63.0 55.2 45.8 38.2 -7.8 -9.4 -7.6 -24.8
High School graduates 25.2 29.9 32.6 34.1 4.7 2.7 1.5 8.8
College graduates 11.8 14.9 21.6 27.8 3.1 6.7 6.2 16.0
Source: Author’s calculations based on the EPH. October waves.
Assuming stable labour demand, the labour supply shifts displayed in the previous table would imply a fall in the relative wage of the more educated workers. Table 3.2 shows wage movements between 1980 and 1992 that are consistent with this story. In contrast, between 1992 and 1998 the relative wage of the more educated significantly increased to unprecedented levels. In a model of demand and supply equilibrium, the explanation to this phenomenon requires dramatic changes in the relative demand of skilled workers in the nineties, both with respect to labour supply changes in the nineties and with respect to labour demand changes in the eighties.
4.3. Labour demand
There are several reasons that can account for the increase in the relative demand of skilled work. The most usual ones in the literature are: (i) increases in the relative demand of skilled labour intensive goods, (ii) the opening to the international trade with countries that are relatively abundant in unskilled labour, (iii) technological change biased towards skilled labour, and (iv) reduction in the price of capital, usually considered as p-complement of the skilled labour. The first two factors work through changes in the sector composition of employment (between-sector shifts). The remaining two imply a relative increase in the use of skilled labour within each sector (within-sector shifts). There is evidence that both between and within sector shifts had taken place in Argentina.
4.3.1. Between-sector shifts
Table 4.3 shows important reallocations of employment among sectors, particularly during the last 12 years. The most significant changes are the decrease in the industry share and the