The disease surden morbidity assessment: a validation study
151
0
0
Texto completo
(2)
(3)
(4) ESCUELA DE DOCTORADO Servicio de Estudios Oficiales de Posgrado. DILIGENCIA DE DEPÓSITO DE TESIS.. IRENE GEURTJE MARIA WIJERS Comprobado que el expediente académico de D./Dª ____________________________________________ reúne los requisitos exigidos para la presentación de la Tesis, de acuerdo a la normativa vigente, y habiendo presentado la misma en formato: soporte electrónico. impreso en papel, para el depósito de la. 144 misma, en el Servicio de Estudios Oficiales de Posgrado, con el nº de páginas: __________ se procede, con fecha de hoy a registrar el depósito de la tesis.. 2017 27 de ___________________ abril Alcalá de Henares a _____ de 20_____. Emilia Rivero Antúnez Fdo. El Funcionario.
(5) PROGRAMA DE DOCTORADO EN CIENCIAS DE LA SALUD. THE DISEASE BURDEN MORBIDITY ASSESSMENT: A VALIDATION STUDY Tesis doctoral presentada por: Irene Geurtje Maria Wijers. Directora: Dra. Maria João Forjaz, Instituto de Salud Carlos III. Co-director: Dr. Manuel Franco Tejero, Universidad de Alcalá. Alcalá de Henares, 2017.
(6)
(7)
(8) I. ACKNOWLEDGEMENTS. This project would not have been possible without the support of many people. Many, many thanks to João Forjaz, who taught me how to write articles, revised my work over and over again and corrected every tiny little detail. Who always was optimistic when I was pessimistic and always supported me in every decision I took. And who even ‘mentored’ me when I became a mum for the first and second time during this project, with her broad experience as a mum of two. Many thanks also to Manuel Franco, for being my co-director and revising my thesis. Special thanks also to Alba Ayala, the best statistician I know, who conducted the Rasch analysis and was always there for me when I had questions. Thanks to Ángel Rodríguez and Vicente Rodríguez for giving me the opportunity to work with the ELES-PS database.. Finally, thanks to my husband, who has been cooking, cleaning and taking our son to the park without complaining, just to let me work on my thesis. And very special thanks to Nina, ‘the little secretary’, who spent the first four months of her life on my chest, in the baby carrier, while I was finishing this work..
(9) II. RESUMEN. INTRODUCCIÓN El envejecimiento de la población es un proceso que está teniendo lugar en todo el mundo. Una de las consecuencias es el aumento de la prevalencia de los problemas crónicos de salud y, por lo tanto, también la coexistencia de ellas, denominada comorbilidad o multimorbilidad. La multimorbilidad es un problema de salud muy frecuente en todos los grupos de edad, y especialmente en las personas mayores. Es un factor pronóstico importante, con efectos negativos sobre la mortalidad, los resultados quirúrgicos, las complicaciones postoperatorias y la duración de la estancia hospitalaria, y un efecto directo e independiente sobre la discapacidad y la calidad de vida. Existen diferentes instrumentos para evaluar la multimorbilidad; la elección del instrumento depende del contexto del estudio y los resultados de interés. La escala Disease Burden Morbidity Assessment (DBMA) es un cuestionario de autovaloración en el que los participantes clasifican la carga de la enfermedad causada por una serie de problemas crónicos de salud. Fue diseñada y validada para asociarse con resultados centrados en el paciente. Sin embargo, todavía no se había realizado una validación siguiendo una metodología psicométrica o clinimétrica.. OBJECTIVOS Los objetivos de esta tesis fueron validar la DBMA de acuerdo con la Teoría Clásica de los Test (TCT) (Estudio 1), evaluar la validez de grupos conocidos, la validez convergente y la validez predictiva (Estudio 2) y realizar un análisis Rasch de la escala (Estudio 3)..
(10) III. MÉTODOS Se utilizaron datos del Estudio Longitudinal Envejecer en España, Estudio Piloto (ELESPS), en la que se incluyeron adultos no institucionalizados mayores de 50 años residentes en España. En el Estudio 1 y 2, se utilizaron submuestras de personas de 65 años o más. El cuestionario CAPI del estudio ELES-PS incluyó la DBMA. En esta escala, que consiste en una lista de 21 problemas crónicos de salud, se pregunta a los participantes para cada problema crónico de salud si lo tienen y, en caso afirmativo, hasta qué punto interfiere con su vida cotidiana en una escala de 1 (nada) a 5 (mucho). La puntuación total, obtenida sumando las puntuaciones de todos los problemas crónicos de salud presentes, proporciona una medida de la carga de la enfermedad autopercibida.. En el primer estudio, se analizaron las propiedades psicométricas de la escala (viabilidad, aceptabilidad, asunciones escalares, fiabilidad y validez de constructo). La dimensionalidad fue estudiada con un análisis factorial exploratorio. En el Estudio 2, se evaluó la validez de grupos conocidos para sexo y grupos de edad (<75 años frente a ≥75 años). Para la validez convergente, se utilizó un modelo de regresión lineal multivariante para evaluar las diferencias de los resultados de la DBMA en función de la edad y el sexo, la salud autopercibida, la función física, la calidad de vida, el equilibrio afectivo y el uso de recursos sanitarios. Para la validez predictiva se estudió la asociación con la mortalidad a cuatro años utilizando un modelo de Cox y curvas de Kaplan-Meier. En el análisis Rasch se analizaron los siguientes atributos métricos de una manera iterativa: ajuste al modelo Rasch, unidimensionalidad, fiabilidad, funcionamiento diferencial de los ítems (DIF), independencia local de los ítems y adecuación de la escala de respuesta. Posteriormente, se evaluó la validez de constructo de la medida lineal proporcionada por el análisis Rasch..
(11) IV. RESULTADOS En el análisis TCT, la viabilidad y la aceptabilidad fueron satisfactorias, salvo efectos suelo grandes (> 50%) y una distribución asimética (skewness=1,8). La correlación ítem-total corregida osciló entre 0,10-0,49, el índice de homogeneidad de los ítems fue de 0,09 y el alfa de Cronbach de 0,72. La DBMA mostró una correlación fuerte con la escala de función física (r = -0,56) y la salud autopercibida (r = -0,56), y moderada con la depresión (r = 0,41) y la calidad de vida (r = -0,41). El análisis factorial exploratorio extrajo 5 factores, explicando el 44% de la varianza.. En el análisis de grupos conocidos en el Estudio 2 se encontraron para las mujeres prevalencias de enfermedades mayores y también mayor carga de enfermedad por enfermedad presente. Las mismas diferencias fueron halladas para los grupos de edad, pero fueron menos pronunciadas. En la regresión multivariante, el sexo, la salud autopercibida, la función física, la calidad de vida, el equilibrio afectivo y la utilización recursos sanitarios se asociaron significativamente con la DBMA. El modelo de Cox mostró un hazard ratio de 1,07 y las curvas de Kaplan-Meier mostraron tasas de supervivencia más bajas en los participantes con mayores puntuaciones en la DBMA.. En el análisis Rasch, se recodificaron las escalas de respuesta para lograr un ajuste adecuado al modelo de Rasch. La fiabilidad (person separation index) fue baja. La escala mostró unidimensionalidad y no se encontró dependencia local de respuestas ni DIF relevante. El análisis de precisión relativa mostró que la medida lineal discriminaba mejor entre los grupos de edad que la puntuación original, pero para el sexo no se encontró ninguna diferencia..
(12) V. CONCLUSIONES A pesar de algunas limitaciones como la fiabilidad por debajo de los esperado y un efecto suelo alto, se encontró apoyo para la validez de la DBMA. Es un cuestionario autoinformado que repite la misma pregunta para diferentes problemas crónicos de salud, lo que la hace particularmente aplicable en las personas mayores, ya que es fácil de entender y se puede rellenar en un corto período de tiempo. En nuestra sociedad envejecida, con un número de personas mayores con multimorbilidad cada vez mayor, la DBMA puede ser una herramienta útil que ayuda a comprender mejor y mejorar la atención de las personas mayores con múltiples enfermedades crónicas..
(13) VI. SUMMARY. INTRODUCTION Population aging is a process that is taking place all over the world. One of the consequences is the increase in the prevalence of chronic conditions, and therefore also the co-existence of them, so-called comorbidity or multimorbidity. Multimorbidity is a highly prevalent health problem among all age groups, and especially in the elderly. It is an important prognostic factor, with well-described negative effects on mortality, surgical outcome, postoperative complications, and hospital length of stay, and a direct and independent effect on disability and quality of life. Different instruments exist to assess multimorbidity, and the choice of instrument depends on the study context and outcomes of interest. The Disease Burden Morbidity Assessment (DBMA) is a self-report questionnaire in which participants rate the disease burden caused by a number of medical conditions. It was designed and validated to be associated with patient-centered outcomes. However, a validation following psychometric or clinimetric methodology had not been performed yet.. OBJECTIVES The objectives of this thesis were to validate the DBMA according to the Classical Test Theory(CTT) (Study 1), to assess known-groups, convergent and predictive validity (Study 2) and to perform a Rasch analysis of the scale (Study 3)..
(14) VII. METHODS Data were used from the Ageing in Spain Longitudinal Study, Pilot Survey (ELES-PS), which included community-dwelling adults aged 50 years or more living in Spain. In Study 1 and 2, subsamples of persons aged 65 years and older were used. The CAPI questionnaire of the ELES-PS included the DBMA. In this scale, consisting of a list of 21 chronic medical conditions, participants are asked for every condition whether they have it and if so, to what extent it interferes with their everyday life on a scale from 1 (not at all) tot 5 (a lot). The total score, obtained by summing the scores given to the different conditions, provides a measure of self-reported disease burden.. In the first study, psychometric properties of the scale (feasibility, acceptability, scaling assumptions, reliability and construct validity) were analyzed. Dimensionality was assessed through an exploratory factor analysis. In Study 2, known-groups validity for sex and age groups (< 75 years vs. ≥75 years) was assessed. For convergent validity, a multivariate linear regression model was used to evaluate differences in DBMA scores as a function of age and sex, perceived health, physical functioning, quality of life, affect balance and utilization outcomes. For predictive validity, the association with four-year mortality was assessed using a Cox model and Kaplan-Meier curves. In the Rasch analysis, test of fit to the Rasch model, reliability, unidimensionality, response dependency, category structure, scale targeting and differential item functioning (DIF) were studied in an iterative way. Construct validity of the linear measure provided by the Rasch analysis was subsequently assessed..
(15) VIII. RESULTS In the CTT analysis, satisfactory feasibility and acceptability were found, except for large floor effects (>50%) as well as a skewed distribution (skewness=1.8). Item-total corrected correlation ranged 0.10-0.49, item homogeneity index was 0.09, and Cronbach’s alpha was 0.72. Disease burden correlated strongly with physical functioning (r= -0.56) and perceived health (r=-0.56), and moderately with depression (r= 0.41) and quality of life (r=-0.41). Exploratory factor analysis extracted 5 factors, explaining 44% of the variance.. The known-groups analysis in Study 2 found higher disease prevalences and also higher disease burden per present condition for women. The same differences were found for age groups but less pronounced. In the multivariate regression, sex, perceived health, physical functioning, quality of life, affect balance and primary/outpatient care utilization were significantly associated with the DBMA. The Cox model displayed a hazard ratio of 1.07 and the Kaplan-Meier curves showed lower survival rates in participants with higher DBMA scores.. In the Rasch analysis, items needed to be rescored by collapsing response categories to achieve an adequate fit to the Rasch model. Reliability (person separation index) was low. The scale was unidimensional and neither response dependency nor relevant DIF were found. Relative precision analysis showed that the linear measure discriminated better between age groups than the original raw score, but for sex no difference was found..
(16) IX. CONCLUSIONS Despite some limitations such as reliability below the expected and high floor effects, support was found for the validity of the DBMA. It is a self-reported questionnaire that repeats the same question for different conditions, which makes it particularly applicable in older populations, since it is easy to understand and can be filled out in a short amount of time. In our ageing society, with increasing numbers of older people with multimorbidity, the DBMA can be applied to better understand and improve care for older persons with multiple chronic conditions..
(17) X. LIST OF ABBREVIATIONS. AUC. Area under the curve. CAPI. Computer-assisted personal interviewing. CCI. Charlson Comorbidity Index. CDS. Chronic Disease Score. CES-D. Center for Epidemiologic Studies Depression Scale. CI. Confidence interval. CIE. Change-in-estimate. CIRS. Cumulative Illness Rating Scale. CIRS-G. Cumulative Illness Rating Scale geriatrics. COPD. Chronic obstructive pulmonary disease. CTT. Classical Test Theory. DBMA. Disease Burden Morbidity Assessment. DBMA-Fv. Disease Burden Morbidity Assessment French version. DIF. Differential item functioning. ECM. Elixhauser´s Comorbidity Measure. ELES-PS. Estudio Longitudinal Envejecer en España, pilot study. HR. Hazard ratio. ICC. Intraclass correlation coefficient. ICD. International Classification of Diseases. IRT. Item Response Theory. ITCC. Item-total corrected correlation. LOS. Length of stay. OR. Odds ratio. OSA. Obstructive sleep apnea. PCA. Principal component analysis.
(18) XI PSI. Person separation index. PWI. Personal Wellbeing Index. QoL. Quality of life. ROC. Receiver operating characteristic. SCQ. Self-Administered Comorbidity Questionnaire. SD. Standard deviation. SE. Standard error. SPANE. Scale of Positive and Negative Experience.
(19) XII. CONTENTS 1.. Introduction .................................................................................................................................................. 1 1.1.. Population ageing .............................................................................................................................. 1. 1.2.. Co- and multimorbidity................................................................................................................... 2. 1.3.. Multimorbidity as a prognostic factor ...................................................................................... 3. 1.3.1.. Multimorbidity and mortality............................................................................................. 3. 1.3.2.. Multimorbidity and surgical outcomes........................................................................... 3. 1.3.3.. Multimorbidity and hospital length of stay................................................................... 4. 1.3.4.. Multimorbidity and healthcare utilization costs ........................................................ 5. 1.3.5.. Multimorbidity and disability ............................................................................................. 5. 1.3.6.. Multimorbidity and quality of life ..................................................................................... 6. 1.4.. Co- and multimorbidity measurement tools .......................................................................... 7. 1.4.1.. The Charlson Comorbidity Index ...................................................................................... 7. 1.4.2.. Elixhauser´s Comorbidity Measure .................................................................................. 9. 1.4.3.. The Cumulative Illness Rating Scale .............................................................................. 10. 1.4.4.. The Self-administered Comorbidity Questionnaire ................................................ 11. 1.5.. The Disease Burden Morbidity Assessment ......................................................................... 13. 1.6.. Scale validation: Classical Test Theory and Rasch analysis ........................................... 17. 1.6.1.. Scale validation ....................................................................................................................... 17. 1.6.2.. Classical Test Theory............................................................................................................ 17. 1.6.3.. Rasch analysis ......................................................................................................................... 19. 2.. Objectives ..................................................................................................................................................... 21. 3.. Methods......................................................................................................................................................... 23 3.1.. Study design and sample .............................................................................................................. 23. 3.2.. Assessments ...................................................................................................................................... 25. 3.2.1.. The DBMA ................................................................................................................................. 25. 3.2.2. Other assessments ........................................................................................................................ 27 3.3.. 4.. Statistical analyses .......................................................................................................................... 32. 3.3.1.. Statistical analysis in Study 1: CTT ................................................................................. 32. 3.3.2.. Statistical analysis in Study 2: construct validity ..................................................... 34. 3.3.3.. Statistical analysis in Study 3: Rasch Analysis ........................................................... 37. Results ........................................................................................................................................................... 41 4.1.. Descriptive statistics of sociodemographic data and applied rating scales ............ 41. 4.2.. Results of Study 1: CTT analysis............................................................................................... 46. 4.2.1. Feasibility, acceptability, scaling assumptions, reliability and construct validity........... ................................................................................................................................................ 46.
(20) XIII 4.2.2. 4.3.. Factor analysis ........................................................................................................................ 52. Results of Study 2: construct validity...................................................................................... 55. 4.3.1.. Known-groups validity by sex .......................................................................................... 55. 4.3.2.. Known-groups validity by age groups .......................................................................... 59. 4.3.3. Convergent validity: Association with patient-centered measures and healthcare utilization............................................................................................................................... 61 4.3.4. 4.4.. 5.. Results of Study 3: Rasch analysis ............................................................................................ 67. 4.4.1.. Rasch analysis ......................................................................................................................... 67. 4.4.2.. Classic psychometric analysis of the linear measure .............................................. 72. Discussion .................................................................................................................................................... 74 5.1.. Study 1: Validation of the DBMA according to the CTT ................................................... 75. 5.2.. Study 2: Known-groups, convergent and predictive validity........................................ 80. 5.2.1.. Known-groups validity ........................................................................................................ 80. 5.2.2.. Convergent validity ............................................................................................................... 82. 5.2.3.. Predictive validity.................................................................................................................. 85. 5.3.. Study 3: Rasch analysis ................................................................................................................. 88. 5.4.. Limitations and strengths ............................................................................................................ 94. 5.4.1.. Limitations................................................................................................................................ 94. 5.4.2.. Strenghts ................................................................................................................................... 95. 5.5. 6.. Predictive validity: Association with mortality ......................................................... 64. Study implications........................................................................................................................... 97. Conclusions .................................................................................................................................................. 99. References .......................................................................................................................................................... 102 Appendices ......................................................................................................................................................... 112.
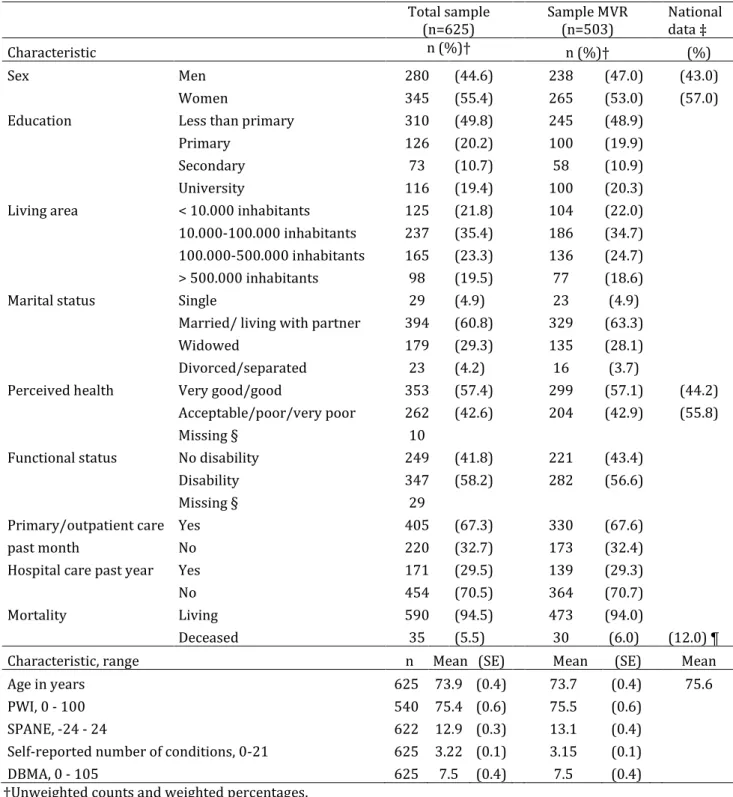
(21) XIV. TABLES AND FIGURES. TABLES. Table 1.1. Conditions included in the Charlson Comorbidity Index, their associated weights and the adapted weights as published by Quan et al.. 8. Table 1.2. Comorbidities included in the Elixhauser’s Comorbidity Measure. 9. Table 1.3. Body systems included in the CIRS-G. 10. Table 1.4. The Self-Administered Comorbidity Questionnaire. 12. Table 1.5: Chronic conditions included in the DBMA. 16. Table 3.1. The DBMA as used in the ELES-PS study. 26. Table 3.2. The Center for Epidemiological Studies Depression Scale, 10-Item version. 27. Table 3.3. The 24-item list of different basic and instrumental activities of daily living as included in the ELES-PS CAPI questionnaire. 29. Table 3.4. The Scale of Positive and Negative Experience as used in the ELES-PS. 30. Table 4.1. Characteristics of the total study sample, the Rasch analysis subsample, and the sample of 65 years and older (Study 1). 42. Table 4.2. Characteristics of the study sample in Study 2: total sample, sample included in the multivariate regression (MVR), and Spanish national data. 43. Table 4.3. Prevalence of conditions, disease burden per condition and scale validation data in the analysed sample. 48. Table 4.4. Missing data, floor and ceiling effects when conditions present. 50. Table 4.5. Convergent validity: Spearman’s rank correlation coefficients of the self-reported number of conditions and DBMA with other health-related measurements. 51. Table 4.6. Rotated factor loadings. 54. Table 4.7. Prevalences and mean disease burden scores per condition and sex in the studied sample: men vs. Women. 57. Table 4.8. Prevalences and mean disease burden scores per condition and age group in the studied sample: <75 years vs. ≥75 years. 60.
(22) XV Table 4.9. Association of patient-centered variables and healthcare utilization with disease burden: raw and adjusted linear models. 62. Table 4.10. Regression coefficients between age and disease burden adjusted for each of the potential confounding variables separately and the relation between age and these variables. 63. Table 4.11. Disease burden as a predictor of mortality: Cox regression. 64. Table 4.12. Global fit to the Rasch model of the DBMA using the total sample, after selecting a subsample and after rescoring the response scale. 68. Table 4.13. Threshold ordering of polytomous items and individual item fit to the Rasch model after rescoring. 69. Table 4.14. Initial score to linear measure conversion table (final Rasch model). 70. Table 4.15. Relative precision of the linear measure in comparison to the raw summative DBMA score. 73.
(23) XVI. FIGURES. Figure 4.1. The distribution of the DBMA in the whole study sample. 45. Figure 4.2. The distribution of the DBMA in the sample aged 65 years and older. 45. Figure 4.3. Screeplot of the 21 DBMA items. 53. Figure 4.4. Receiver Operating Characteristic (ROC) curve of the logistic regression model with mortality as a dependent variable. 65. Figure 4.5. Kaplan Meier probability of survival per DBMA category. 66. Figure 4.6.Person-item threshold distribution map: final Rasch analysis of the DBMA. 71. Figure 4.7. Distribution of the linear measure. 73.
(24) 1. 1.. 1.1.. INTRODUCTION. POPULATION AGEING. The ageing of populations is a global phenomenon and is taking place in almost all countries of the world. This process results from, on the one hand, declining birth rates and, on the other, decreasing mortality. This leads to a reduction in the proportion of children and an increase of older people in the population. In 1950, the worldwide proportion of older persons (60 years and older) was 8 % (1). This proportion rose to almost 12% in the year 2013, and is expected to reach 21% in the year 2050. In developed countries, these proportions are even higher, with a proportion of almost 23% in the year 2013 and a predicted proportion of 32% for the year 2050.. Population aging has important social and economic consequences. The old-age support ratios (number of working-age adults per older person in the population) are already low in developed countries, and are expected to continue to decrease in the coming decades with fiscal pressures on support systems for older persons. Another important consequence lies in the prevalence increase of non-communicable diseases and disability as populations age (2). However, the aging of populations also has its positive sides. The increased prevalence of non-communicable diseases originates in the positive trend of drastically reduced adult mortality. Older persons can increasingly live independently until higher ages, and can support themselves economically, even making financial contributions to younger family members (1)..
(25) 2. 1.2.. CO- AND MULTIMORBIDITY. Not only the prevalence of non-communicable diseases, but also the co-existence of conditions, so-called comorbidity or multimorbidity, increases with the process of population ageing. Comorbidity can be described as the existence of one of more other diseases among persons with one index-disease (3). This definition implies that the main interest is on an index condition and the possible effects of other disorders on the prognosis of this condition (4). The term multimorbidity also refers to the presence of multiple chronic conditions in one person, but without the perspective of a specific indexdisease. Nevertheless, both terms are often used as synonyms, and since the DBMA can be applied from both perspectives, we applied both in this study.. Multimorbidity is a highly prevalent health problem among all age groups, and especially in the elderly (5–7). In a systematic review, published by Marengoni et al., the prevalence in older people ranged from 55 to 98%, and a prevalence of 20-30% was found when the whole population was considered (4). However, several problems arise when comparing the prevalences found in different studies. Studies included different populations, such as primary care or general population, and different methods of data collection were used: self-report, medical records or pharmacy database utilization, for example. Also, although most studies define the presence of two concurrent chronic diseases as multimorbidity, some studies use other definitions, such as the presence of three concurrent conditions. Another limiting factor is the number of disorders taken into account when counting the number of conditions. When using a larger list of included conditions, studies are more likely to find higher prevalences than when using less extended lists. These differences may lead to the broad intervals found in systematic reviews about the prevalence of multimorbidity (4,8)..
(26) 3. 1.3.. MULTIMORBIDITY AS A PROGNOSTIC FACTOR. Multimorbidity is an important prognostic factor. Is has well-described negative effects on mortality, surgical outcome, postoperative complications, and hospital length of stay (LOS) (9), and a direct and independent effect on disability and quality of life (QoL) (10).. 1.3.1.. MULTIMORBIDITY AND MORTALITY. In a recent systematic review about the relation between multimorbidity and mortality in older adults, an overall hazard ratio (HR) of 1.44 was found (11). Also, the number of conditions was positively related to mortality, with a HR of 1.20. When comparing to individuals without multimorbidity, the risk of death was 1.73 times higher in patients with two or more and 2.72 times higher in patients with three or more chronic conditions. However, the included studies were very heterogenic and, again, emphasis was made on the importance of multimorbidity measurement standardization: in order to make studies comparable, a standard methodology should be followed.. 1.3.2.. MULTIMORBIDITY AND SURGICAL OUTCOMES. Comorbid patients are known to have poorer surgical outcomes than other persons. In a study in which the impact of comorbidity on surgical outcomes in laparoscopy-assisted distal gastrectomy was assessed (12), comorbidity was found to be related to local complications, systemic complications and hospital mortality. In multivariate analysis, an odds ratio (OR) of 1.79 was found for local complications and an OR of 2.89 for systemic complications. Another study, assessing the influence of comorbidity on surgical outcomes in older surgical cancer patients , concluded that patients with comorbidity had more.
(27) 4 postoperative morbidity and mortality (13). Patients with comorbid conditions were more likely to suffer from postoperative infections, cardiac complications and postoperative death. Yet, Hewitt et al. (14) who conducted an observations study among older emergency general surgical patients, did not find any differences in surgical outcomes (LOS, readmissions and mortality) between comorbid and non-comorbid patients, and pointed out the importance of not excluding these patients from surgery. Indeed, in the previously cited article about surgical outcomes in older surgical cancer patients, comorbid participants showed lower resection rates than other patients, especially in advanced tumor stages. This leads to poorer survival rates and might be one of the factors that plays a role in the higher mortality rate among persons with multiple chronic conditions.. 1.3.3.. MULTIMORBIDITY AND HOSPITAL LENGTH OF STAY. Different studies show that patients with multiple comorbid conditions have more prolonged hospital stays. In a study among hospitalized patients with cancer and febrile neutropenia (15), the prevalence of LOS ≥ 10 days increased with the number of comorbid conditions: from 11.2% in patients with no comorbidities to 62.3% in patients with five or more comorbidities among patients with solid tumors, and from 17.0% to 80.6% in patients with lymphomas. Another study performed in patients with acute burn injury showed the same pattern: among patients with dementia, peptic ulcer disease and diabetes, there was a 60%, 53% and 26% increase in LOS, respectively..
(28) 5. 1.3.4.. MULTIMORBIDITY AND HEALTHCARE UTILIZATION COSTS. LOS is one of the features that determine healthcare utilization costs. However, it is expected that overall healthcare use increases in patients with multimorbidity, which was confirmed by a study conducted in a primary care population aged over 50 years in Ireland (16). The addition of a single chronic condition led to an associated increase in primary care consultations, hospital outpatient visits, hospital admissions and total health care costs. The latter increased from €760 for zero to €4096 for more than four comorbid conditions. A Swiss study performed in an elderly community-dwelling population drew a similar conclusion (17): total healthcare utilization costs were 5.5 times higher in persons with multiple chronic conditions. Each additional condition was associated with an increased cost of 33% and an increase of 3.2 primary care/specialist consultations per year. In total, the mean number of consultations per year was 4.4 in non-multimorbid persons and 15.7 in multimorbid patients.. 1.3.5.. MULTIMORBIDITY AND DISABILITY. Several studies have confirmed the association between multimorbidity and disability. Garin et al. (18) performed a study about the impact of multimorbidity on disability and QoL in a sample aged over 50 years in Spain. All included 11 chronic conditions, except hypertension, were statistically associated with disability, and a higher number of chronic conditions was associated with greater disability. Depression, anxiety and stroke were found to have the greatest impact on functional status. This finding was confirmed by two studies performed by Marventano et al. in community-dwelling and institutionalized persons aged 65 years and older in Spain, in which dementia and neuropsychiatric disorders were found to be most strongly associated with disability (19,20). St. John et al.
(29) 6 (21) studied the relationship between multimorbidity, disability, and mortality in community-dwelling older adults in Canada. Among persons with no chronic conditions, 1.1% had moderate to severe impairment, versus 25.3% in persons with seven or more conditions.. 1.3.6.. MULTIMORBIDITY AND QUALITY OF LIFE. Multimorbidity has a negative effect on QoL. Fortin et al. (22) performed a systematic review about the relationship between multimorbidity and QoL in primary care. Thirty studies were included and all of them found an inverse association between multimorbidity and QoL. This association was especially clear between multimorbidity and physical domains of QoL. In the above cited study of Garin et al. (18), the same association was found for QoL as for disability: all included 11 chronic conditions, except hypertension, were statistically related to QoL and a higher number of chronic conditions was associated with lower QoL. Depression, anxiety and stroke had the highest negative effect on QoL. Forjaz et al. also found mental health disorders to have a great impact on QoL in a study in multimorbid persons aged 65 years and older in Spain (OR: 1.83 to 4.27) but found an even stronger association for osteoarticular conditions (OR: 3.37 to 5.10) (10)..
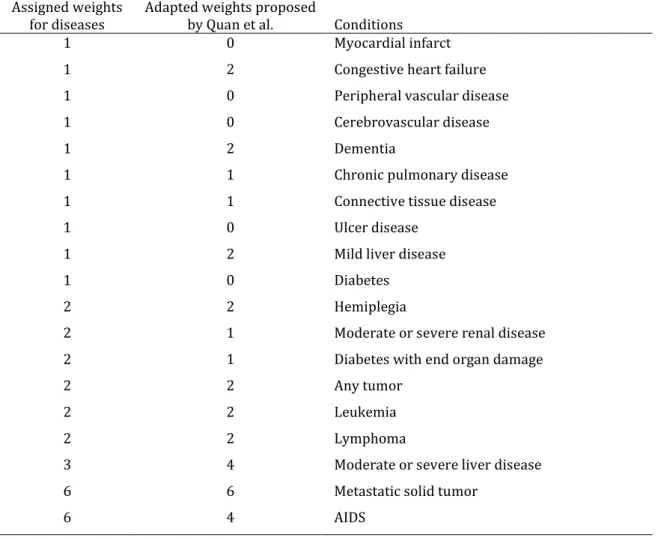
(30) 7. 1.4.. 1.4.1.. CO- AND MULTIMORBIDITY MEASUREMENT TOOLS. THE CHARLSON COMORBIDITY INDEX. There are different instruments to assess multimorbidity and the choice of instrument depends on the type of data available, study population and specific outcome of interest (23). The Charlson Comorbidity Index (CCI) is one of the most widely used tool for comorbidity risk adjustment (24). It contains 17 disease categories, each with an associated weight based on the associated risk of mortality (Table 1). Since its original publication in 1987, it has been validated for its ability to predict mortality in various disease groups, such as cancer, renal disease, stroke, intensive care and liver disease (25). Moreover, it has been adapted and validated to assess system-centered outcomes such as healthcare utilization and healthcare costs (26). Data are either obtained through chart review, International Classification of Diseases (ICD) diagnosis codes or questionnaires (27,28). Recently, Quan et al. published a revision of the CCI, with adapted weights according to current disease prognoses (Table 1.1) (25)..
(31) 8 Table 1.1. Conditions included in the Charlson Comorbidity Index (24), their associated weights and the adapted weights as published by Quan et al. (25) Assigned weights for diseases 1. Adapted weights proposed by Quan et al. 0. 1. 2. Congestive heart failure. 1. 0. Peripheral vascular disease. 1. 0. Cerebrovascular disease. 1. 2. Dementia. 1. 1. Chronic pulmonary disease. 1. 1. Connective tissue disease. 1. 0. Ulcer disease. 1. 2. Mild liver disease. 1. 0. Diabetes. 2. 2. Hemiplegia. 2. 1. Moderate or severe renal disease. 2. 1. Diabetes with end organ damage. 2. 2. Any tumor. 2. 2. Leukemia. 2. 2. Lymphoma. 3. 4. Moderate or severe liver disease. 6. 6. Metastatic solid tumor. 6. 4. AIDS. Conditions Myocardial infarct.
(32) 9. 1.4.2.. ELIXHAUSER´S COMORBIDITY MEASURE. The Elixhauser´s Comorbidity Measure (ECM) is a recent and frequently applied comorbidity index (29). The Elixhauser´s comorbidity tool defines 30 comorbidities, the 17 included in the CCI and 13 new ones (Table 1.2). Administrative data are used to identify the conditions and these are treated separately or as a count (30). The ECM seems to be a better risk adjustment tool than the CCI, especially for mortality beyond 30 days (23,31–33). However, difficulty in terms of feasibility of collecting 30 comorbidities might lead investigators to use the latter rather than the ECM.. Table 1.2. Comorbidities included in the Elixhauser’s Comorbidity Measure Comorbidity Congestive heart failure. Lymphoma. Valvular disease. Metastatic cancer. Pulmonary circulation disorders. Solid tumour without metastasis. Peripheral vascular disorders. Rheumatoid arthritis/collagen vascular. Hypertension. diseases. Paralysis. Coagulopathy. Other neurological disorders. Obesity. COPD. Weight loss. Diabetes uncomplicated. Fluid and electrolyte disorders. Diabetes complicated. Blood loss anaemia. Hypothyroidism. Deficiency anaemia. Renal Failure. Alcohol abuse. Liver disease. Drug abuse. Peptic ulcer excluding bleeding. Psychosis. AIDS. Depression. COPD, Chronic Obstructive Pulmonary Disease.
(33) 10. 1.4.3.. THE CUMULATIVE ILLNESS RATING SCALE. The Cumulative Illness Rating Scale (CIRS) (34) is a comorbidity index that was adapted to be used in geriatric populations by Miller et al. (CIRS geriatrics: CIRS-G) (35). This scale rates 14 body systems (Table 1.3) according to a five point severity scale: 0, no problem; 1, mild current problem or past significant problem; 2, moderate disability or morbidity; requires "first line" therapy; 3, severe or constant significant disability; uncontrollable chronic problem; 4, extremely severe (life threatening), end organ failure, severe impairment in function. The total score is taken into account as well as the mean severity score for the evaluated body systems. The CIRS and CIRS-G seem to be a useful comorbidity measures in clinical research due to their structure according to clinically relevant body systems (36).. Table 1.3. Body systems included in the CIRS-G Body systems Heart Vascular Hematopoietic Respiratory EENT (eyes, ears, nose, throat, larynx) Upper gastrointestinal tract Lower gastrointestinal tract Liver Renal Genito-urinary (ureters, bladder, urethra, prostate, genitals) Musculoskeletal / integument Neurological Psychiatric illness Endocrine / metabolic.
(34) 11. 1.4.4.THE SELF-ADMINISTERED COMORBIDITY QUESTIONNAIRE. Comorbidity data from medical records or administrative data can be limited, due to poor quality of the documentation, lack of recent documentation and under-reporting of preadmission conditions not relevant for the admission diagnosis (37). Therefore, obtaining information about comorbidity through self-report has gained interest in the past years. Studies have shown that patients are generally capable of giving accurate information about their current and past medical conditions (37–39). The Self-Administered Comorbidity Questionnaire (SCQ) was first published by Sangha et al. (9). It contains 12 medical conditions, and participants are asked whether they have the condition, and if so, whether they receive treatment for it and if it limits their daily activities (Table 1.4). Patients can add three additional conditions in an open-ended way. For every positive answer, one point is assigned and, as in other comorbidity measures, a total sumscore is obtained. The SCQ showed a moderate correlation with the CCI (0.55) and it is more related to QoL than the CCI (40)..
(35) 12 Table 1.4. The Self-Administered Comorbidity Questionnaire (9). Problem. Do you have the problem? No (0) Yes (1) . Do you receive treatment for it? No (0) Yes (1). Does it limit your activities? No (0) Yes (1). Heart disease. N. Y. N. Y. N. Y. High blood pressure. N. Y. N. Y. N. Y. Lung disease. N. Y. N. Y. N. Y. Diabetes. N. Y. N. Y. N. Y. Ulcer or stomach disease. N. Y. N. Y. N. Y. Kidney disease. N. Y. N. Y. N. Y. Liver disease. N. Y. N. Y. N. Y. Anemia or other blood disease Cancer. N. Y. N. Y. N. Y. N. Y. N. Y. N. Y. Depression. N. Y. N. Y. N. Y. Osteoarthritis, degenerative arthritis Back pain. N. Y. N. Y. N. Y. N. Y. N. Y. N. Y. Rheumatoid arthritis. N. Y. N. Y. N. Y. N. Y. N. Y. N. Y. N. Y. N. Y. N. Y. N. Y. N. Y. N. Y. Other medical problems (please write in).
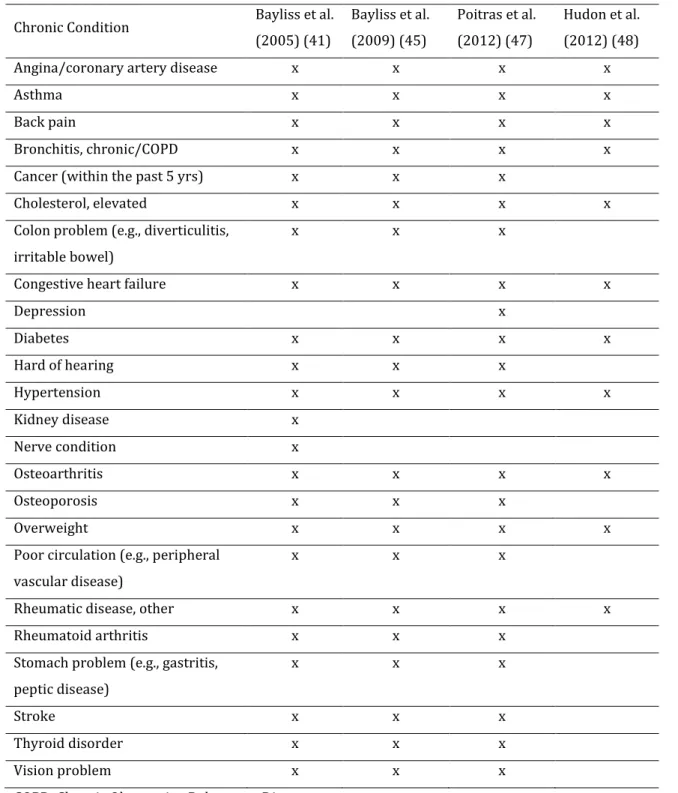
(36) 13. 1.5.. THE DISEASE BURDEN MORBIDITY ASSESSMENT. The SCQ introduced a new aspect to comorbidity measurement: the impact of comorbidity on daily life. Bayliss et al. took a step further: they created a self-report comorbidity assessment instrument that not only assesses whether comorbidities limit daily activities, but also to what extent they do so (41). They created a list of 23 common chronic conditions (Table 1.5), asking participants whether they have each condition, and for each present condition, to what extent it interferes with daily life activities, on a scale from 1 (not at all) to 5 (a lot). Scores assigned to single conditions are summed in order to get the total score, and this measure of disease severity was conceptualized as disease burden. There is no clear definition of disease burden, also called burden of ill health (42) in the literature. Usually it is defined as ‘the impact of disease events on various dimensions of human life, including health’ (43).. Bayliss et al. published four articles about the instrument. In the first one, an initial validation was performed in persons aged 65 years an older (41). Sensitivity and specificity relative to chart review were calculated, as well as correlations with general health status, physical functioning, depression and self-efficacy. Mean sensitivity and specificity relative to chart review was 75% and 92%, respectively. The scale showed moderate to high correlations with overall health status, physical functioning and selfefficacy and a low correlation with depression. These correlations were higher for the DBMA than for the CCI or the RxRisk score.. In a second paper, Bayliss et al. studied the relationship between barriers to selfmanagement, including disease burden, and perceived health and physical functioning using multivariate regression modeling (44). This analysis was done in comorbid persons aged 65 years and older, with at a minimum diabetes, depression and osteoarthritis..
(37) 14 Disease burden was significantly associated with both perceived health and physical functioning.. In the third article that Bayliss and colleagues published about the scale, a multivariate regression was performed with disease burden as the dependent variable (45). Biopsychosocial factors and demographic variables were included as independent variables, as well as two data-based comorbidity indices (the Quan comorbidity index and the chronic disease score, CDS). In this study, the original 23-items list was reduced to 21 chronic conditions (Table 1.5). The same sample was used as in the second article (44): persons aged 65 years and older with at least three chronic conditions. Age, ‘compound effects of conditions’ (treatments and symptoms interfering with each other), self-efficacy, financial constraints, and physical functioning were found to be significantly associated with disease burden. These associations were not affected by the inclusion of the other comorbidity measures in the models.. In the fourth article (46), self-reported disease burden, as a subjective measure, was compared to morbidity measured using administrative data (CCI) as an objective measurement, in the way that both related to patient-reported and utilization outcomes. As in their second and third paper(44,45), a sample of adults aged 65 years or more with at least three comorbidities was used, but this time the three medical conditions could be any of a list of 10 common chronic conditions. Self-reported disease burden was more strongly associated with patient-reported outcomes, whereas morbidity measured by diagnosis codes showed a stronger association with higher utilization..
(38) 15 The disease burden measure was denominated the Disease Burden Morbidity Assesment (DBMA) by Poitras et al. (47). They published a paper about the validation of the French version of the DBMA (DBMA-Fv) in a primary care setting in patients aged 18 years and older in Quebec, Canada. Bayliss´ reduced 21-item list of chronic conditions was used (45), and depression was added as a 22nd item(Table 1.5). Sensitivity and specificity relative to chart review were assessed as it had been by Bayliss et al. (41), as well as the correlation with the CIRS. Test-retest reliability was assessed by repeating the questionnaire in the form of a mail survey two weeks after the first questionnaire. Sensitivity and specificity of 74% and 92% were found, very similar to those reported by Bayliss and collegues (41). Correlations with the CIRS were 0.46 and 0.56 for the first and second surveys, respectively. An intraclass correlation coefficient (ICC) of 0.86 was found, indicating high test-retest reliability.. The same research team published another paper about the DBMA-Fv. In this study, the relation between the DBMA-Fv and literacy was studied, again in a primary care population aged 18 years and older (48). In this research, a simplified version of the DBMA was used, with only 11 chronic conditions (Table 1.5). Literacy and the DBMA were associated in bivariate analyses, but no longer in multivariate analyses when controlling for age and family income.. A third study was performed using the DBMA-Fv, also in Quebec, Canada. In this research the relation between the DBMA and obstructive sleep apnea (OSA) was assessed (49). Patients were recruited from the records of a sleep laboratory and were between 30 and 75 years old. No relation between OSA in general and the DBMA was found in bivariate analysis, but for severe OSA, a positive association was found with disease burden measured with the DBMA (OR: 7.33)..
(39) 16 Table 1.5: Chronic conditions included in the DBMA Chronic Condition. Bayliss et al.. Bayliss et al.. Poitras et al.. Hudon et al.. (2005) (41). (2009) (45). (2012) (47). (2012) (48). Angina/coronary artery disease. x. x. x. x. Asthma. x. x. x. x. Back pain. x. x. x. x. Bronchitis, chronic/COPD. x. x. x. x. Cancer (within the past 5 yrs). x. x. x. Cholesterol, elevated. x. x. x. Colon problem (e.g., diverticulitis,. x. x. x. x. x. x. x. irritable bowel) Congestive heart failure Depression. x. x. Diabetes. x. x. x. x. Hard of hearing. x. x. x. Hypertension. x. x. x. x. Kidney disease. x. Nerve condition. x. Osteoarthritis. x. x. x. x. Osteoporosis. x. x. x. Overweight. x. x. x. Poor circulation (e.g., peripheral. x. x. x. Rheumatic disease, other. x. x. x. Rheumatoid arthritis. x. x. x. Stomach problem (e.g., gastritis,. x. x. x. Stroke. x. x. x. Thyroid disorder. x. x. x. Vision problem. x. x. x. x. vascular disease). peptic disease). COPD, Chronic Obstructive Pulmonary Disease. x.
(40) 17. 1.6.. 1.6.1.. SCALE VALIDATION: CLASSICAL TEST THEORY AND RASCH ANALYSIS. SCALE VALIDATION. As explained in the previous chapter, initial validations of the DBMA were performed by Bayliss et al. (41,44–46) and Poitras et al (47). Criterion validity relative to chart review was assessed (41,47), as well as convergent validity with other self-reported outcomes as physical functioning, perceived health and depression (41), test-retest reliability(47) and concurrent validity with other comorbidity measures (41,45,47). A next step, essential to guarantee the quality of a scale, is to validate it following a very precise psychometric or clinimetric methodology (50). This is done by means of the statistical analysis of different psychometric attributes, following a set of norms and standards based on scientific methods and theories of health measurement. In this sense, there are two main approaches: the classical test theory (CTT) and the item response theory (IRT), which includes Rasch analysis (51).. 1.6.2.. CLASSICAL TEST THEORY. CTT is a quantitative approach to test the validity and reliability of a scale. It can be traced back to Spearman at the beginning of the 20th century, who introduced the separation of an observed score into a true score and an error, and the estimation of the reliability of observed scores (52). CTT assumes that each observed score on a scale is a combination of a true underlying score and an unsystematic or random error (51). According to this theory, every person has a true score that would be obtained if there were no measurement errors. However, the true score is never shown by the scale, only an.
(41) 18 observed score, which is assumed to be the true score plus some error. The following properties are studied in the CTT approach (50,53):. . Feasibility: The applicability of the instrument in the intended context. . Acceptability: The extent to which the instrument is acceptable in the target population.. . Scaling assumptions: The extent to which single items are related to the total score. . Reliability: The degree to which the instrument is free of random error: o. Internal consistency: the extent to which the items measure the same construct. o. Reproducibility: Stability of the scores in time or among different evaluators. . Validity: The degree to which the instrument measures the constructs it is supposed to measure: o. Construct validity: The degree in which the scores of the instrument are consistent with hypotheses about the construct. o. . Convergent/ Divergent validity. . Known-groups validity. . Predictive validity. Criterion validity: Relation of the scale with a gold standard . . Concurrent validity: Relation of the scale with an existing test. Dimensionality: the existence or not of subscales (dimensions) within the scale.
(42) 19. 1.6.3.. RASCH ANALYSIS. IRT can be traced back to 1927 when the Law of Comparative Judgment was published by Louis Thurstone (54). IRT can be described as a measurement model that tries to explain the connection between observed item responses on a scale and an underlying construct (51). Stochastic models are used to generate statistical estimations of parameters that represent the locations of persons and items on a latent continuum (52).. Rasch analysis was born out of the work of Georg Rasch, a Danish mathematician, in the 1960s (55). The Rasch model assumes that there is a logistic function of the difference between the item difficulty and the person’s ability , or in other words, the level of the construct being measured and the person’s level of the construct (56). It is based on two basic assumptions: local independence and unidimensionality. Rasch analysis is considered by some authors as a standard for developing new instruments and assessing the quality of existing ones (57). It provides a linear measure, which, given an appropriate distribution, permits the use of parametric statistics (58).. The key difference between Rasch analysis and CTT is that the latter describes a set of data, whereas Rasch analysis aims to obtain data that fit the Rasch model (52). Rasch analysis includes the following evaluations (59):. . Fit to the Rasch model: The extent to which the data coincide with theoretical item performance according to the Rasch model. . Reliability: The degree to which the instrument is free of random error. . Undimensionality: Only one construct is measured. . Response dependency: Are items are linked in such way that the response on one item will determine the response on another?.
(43) 20 . Category structure: The extent to which the responses to the items are consistent with the metric estimate of the underlying construct. . Scale targeting: An indication of how well targeted the items are for people in the sample. . Differential item functioning (DIF): Do different groups within the sample, despite equal levels of the characteristic being measured, respond in a different manner to an individual item?.
(44) 21. 2.. OBJECTIVES. The objective of this thesis was to perform a validation study of the DBMA. To do so, three studies were performed. The first study consists of a validation according to the CTT. Furthermore, since construct validity gives important information about potential contexts a scale can be applied in, this was assessed more thoroughly in a second study. In the third study, a Rasch analysis was performed. This responds to the following objectives:. OBJECTIVE 1: To perform an analysis of the psychometric properties of the DBMA according to the assumptions of the Classical Test Theory: -. Feasibility. -. Acceptability. -. Scaling assumptions. -. Reliability. -. Construct validity. -. Exploratory factor analysis. OBJECTIVE 2: To asses construct validity by studying: -. Known-groups validity for sex and age groups. -. Convergent validity: the relation between the DBMA, patient-centered outcomes, and healthcare utilization. -. Predictive validity: the association with mortality..
(45) 22. OBJECTIVE 3: To perform an analysis following the Item Response Theory of the DBMA through Rasch analysis: -. Test of fit to the Rasch model. -. Reliability. -. Unidimensionality. -. Response dependency. -. Category structure. -. DIF. -. Scale targeting. -. CTT analysis of the linear measure. The results of these three studies will be published shortly. Study 1 had already been published at the moment of this writing (60); the article is added as an appendix to this thesis . Study 2 is in process of revision for resubmission in a different journal and Study 3 was accepted for publication (61) and is also presented as an appendix..
(46) 23. 3. 3.1.. METHODS STUDY DESIGN AND SAMPLE. Data came from the Ageing in Spain Longitudinal Study, Pilot Survey (Estudio Longitudinal Envejecer en España, pilot study, ELES-PS), which included 1747 community-dwelling adults aged 50 or more living in Spain (62). In this survey, a representative sample was selected on a national geographical basis. For sampling, stratified clusters of census sections were randomly selected by autonomous region and municipality, proportionally to their population of 50 years and older. Households with a telephone line were selected at random from a commercial household telephone directory. Per household, individuals aged 50 or more were randomly selected, with post-stratification by sex and age group (50-59, 60-69, 70-79 and 80-89 years). Field work was conducted in 2011.. The data in the ELES-PS study were collected in four stages: a telephone questionnaire (n=1747), a visit by a trained nurse (n=1531), a computer-assisted personal interviewing (CAPI) questionnaire (n=1400), and a self-administered questionnaire (n=1145). DBMA data were collected through the CAPI questionnaire, and its 1400 participants formed the sample that was used for the current work.. The DBMA was developed to be used in older adults (41). Therefore, Study 1 was performed with a subsample of the persons aged 65 years or older that answered the CAPI questionnaire (n=707). Because we used the percentage of missing values in the CTT approach, persons that did not answer the DBMA (completely) were included. These 82 persons that had missing values for the DBMA were excluded in Study 2 since they would not contribute to the analyses, resulting in a sample of 625 persons. Study 3 was performed with the whole study sample (n=1400). However, since analysis with samples larger than 300 could result in statistically significant deviations from the Rasch model of.
(47) 24 otherwise well-fitting items, a random subsample of 300 was taken for the Rasch analysis (63–66).. The 1747 participants in the ELES-PS form a representative sample of the Spanish population. However, people from the Basque region were overrepresented in the sample. Due to the complex design and this overrepresentation, analyses carried out with these data base must take into account the design variables as well as the weighing factors, if possible. Since neither CTT nor Rasch analysis can be performed correcting for complex samples or weights, this was only done in the second study.. The data on mortality from all causes were obtained after a follow-up time of four years, and were extracted from the Spanish National Death Index (Índice Nacional de Defunciones), which includes all deaths registered in Spain since 1987. Persons were searched automatically and manually by full name, sex and date of birth. The register does not provide information about the cause of death, only the date of death is provided.. The ELES-PS study was approved by the Ethics Committee of the Spanish National Research Council. Informed consent was obtained from all individual participants included in the study. Since obtaining mortality data from the Spanish National Death Index was not among the initial objectives of the ELES study, a second approval was obtained from the Ethics Committee of the Institute of Health Carlos III for Study 2..
(48) 25. 3.2.. ASSESSMENTS. 3.2.1.. THE DBMA. The DBMA, first described by Bayliss et al. (41), consists of a self-report questionnaire in which participants rate the disease burden caused by a number of medical conditions, if present. Patients are asked to what extent conditions interfere with daily activities, on a five-point scale from 1 (not at all) to 5 (a lot). Conditions not present are scored zero. As in other studies (Table 1.5), the original DBMA’s 23-item list was adapted by selecting 21 common chronic conditions based on the conditions used in other multimorbidity indices (9,41,67–69). From the multimorbidity indices for which in the validation studies analysis per chronic condition had been performed, those conditions that specifically predicted mortality, hospitalization or future handicaps and those that showed a transversal association with physical functioning were selected (67–69). In case analysis per condition had not been performed, all conditions included in these multimorbidity indices were selected (9,41). As a criterion, only conditions selected from more than one index were included. A few exceptions were made: liver diseases were not included because of their low prevalence in older adults; and urinary tract conditions, anxiety and memory related disorders were added because of their high prevalence in this population. The DBMA, as used in the ELES-PS study, is shown in Table 3.1.. The DBMA is a measure of disease burden but can also be applied as a disease count, since it asks for the presence of 21 chronic conditions. Other authors applied the scale for this purpose (70) and so did we in one of the analyses in Study 1. However, in the present work, when using the term ‘DBMA score’ it always refers to disease burden, unless stated otherwise..
(49) 26 Table 3.1. The DBMA as used in the ELES-PS study In case of an affirmative answer, ask: Do you have On a scale of 1 to 5, can you tell me the condition? whether the condition has limited you in your usual activities? Yes/No 1 2 3 4 5 6 7 8 9 10 11 12 13 14 15 16 17 18 19 20 21. Hypertension Myocardial infarction Heart failure Angina Circulation problems/ intermittent claudication Osteoarthritis Rheumatoid arthritis Asthma COPD/emphysema Diabetes Gastric/duodenal ulcer Kidney disease Depression Anxiety Cerebral embolism/stroke Cancer Osteoporosis Memory disorders Parkinson's disease Chronic back pain Urinary tract problems (prostate, bladder). 1 (not at all) 2 3 4 5 (a lot). 1 1 1 1 1. 2 2 2 2 2. 1 1 1 1 1. 2 2 2 2 2. 3 3 3 3 3. 4 4 4 4 4. 5 5 5 5 5. 1 1 1 1 1 1 1 1 1 1. 2 2 2 2 2 2 2 2 2 2. 1 1 1 1 1 1 1 1 1 1. 2 2 2 2 2 2 2 2 2 2. 3 3 3 3 3 3 3 3 3 3. 4 4 4 4 4 4 4 4 4 4. 5 5 5 5 5 5 5 5 5 5. 1 1 1 1 1 1. 2 2 2 2 2 2. 1 1 1 1 1 1. 2 2 2 2 2 2. 3 3 3 3 3 3. 4 4 4 4 4 4. 5 5 5 5 5 5. COPD, Chronic Obstructive Pulmonary Disease.
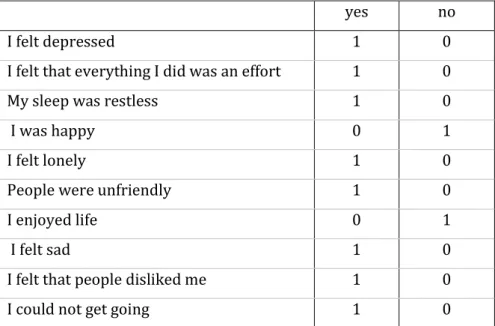
(50) 27. 3.2.2. OTHER ASSESSMENTS. To screen for depression, the self-administered questionnaire of the ELES-PS included the dichotomous 10-item Center for Epidemiologic Studies Depression Scale (CES-D) (71). It contains 10 questions with 'yes/no' response categories, asking about the feelings of the respondent in the past week (Table 3.2). A score of 1 is assigned to every positive answer for depression. A sum score of 3 was used as a cut-off point for depression (72). Previous studies found support for this short version of the CES-D to be as reliable as the original CES-D, with a Cronbach´s alpha of 0.80, and to show satisfactory convergent validity with the Composite International Diagnostic Interview (sensitivity and specificity of 84% and 64%, respectively) (71,72).. Table 3.2. The Center for Epidemiological Studies Depression Scale, 10-item version (71) yes. no. I felt depressed. 1. 0. I felt that everything I did was an effort. 1. 0. My sleep was restless. 1. 0. I was happy. 0. 1. I felt lonely. 1. 0. People were unfriendly. 1. 0. I enjoyed life. 0. 1. I felt sad. 1. 0. I felt that people disliked me. 1. 0. I could not get going. 1. 0.
(51) 28 QoL was assessed through the Personal Wellbeing Index (PWI) (73), which provides a measure of general QoL or wellbeing. The PWI was included in the CAPI-questionnaire. Respondents are asked to grade, on a scale of 1 to 10, their satisfaction with 7 life dimensions: standard of living, personal health, achieving in life, personal relationships, personal safety, community-connectedness and future security. Total subscores were lineally transformed into a 0-100 scale (58), and higher total scores indicate better QoL. Previous research found support for the validity and reliability of this linear measure in older adults, correlating moderately with 'satisfaction with life' and showing a person separation index (PSI) of 0.91 (58).. The CAPI questionnaire included a question about perceived health, asking the participants to grade their satisfaction with their health status on a scale from 1 (very bad) to 5 (very good). This variable was used in Study 2, and dichotomized into very good/ good vs. acceptable/poor/very poor (74). However, the PWI also includes a dimension about personal health answered on a 0-10 rating scale. Because of this broader response scale, this dimension was used as a measure of perceived health in Studies 1 and 3.. A 24-item list of different basic and instrumental activities of daily living, as used in the Health and Retirement Study (75), was included in the CAPI questionnaire as a measure of physical functioning (Table 3.3). Included activities are getting dressed, walking 100 meters and making phone calls, among others. Participants were asked whether they experienced difficulties in performing them, on a scale from 1 (always) to 4 (never). Scores were summed to get a measure of physical functioning. In Study 2, this variable was dichotomized into no disability (score of 96, which was the maximum score) vs. any level of disability (scores <96)(10)..
(52) 29 Table 3.3. The 24-item list of different basic and instrumental activities of daily living as included in the ELES-PS CAPI questionnaire. Do you have any difficulty with…. Always. Sometimes Almost Never never. 1 Walking 100m. 1. 2. 3. 4. 2 Walking 1000m. 1. 2. 3. 4. 3 Sitting for about two hours. 1. 2. 3. 4. 4 Getting up from a chair after sitting for long. 1. 2. 3. 4. 1. 2. 3. 4. 6 Climbing one flight of stairs without resting. 1. 2. 3. 4. 7 Stooping, kneeling, or crouching. 1. 2. 3. 4. 8 Reaching or extending your arms above. 1. 2. 3. 4. 1. 2. 3. 4. 1. 2. 3. 4. 11 Picking up a 5 cents coin from a table. 1. 2. 3. 4. 12 Dressing, including putting on shoes and socks. 1. 2. 3. 4. 13 Walking across a room. 1. 2. 3. 4. 14 Bathing or showering. 1. 2. 3. 4. 15 Eating, such as cutting up your food. 1. 2. 3. 4. 16 Getting in or out of bed. 1. 2. 3. 4. 17 Using the toilet, including getting up and down. 1. 2. 3. 4. 18 Using a map to figure out how to get around in. 1. 2. 3. 4. 19 Preparing a hot meal. 1. 2. 3. 4. 20 Shopping for groceries. 1. 2. 3. 4. 21 Making phone calls. 1. 2. 3. 4. 22 Taking medications. 1. 2. 3. 4. 23 Work around the house or yard. 1. 2. 3. 4. 24 Managing your money, such as paying your. 1. 2. 3. 4. periods 5 Climbing several flights of stairs without resting. shoulder level 9 Pulling or pushing large objects like a living room chair 10 Lifting or carrying weights over 10kg, like a heavy bag of groceries. a strange place. bills and keeping track of expenses.
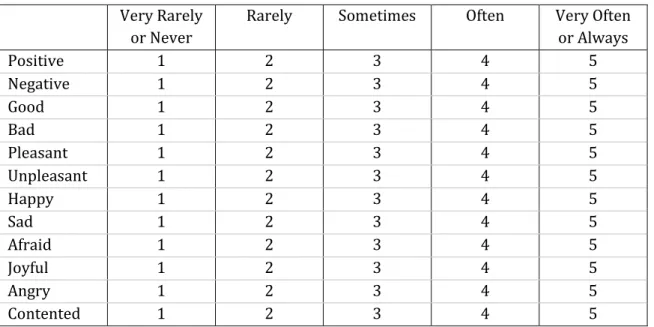
(53) 30 The CAPI questionnaire contained the Scale of Positive and Negative Experience (SPANE) to assess affect balance. (Table 3.4) (76). This 12-item questionnaire includes six items that assess positive feelings and six items for negative feelings. Respondents are asked to report how much they experienced each feeling in the past month, on a scale from 1 (very rarely or never) to 5 (very often or always). Scores for negative feelings are subtracted from the positive feeling total score, resulting in a total scale from -24 (unhappiest) to 24 (happiest) to obtain a measure of affect balance. Diener et al (76) found support for the validity and reliability of the scale, converging well with other measures of emotions and affective well-being, and showing a Cronbach´s alpha of 0.88.. Table 3.4. The Scale of Positive and Negative Experience as used in the ELES-PS (76). Positive Negative Good Bad Pleasant Unpleasant Happy Sad Afraid Joyful Angry Contented. Very Rarely or Never 1 1 1 1 1 1 1 1 1 1 1 1. Rarely. Sometimes. Often. 2 2 2 2 2 2 2 2 2 2 2 2. 3 3 3 3 3 3 3 3 3 3 3 3. 4 4 4 4 4 4 4 4 4 4 4 4. Very Often or Always 5 5 5 5 5 5 5 5 5 5 5 5.
(54) 31 Two measures were included in the CAPI questionnaire to assess the use of healthcare resources. In the first, the numbers of visits in the past month to the primary care center (general practitioner, nurse), physiotherapist or medical specialist were summed, to get a measure of primary and outpatient care utilization. To assess the use of hospital care resources, the visits to the emergency department, ‘day hospital’ and hospital admissions in the past year were summed. Both variables were dichotomized, into use vs. no use of healthcare resources in the corresponding period of time..
(55) 32. 3.3.. STATISTICAL ANALYSES. Statistical analyses were performed in Stata 12 for Windows, unless stated otherwise.. 3.3.1.. STATISTICAL ANALYSIS IN STUDY 1: CTT. The following psychometric properties were examined: feasibility, acceptability, scaling assumptions, reliability and construct validity. Feasibility was assessed by determining the percentage of missing values per item and the percentage of computable scores for the total scale, considering acceptable scores <10% and >90%, respectively (77). Acceptability was explored by comparing possible and observed scores and assessing mean-to-median difference for the total scale (criterion, <10% of the scale range) as well as floor and ceiling effects (<15%) and skewness (-1 to 1) (78).. Scaling assumptions were determined through the item-total corrected correlation (ITCC) for each item (criterion r≥0.40) (79). Reliability was assessed through internal consistency (Cronbach’s alpha) and the item homogeneity index (criteria: α ≥ 0.70 and r ≥0.30, respectively) (77).. For convergent validity, we expected self-reported disease burden to be negatively associated with perceived health, physical functioning and QoL and to find a positive association with depression (10,80,81). This was calculated through Spearman’s rank correlation coefficients due to the non-normal distribution of the DBMA. Correlation coefficients were interpreted following Cohen’s conventions, considering correlations ≥0.5 as large, 0.5-0.3 as moderate and 0.3-0.1 as having a small magnitude (82)..
(56) 33 Spearman’s rank correlations were repeated using the self-reported number of conditions instead of disease burden, to evaluate the added value of assessing the impact of conditions on daily life. These correlations were compared using a Fisher r-to-z transformation (83). Because the DBMA had a higher number of missing values than the disease count variable, those cases with missing values for DBMA were excluded in this analysis to make the two variables comparable.. Known-groups validity was examined comparing disease burden by sex and age groups (Wilcoxon rank-sum test). Since multimorbidity is more frequent in both women and older people, we hypothesized to find significantly higher scores in these groups than in men and younger participants (84).. Dimensionality and factor structure were explored through exploratory factor analysis, using a principal axis factoring method with oblimin rotation. The number of extracted factors was determined according to eigenvalues (>1) and visual inspection of the screeplot, taking the 'elbow' as the point of separation (85)..
(57) 34. 3.3.2.. STATISTICAL ANALYSIS IN STUDY 2: CONSTRUCT VALIDITY. Due to overrepresentation of the Basque Country in the sample, analyses were weighted to the underlying population distribution and accounted for the effect of stratification and clustering. Therefore, descriptive statistics are presented with are presented with standard errors (SE) instead of standard deviations (SD). Not all statistics allowed the correction for the complex design or weights; for those cases where correction was not possible, this is stated in the text.. In Study 1, known-groups validity was assessed by sex and age group (<75 years vs. ≥75 years). In Study 2, this was studied for disease prevalence and disease burden scores separately. First, differences in the mean number of present conditions per person were studied by sex and age group. Since the Wilcoxon rank-sum test does not allow weights or correction for complex design, p-values for the differences in the mean number of present conditions were obtained through a Somers’ D analysis (86) weighted for the population distribution. Furthermore, an analysis of the differences in disease prevalence and disease burden scores was performed for single conditions. Significance of the differences in disease prevalence by groups was assessed with Chi-square tests, whereas significance of the difference in disease burden scores was tested with Somers’ D tests.. Study 1 assessed convergent validity with perceived health, physical functioning, QoL and depression. These variables were included in the convergent validity assessment in study 2 as well, except for depression, which was excluded because of a very high proportion of missing values (24.5%). Affect balance and the use of healthcare utilization were added since we expected them to be related to the DBMA as well (46,87)..
Figure


+7


Documento similar
The first trial (the CHOIR study) compared risk of death and cardiovascular complications in 1432 patients with chronic renal disease who were treated with epoetin alfa to achieve
Analysis of two questionnaires on quality of life of Chronic Obstructive Pulmonary Disease patients*
George Respiratory Questionnaire and Chronic Obstructive Pulmonary Disease Assessment Test in patients with chronic obstructive pulmonary disease based on correlation and
Thus, the disease progression CM describes the associa- tions between the demographic characteristics of patients, the central attributes of COPD representing disease progression
rous artworks, such as sonorou s poetry; d) instances of nOlHu1islie music, such as sonorous activiti es with soc ial, bu t not necessarily aes thetic, funct ions. Lango
The Bath Ankylosing Spondylitis Radiology Index (BASRI): a new, validated approach to disease assessment. A radiographic scoring system and identification of
Increased agreement on proxy-based assessments is observed between different assessors if the construct is less dependent on the judgement or perception of the patients and
On the other hand at Alalakh Level VII and at Mari, which are the sites in the Semitic world with the closest affinities to Minoan Crete, the language used was Old Babylonian,
The assessment of fibrosis has impact on management and on response to therapy. ERT is the standard therapy for Fabry disease. ERT partially cleared microvascular deposits of GL-3
