The Acoustical History of Hagia Sophia revived through Computer
Simulation
PACS REFERENCE: 43.55.Ka
Weitze, Christoffer Andreas; Rindel, Jens Holger; Christensen, Claus Lynge; Gade, Anders Christian
Ørsted•DTU, Acoustic Technology, Technical University of Denmark Building 352, DK 2800 Lyngby, Denmark
Telephone: +45 45 25 47 92 Fax: +45 45 88 05 77 E-mail: [email protected] http://www.dat.dtu.dk/cahrisma.htm
ABSTRACT
The present paper deals with acoustic computer simulations of Hagia Sophia, which is characterized not only by being one of the largest worship buildings in the world, but also by – in its 1500 year history – having served three purposes: as a church, as a mosque and today as a museum. The investigation is done as a part of the EU project - CAHRISMA.
The room acoustic differences in the three periods have been investigated by creating three different computer models each including the particular furnishing as reported in the historical archives. For all the configurations simulations and auralizations have been made, with and without people occupying the rooms.
INTRODUCTION
This paper deals with the virtual restitution of the acoustics of the Hagia Sophia Byzantine church. This is done as a part of the CAHRISMA project that investigates, among other things, the acoustics of some of the old mosques and churches in Turkey. Three mosques are investigated in the project: Sokollu, Süleymaniye and Selimiye (two in Istanbul and one in Edirne), and 3 churches: Saints Sergius & Bacchus, Saint Irene and Hagia Sophia (all in Istanbul – the churches are no longer used as churches). This church, and the other two churches, has been used for different purposes through their 1500 years of history. Hagia Sophia was built in 537 A.D. as a church in the Byzantine Empire. In 1453 A.D. it was converted into a mosque in the Ottoman Empire, and finally it was converted into a museum in 1934 A.D.
DESCRIPTION OF THE DIFFERENT TIME CONFIGURATION MODELS
In the following, the three different time configurations of the model of Hagia Sophia are described. Below are seen pictures of the different Odeon models. The colours of the materials represent their different absorption characteristics. A material with a red colour absorbs mainly in the high frequency range. A blue colour absorbs mainly at low frequencies. A dark colour has a high absorption value, and a bright colour has a low absorption value. A grey colour absorbs equally in the frequency range.
Figures 1 - 4:
Odeon model of Hagia
Sophia as a Church.
Main materials
Marble
Stone with plaster and paint Marble ornament
Glass windows
Silk cloth
Altar Chancel screen Artifacts
Figures 5 - 7:
Odeon model of Hagia
Sophia as a Mosque.
Main materials
Carpet
Artifacts
Wooden panels with Arabic inscription
Mahfel Minber
Figures 8 - 10:
Odeon model of Hagia
Sophia as a Museum.
The Museum configuration looks very similar to the mosque configuration. As far as historical archives tell, only the lack of carpet shows the difference.
As seen from the pictures above (figures 1 – 10), the main differences between the three configurations are the artifacts and the materials. The main acoustic difference lies in the floor, where the mosque is covered with carpets, and the church and museum has a marble floor.
CALCULATION RESULTS AND DATA
Data and selected calculation results for the three different configurations of Hagia Sophia are shown below.
Volume [m3]
(Estimation from the Odeon model)
No. of surfaces in the model (average for the three configurations)
No. of sources No. of receivers
[image:5.596.94.505.278.484.2]255.800 5.937 3 12
Table 1: Selected data for Hagia Sophia
Reverberation time (T 30)
0 2 4 6 8 10 12
63 125 250 500
1000 2000 4000 8000
Average(125-4000) Average Freq. band [Hz]
T30 [s] Church(Empty) Church(Full) Mosque(Empty) Mosque(Full) Museum(Empty) Museum(Full)
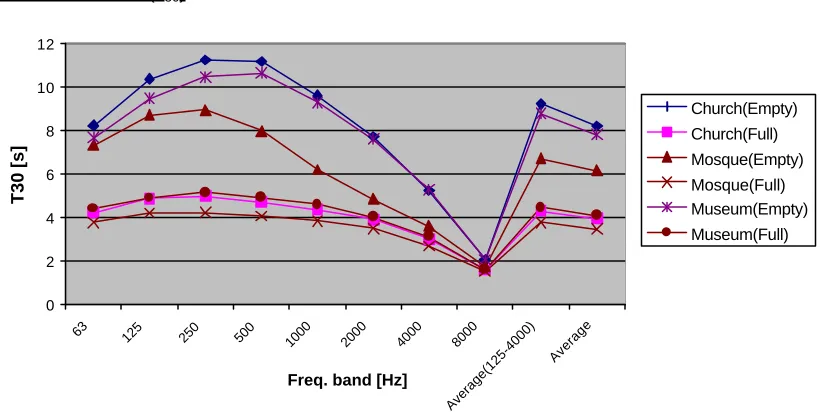
Figure 11: Calculated reverberation time (T30) as a function of 1/1 octave frequency band for Hagia Sophia averaged
over all positions. Also seen are frequency averaged values from 125-4000 Hz and from 63-8000 Hz.
Clarity (C 80)
-35 -30 -25 -20 -15 -10 -5 0 5 10 15
0 10 20 30 40 50 60 70 80 90 100
SR-Distance [m] C80 [dB] Church(Empty) Church(Full) Mosque(Empty) Mosque(full) Museum(Empty) Museum(Full)
Figure 12: Calculated C80 (freq. Averaged from 125 – 4000 Hz) as a function of source-receiver (SR) distance for Hagia
[image:5.596.97.506.560.728.2]DISCUSSION
In figure 11 T30 for the different time configurations (empty and full) of Hagia Sophia is seen as a function of 1/1-octave frequency bands. For all the time configurations T30 is seen to follow almost the same envelope, peaks between 250 and 500 Hz, and has a minimum value at 8 kHz. The empty configurations are seen to give the highest T30 values, and the biggest difference over frequency compared to the full configurations. The empty configurations have a T30 value of approx. 8 sec. for 63 Hz, with the mosque giving the lowest value and the church giving the highest. When the frequency increases the difference between the mosque and the two other configurations becomes bigger, until they reach almost the same value at high frequencies. The small difference between the church and museum configurations can mainly be explained by the absence of the wooden panels with Arabic inscription for the church, which gives slightly larger T30 values.
The empty mosque peaks at 250 Hz with a value of 8,9 sec. The empty church peaks also at 250 Hz with a value of 11,2 sec, and the museum peaks at 500 Hz with a value of 10,6 sec. All configurations attain their lowest value of approx. 2 sec at 8 kHz, which is due to the domination of air absorption. The carpet covering almost the entire floor causes the generally lower values of the mosque.
The full configurations gives T30 values that are more than halved for low frequencies, and they do not differ so much between the different configurations as the empty ones. This is due to the similar absorption characteristics of the people occupying a large area of the rooms.
The relatively large reverberation times are caused by the very large volume (more than 250.000 m3) and the very hard surfaces (marble, stone, glass etc.).
In figure 12 C80 is seen as a function of the distance from the source to the receiver. It generally shows that C80 decreases with increasing distance. It also shows that the empty rooms have the lowest C80 values, which shows C80’s dependency of T30. Some closer distances are seen to have lower values than large distances. At these positions there is no direct sight to the source. The direct sound is obstructed by walls, columns etc. Furthermore it is seen that the values of C80 have a great span from approx. 11 dB (close to the source) to –29 dB (mainly far from the source). This is mainly due to the great difference in distance, the room size and reverberation time, and because some positions are placed with no direct sight to the source, which in many cases lowers C80 substantially.
CONCLUSION
This study shows different acoustic time models of Hagia Sophia situated in Istanbul, Turkey. Calculations and auralizations have been carried out using the Odeon software. Three different models were made of Hagia Sophia: As a Church, as a Mosque and as its present configuration, a Museum. An average of 5937 surfaces was used to make the three different models. In the present paper, values for reverberation time (T30) and Clarity (C80) are presented as function of frequency and source-receiver distance, respectively. The difference in T30 for the three different time configurations is mainly seen between the mosque and the two other configurations, which is mainly due to the carpet on the floor. The values of clarity is seen to cover a large range, mainly due to the great distances and the fact that some positions do not have direct sight to the source. Furthermore pictures of the three models from Odeon are seen with their different furnishing and materials.
REFERENCES
1. Historical drawings of Hagia Sophia provided by Yildiz Technical University, Istanbul, Turkey.