Correlation of adipose tissue with liver histology in Asian
Indian patients with nonalcoholic fatty liver disease (NAFLD)
Narendra S. Choudhary,* Ajay Duseja,* Naveen Kalra,** Ashim Das,*** Radha K Dhiman,* Yogesh K Chawla** Department of Hepatology. ** Department of Radiodiagnosis.*** Department of Histopathology. Postgraduate Institute of Medical Education and Research, Chandigarh, India.
ABSTRACT
Background. There is sparse literature on the association of adipose tissue with liver histology in patients with nonalcoholic fatty liver disease (NAFLD). Aim. To study the correlation of visceral adipose tissue (VAT), subcutaneous adipose tissue (SAT) and total adipose tissue (TAT) with liver histology in Indian pa-tients with NAFLD. Material and methods. A single slice CT scan at the level of L4-L5 vertebrae was done to assess the abdominal VAT and SAT volumes in 21 patients with histological diagnosis of NAFLD. Adult treatment panel III criteria with modified abnormal waist were used to define metabolic syndrome (MS). Histological grading was done according to the NAFLD activity score (NAS). Results. Twenty-one patients with NAFLD [13 males, median age: 35 years, median BMI: 25.97 kg/m2] were included prospectively. Even though overweight/obese patients had severe liver disease, there was no difference in the volume of VAT adjusted for BMI between 6 (28.5%) lean and 15 (71.5%) overweight/obese patients. Patients with NASH and borderline NASH were older, obese with higher VAT and SAT volumes than no-NASH group. SAT volume (SATV) correlated significantly with hepatic steatosis but none of the adipose tissue volumes had any co-rrelation with other histological variables. Both SATV and TAT volume (TATV) correlated significantly with severity of liver disease as determined by NAS score whereas presence of MS or insulin resistance had no correlation with histological severity. Conclusion. Both subcutaneous and total adipose tissue volume are related to the disease severity as determined by NAFLD activity score in Indian patients with NAFLD.
Key words. NASH. Nonalcoholic steatohepatitis. Fatty liver. Metabolic syndrome. Obesity. Diabetes mellitus.
Correspondence and reprint request: Dr. Ajay Duseja MD, DM, MNAMS, FACG Department of Hepatology, Postgraduate
Institute of Medical Education and Research Sector 12, Chandigarh, India
Phone: +91-172-2756336. Fax: +91-172-2744401 E mail: [email protected]
Manuscript received: November 11, 2011. Manuscript accepted: February 9,2012.
INTRODUCTION
Nonalcoholic fatty liver disease (NAFLD) is a broad term consisting of patients with simple steato-sis, nonalcoholic steatohepatitis (NASH), NASH re-lated cirrhosis and hepatocellular carcinoma (HCC) and has emerged as an important cause of unexplai-ned rise in hepatic transaminases and cryptogenic liver disease.1-4 NAFLD is an extremely common li-ver disease, with a fairly high prevalence in diffe-rent populations of the World.5-7 Histological
while VAT has predominant expression of TNF-α
and interleukin 6,8.16 Because of the cytokine profi-le promoting insulin resistance, VAT may contribu-te more than SAT in the pathogenesis of NAFLD. In addition when lipolytic activity is stimulated, visce-ral fat releases more free fatty acids that are delive-red directly to liver through portal venous system which itself promotes insulin resistance and histolo-gical severity.14,17 Still there is lack of consensus on the role of two components of adipose tissue with some studies also supporting the predominant role of subcutaneous fat in the pathogenesis of NAFLD.18
Very few studies from Asia-Pacific have investiga-ted the relationship between adipose and histological severity.17,18 We conducted this study with an aim to assess the correlation between VAT, SAT and total adipose tissue (TAT) with various histological va-riables and NAFLD activity score (NAS) in Indian patients with NAFLD.
MATERIAL AND METHODS
Twenty-one biopsy proven patients with NAFLD were enrolled in the study prospectively (July 2009 to July 2010). All patients gave an informed consent and study had the approval of the Institute Ethics Committee. Inclusion criteria included adult pa-tients with alcohol intake < 20 g per day (confirmed by two family members), raised serum alanine tran-saminase (ALT) at least one and a half times the up-per limit of normal for at least 3 months, ultrasound showing features of steatosis, exclusion of other liver diseases (serum negative for HBsAg, anti HCV, autoimmune markers, with normal serum ceruloplasmin, negative Kayser Fleischer ring, normal serum ferritin and transferrin satura-tion) and liver biopsy consistent with NAFLD. Preg-nant females, patients with secondary causes of NAFLD (surgery or drugs) and with evidence of ci-rrhosis on imaging or histology were excluded. Pa-tients were classified as having overweight, obesity and central obesity as per the Asian Pacific criteria (overweight as body mass index (BMI) > 23 - < 25 kg/m2, obesity as BMI ≥ 25 kg/m2, central obesity-waist circumference > 90 cm and > 80 cm in males and females respectively).19,20 Diabetes mellitus was defined as per the WHO criteria: fasting plasma glu-cose (FPG) ≥ 126 mg/dL or plasma glucose ≥ 200 mg/dL or a 2 h plasma glucose on glucose tolerance test ≥ 200 mg/dL in a symptomatic patient (repeat values for asymptomatic subjects).21 Lipids were considered as abnormal if serum high density
lipo-protein (HDL) was < 40 mg/dL in males and < 50 mg/dL in females and serum triglycerides (TG) were > 150 mg/dL.22 Insulin resistance was determined by the homeostasis model assessment for insulin re-sistance (HOMA-IR). HOMA-IR was calculated as the product of fasting insulin [µU/L, measured by chemiluminescence immunoassay (Roche Diagnos-tics Indianapolis)] and fasting plasma glucose (mmol/L) divided by 22.5. An absolute value of HOMA-IR > 1.64 was taken as abnormal.23,24 Meta-bolic syndrome was defined by the presence of at least ≥ 3 out of five modified adult treatment panel III criteria including modified abnormal waist as per the Asia Pacific criteria, FPG > 110 mg/dL or known diabetic, hypertension (blood pressure ≥ 130/ 85 mm Hg or on antihypertensive drugs), TG > 150 mg/dL and HDL < 40 mg/dL in males and < 50 mg/ dL in females.22
Assessment of VAT and SAT
A single slice non contrast CT was done at the le-vel of L4-L5 vertebrae with section thickness of 5 mm and attenuation values of -30 to -190 Hounsfield units were used for adipose tissue.25 Total adipose tissue volume (TATV) was calculated by drawing a line along circumference of abdominal wall. SAT was defined as fat superficial to the abdominal and back muscles.25 Visceral adipose tissue volume (VATV) was calculated by subtracting subcutaneous adipose tissue volume (SATV) from total adipose tis-sue volume. CT was done in fasting state after bowel preparation to exclude the effect of intraluminal fat within a day to a maximum of 7 days after perfor-ming the liver biopsy. To exclude the effect of BMI on adipose tissue, TATV, VATV and SATV were also adjusted for BMI (TATV/BMI, VATV/BMI and SATV/BMI).
Histopathology
All patients were subjected to a liver biopsy by a Tru cut needle (16-18G) as an inpatient procedure. Histopathological grading and fibrosis assessment was done by a single pathologist according to the NAFLD activity score (NAS) as given by Nonalco-holic Steatohepatitis Clinical Research Network.26
Statistical methods
range (IQR) and as 95% confidence interval. Fre-quency of metabolic syndrome and its various com-ponents was calculated. Correlations of VAT and SAT with components of MS and histological para-meters and NAS score were done by Spearman’s correlation. Histological severity groups (no NASH, borderline NASH and NASH) and lean vs. overweight/ obese patients were compared using Kruskal-Wallis and Mann Whitney test.
RESULTS
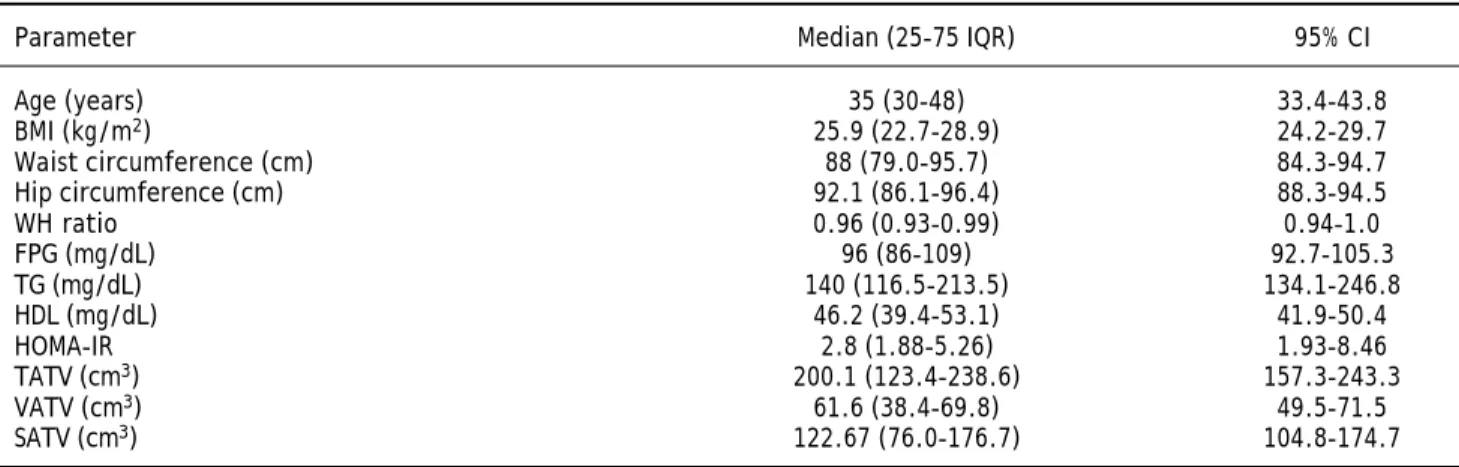
Baseline characteristics and various adipose tis-sue volumes in all 21 patients [13 males and 8 fema-les, median age of 35 years] included in the study are shown in table 1.
Anthropometry and metabolic syndrome
Six patients (28.5%) had normal BMI, three (14.2%) were overweight and rest 12 (57.1%) pa-tients were obese. Class I obesity (BMI > 25 kg/m2) was present in 8 (38%) patients and class II obesity (BMI > 30 kg/m2) was present in 4 (19%) patients. Three patients (14.2%) had diabetes mellitus (all 3 were females) and 4 patients (19%) had hyperten-sion. Seventeen patients (80.9%) had at least one component of metabolic syndrome; ten patients (47.6%) had at least 2 components of metabolic syn-drome and 5 patients (23.8%) had full blown meta-bolic syndrome (3 or more components). Central obesity (abnormal waist circumference) was the most common abnormality present in 12 (57.1%) pa-tients followed by abnormal HDL in 8(38%), abnor-mal TG in 7 (33.3%), impaired glucose tolerance (IGT) or diabetes mellitus (DM) in 5 (23.7%) and hypertension in 4(19%) patients. Eighteen patients
(85.7%) patients had abnormal HOMA-IR values su-ggesting the presence of insulin resistance. Female patients were significantly older [48 (39-53.75) vs.
32 (28-36) years, p = 0.004] and had higher fasting plasma glucose [103 (94-122) vs. 96 (85-102) mg/dL, p = 0.04] in comparison to male patients. There was no significant difference in anthropometric, other biochemical parameters and adipose tissue volumes between male and female patients.
Comparison of lean and overweight/obese group
Patients were divided as having lean NAFLD (BMI < 23 kg/m2) or overweight/obese (BMI > 23 kg/m2). Six patients (28.5%) had lean NAFLD and 15 (71.4%) had overweight or obesity. Other than the difference in BMI, overweight and obese patients were older, had larger waist circumference and had severe liver disease (higher NAS score) in compari-son to lean patients with NAFLD (Table 2). Though adipose tissue volumes were higher in those with overweight or obesity, when the adipose tissue volu-mes (TAT, VAT and SAT) were adjusted for the BMI, there was no difference in the VATV/BMI in two groups. There was no significant difference in the presence of components of metabolic syndrome between two groups (Table 2).
Histological severity
NAFLD activity score (NAS) in 21 patients with NAFLD showed that nine patients (42.8%) had a steatosis score of 1, seven patients (33.3%) had a steatosis score of 2 and five patients (23.8%) had a steatosis score of 3. One patient (4.7%) did not have lobular inflammation, 10 patients (47.6%) had a lo-bular inflammation score of 1, 8 patients (38.1%)
Table 1. Anthropometry, biochemical parameters and adipose tissue volumes in patients with NAFLD.
Parameter Median (25-75 IQR) 95% CI
Age (years) 35 (30-48) 33.4-43.8
BMI (kg/m2) 25.9 (22.7-28.9) 24.2-29.7
Waist circumference (cm) 88 (79.0-95.7) 84.3-94.7 Hip circumference (cm) 92.1 (86.1-96.4) 88.3-94.5
WH ratio 0.96 (0.93-0.99) 0.94-1.0
FPG (mg/dL) 96 (86-109) 92.7-105.3
TG (mg/dL) 140 (116.5-213.5) 134.1-246.8
HDL (mg/dL) 46.2 (39.4-53.1) 41.9-50.4
HOMA-IR 2.8 (1.88-5.26) 1.93-8.46
TATV (cm3) 200.1 (123.4-238.6) 157.3-243.3
VATV (cm3) 61.6 (38.4-69.8) 49.5-71.5
had a score of 2 and 2 patients (9.5%) had a lobular inflammation score of 3 and 5 patients (23.8%) with evidence of portal inflammation had a portal inflam-mation score of 1. Only two patients (9.5%) had he-patocyte ballooning with a ballooning score of 2. Twelve patients (57.1%) had no fibrosis, 5 patients (23.8%) had a fibrosis score of 1, 3 patients (14.2%) had a fibrosis score of 2 and only one patient (4.7%) had a fibrosis score of 3. None of the patients had histological evidence of cirrhosis (fibrosis score 4). Female patients had higher steatosis score (2.25 ± 0.7 vs. 1.54 ± 0.7, p 0.049) in comparison to male patients but there was no difference in other
histo-logical variables or NAS score between male and fe-male patients.
Comparison of NASH and no NASH groups
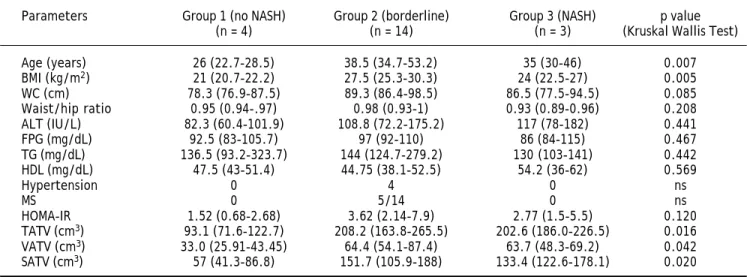
According to NAS, patients were divided into three groups as having no NASH (score 1 or 2), borderline NASH (score 3 or 4) and NASH (score 5 or more). Four patients (19%) had no NASH, 3 pa-tients (14.2%) had NASH and 14 (66.6%) papa-tients were in borderline group (6 patients had a score of 3 and 8 patients had a score of 4). Even though the number of patients in the definite NASH and no
Table 2. Differences amongst lean and overweight or obese patients with NAFLD.
Parameters Lean NAFLD Overweight/obese NAFLD p value (BMI < 23 kg/m2) (BMI > 23 kg/m2)
n = 6 n = 15
Age (years) 28(24.2-38.7) 38(34-53) 0.024 BMI (kg/m2) 21.7(20.9-22.6) 27(25.6-30.1) 0.008
WC (cm) 78.3(77.2-87.3) 90.2(86.5-98) 0.032 FPG (mg/dL) 102.5(87-110.5) 96(86-104) 0.875 TG (mg/dL) 136.5(97.2-288.2) 141(130-171) 0.862 HDL (mg/dL) 47.5(41.2-54.6) 46.2(36-54) 0.509
MS 1/6(16.6%) 4/15(26.6%) 0.635
HOMA-IR 1.91(.7-3.82) 3.43(2.24-5.5) 0.087 TATV (cm3) 105.8(83.8-145.1) 212.5(189-247) 0.002
VATV (cm3) 36.3(26.8-49.68) 65.4(59.5-85.6) 0.008
SATV (cm3) 75.2(43.7-100.2) 152.5(114.7-178.1) 0.005
TATV(cm3)/BMI 4.8(3.9-6.4) 7.8(7.1-8.9) 0.008
VATV(cm3)/BMI 1.5(1.2-2.3) 2.4(1.7-2.8) 0.066
SATV(cm3)/BMI 3.4(2.1-4.4) 4.5(5.5-6.0) 0.008
NAS 2(1.7-4.2) 4(3-4) 0.036
Data shown as median (25-75 IQR).
Table 3. Differences amongst no NASH, borderline NASH and NASH group of patients.
Parameters Group 1 (no NASH) Group 2 (borderline) Group 3 (NASH) p value (n = 4) (n = 14) (n = 3) (Kruskal Wallis Test) Age (years) 26 (22.7-28.5) 38.5 (34.7-53.2) 35 (30-46) 0.007 BMI (kg/m2) 21 (20.7-22.2) 27.5 (25.3-30.3) 24 (22.5-27) 0.005
WC (cm) 78.3 (76.9-87.5) 89.3 (86.4-98.5) 86.5 (77.5-94.5) 0.085 Waist/hip ratio 0.95 (0.94-.97) 0.98 (0.93-1) 0.93 (0.89-0.96) 0.208 ALT (IU/L) 82.3 (60.4-101.9) 108.8 (72.2-175.2) 117 (78-182) 0.441 FPG (mg/dL) 92.5 (83-105.7) 97 (92-110) 86 (84-115) 0.467 TG (mg/dL) 136.5 (93.2-323.7) 144 (124.7-279.2) 130 (103-141) 0.442 HDL (mg/dL) 47.5 (43-51.4) 44.75 (38.1-52.5) 54.2 (36-62) 0.569
Hypertension 0 4 0 ns
MS 0 5/14 0 ns
HOMA-IR 1.52 (0.68-2.68) 3.62 (2.14-7.9) 2.77 (1.5-5.5) 0.120 TATV (cm3) 93.1 (71.6-122.7) 208.2 (163.8-265.5) 202.6 (186.0-226.5) 0.016
VATV (cm3) 33.0 (25.91-43.45) 64.4 (54.1-87.4) 63.7 (48.3-69.2) 0.042
SATV (cm3) 57 (41.3-86.8) 151.7 (105.9-188) 133.4 (122.6-178.1) 0.020
NASH were small, data revealed that patients with NASH and borderline NASH were significantly ol-der, had higher BMI and waist circumference and had higher adipose tissue volumes (TATV, VATV, SATV) than the no-NASH group (Table 3).
Correlation of adipose tissue volumes with liver histology
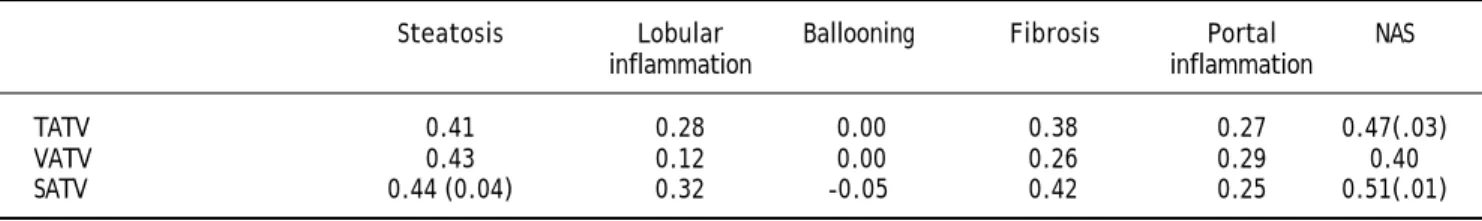
Subcutaneous adipose tissue volume correlated significantly with hepatic steatosis but none of the adipose tissue volumes had any correlation with other histological variables (lobular inflammation, ballooning and fibrosis) (Table 4). Subcutaneous and total adipose tissue volume correlated signifi-cantly with severity of liver disease (NAS score) where as visceral adipose tissue volume had no co-rrelation with severity of liver disease (NAS score) (Table 4, Figure 1). Only patients’ age correlated
significantly with hepatic fibrosis (r 0.488; p 0.025).
Correlation of adipose tissue volumes with metabolic syndrome
Correlations of adipose tissue volumes with meta-bolic syndrome are shown in table 5. TATV and SATV correlated significantly with number of com-ponents of metabolic syndrome.
Correlation of metabolic syndrome with liver histology
Although not statistically significant; presence of metabolic syndrome was associated with more seve-re histological variables and higher NAS scoseve-re. Overall, there was no significant correlation of me-tabolic risk factors or HOMA-IR with various
histo-Figure 1. Showing correla-tion of NAFLD activity score (NAS) with various adipose tis-sue volumes.
450
400
350
300
250
200
150
100
50
0
Volume (cm
3)
0 1 2 3 4 5 6
NAS
SATV TATV VATV Linear (SATV) Linear (TATV) Linear (VATV)
Table 4. Correlation of histological variables with adipose tissue volumes in patients with NAFLD.
Steatosis Lobular Ballooning Fibrosis Portal NAS inflammation inflammation
TATV 0.41 0.28 0.00 0.38 0.27 0.47(.03)
VATV 0.43 0.12 0.00 0.26 0.29 0.40
SATV 0.44 (0.04) 0.32 -0.05 0.42 0.25 0.51(.01)
logical variables except HDL levels, which correla-ted negatively with hepatocyte ballooning (r -0.468, p 0.032).
Correlation of insulin resistance with
various parameters
HOMA-IR values were significantly higher among patients with metabolic syndrome [10.89(5.53-22.9)] than patients without metabolic syndrome [2.43 (1.57-3.32)]. HOMA-IR also signi-ficantly correlated with body weight (r 0.572, p 0.007), waist circumference (r 0.688, p 0.001) and number of components of metabolic syndrome (r 0.722, p 0.000). HOMA-IR had no correlation with various histological variables (steatosis, lobular inflammation, portal inflammation, ballooning, fi-brosis and NAS score). HOMA-IR significantly co-rrelated with total adipose tissue and SAT volumes (Table 5).
DISCUSSION
In this study we found that subcutaneous adipose tissue volume (SATV) and total adipose tissue volu-me (TATV) correlated significantly with severity of liver disease as determined by NAS score in patients with NAFLD. Only SATV correlated with hepatic steatosis and none of the adipose tissue volumes had any correlation with other histological variables. We also found that even though metabolic syndrome and insulin resistance correlated with SATV and TATV, these indices had no correlation with histolo-gical severity as determined by NAS score in pa-tients with NAFLD.
According to portal hypothesis visceral adipose tissue is linked to NAFLD as it drains directly into portal venous system thus delivering FFA directly to
liver combined with more lipolytic activity linked to the expression of adipocytokines promoting insulin resistance.27 VAT has also been shown to be inde-pendently associated with hepatic inflammation, fi-brosis and steatosis.17,28 On the other hand it has been shown that only about 5 to 20% of FFAs in portal venous system originate from visceral fat in lean and obese subjects respectively and majority of FFAs in portal system come from subcutaneous adi-pose tissue.29 As subcutaneous adipose tissue consti-tutes greater part of adipose tissue; theoretically it should have more impact on FFAs release and insu-lin resistance. In fact it has been shown that subcu-taneous fat is more important than VAT in causing insulin resistance.30 As visceral fat increases dispro-portionately with increasing age and body weight, older age and more obese population in the earlier studies may have accounted for a significant role of VAT over SAT in determining the severity of liver disease.31-33
Very few studies from Asia-Pacific have looked at the relationship of adipose tissue with liver histolo-gy in patients with NAFLD. One of the studies from Australia that found correlation of VAT with histo-logical severity had a mean age and BMI of 51 years and 30 kg/m2 respectively in contrast to median age and BMI of 35 years and 25.9 kg/m2 respectively in the present study.17 A Japanese study (mean age: 49 years) though found that VAT played important role for steatosis and hepatic fibrosis, showed no correla-tion of NASH grade with VAT volume in a subset of patients with NASH.34 On the other hand a cross sectional study from Australia which looked at the relationship with only hepatic steatosis found that the severity of hepatic steatosis was associated with the body mass index, waist circumference, subcuta-neous adipose tissue thickness, serum leptin level, HOMA IR score and serum ALT level in both gen-ders, but it was associated with increasing visceral
Table 5. Correlation of number of components metabolic syndrome, insulin resistance and adipose tissue volumes in patients with NAFLD.
TATV SATV VATV
WC 0.74(0.00) 0.73 (0.00) 0.39
FPG 0.29 0.30 0.30
TG -0.23 -0.27 -0.15
HDL -0.18 -0.14 -0.15
Number of 0.55 (0.00) 0.55 (0.00) 0.41
components of MS
HOMA-IR 0.56 (0.00) 0.52 (0.01) 0.40
adipose tissue thickness and decreasing serum adi-ponectin levels in males alone.18 Except for the diffe-rence in age, fasting plasma glucose and hepatic steatosis (all higher in female patients), we did not find any difference in adipose volumes, metabolic syndrome or histological severity amongst male and female patients. Even though we had a small num-ber of patients, our results suggest that SAT may also be an important determinant of histological se-verity in young patients with NAFLD without a very high BMI, a profile commonly seen in Indian patients with NAFLD.4,10
About one fourth of patients in the present study had normal BMI (< 23 kg/m2). Though adipose tis-sue volumes were higher in those with overweight or obesity, when the adipose tissue volumes (TAT, VAT and SAT) were adjusted for the BMI, there was no difference in the VATV/BMI in two groups. Hence, in spite of having low BMI, these patients had visceral fat volume comparable to those with overweight and obesity. Das, et al. compared 90 NAFLD patients (BMI < 25 kg/m2) with 134 non-obese controls without NAFLD and found that NAFLD patients had higher percentage of body fat in comparison to non obese controls.35 Results from present study are thus in concordance with Das, et
al., and suggest that even if some of the NAFLD
pa-tients do not have overweight or obesity, they do have a higher visceral adipose tissue volume. Overa-ll, we found that, overweight and obese patients had severe liver disease (higher NAS score) in compari-son to lean patients with NAFLD.
In the present study we also found significant co-rrelation of all the adipose tissue volumes (TATV, VATV, SATV) to number of components of metabolic syndrome, which suggests that, both SAT and VAT are important for development of metabolic syndro-me. Our results are similar to Stacy, et al., who also found significant correlation of metabolic risk factors with both VAT and SAT.36 Liu, et al. stu-died 2,477 patients (participants from the Jackson heart study) and found that both VAT and SAT were associated with metabolic syndrome and it’s components.37 Recently Goel, et al. studied 100 heal-thy Indian non-diabetic adults (35 with metabolic syndrome) and found that SAT was a better predic-tor of metabolic syndrome than VAT after adjusting for body fat percentage.38 We found significant co-rrelation of various adipose tissue volumes (Total > SAT > VAT) to HOMA-IR but on multivariate analysis, none was found to be superior to other, which suggests that both SAT and VAT contribute to insulin resistance in patients with NAFLD. Other
studies have also found significant correlation of HOMA-IR with both VAT and SAT.39,40
Though there was a trend towards severe liver di-sease in patients with metabolic syndrome, we did not find significant correlation of individual compo-nents of metabolic syndrome or presence of metabo-lic syndrome with histological severity of various parameters, or overall disease severity (NAS score) in patients with NAFLD. Metabolic syndrome has been shown to be associated with hepatic steatosis and with risk of having NASH among patients with NAFLD.8 Less number of patients in the present study with low prevalence of metabolic syndrome and obesity may be the reason for not finding any correlation of metabolic syndrome with liver histology.
Our study is limited by small number of patients. Even though the patients with NASH and borderline NASH had higher adipose tissue volumes (TATV, VATV and SATV) than patients with no-NASH, in view of the small number of patients in NASH and no NASH groups, we correlated the adipose tissue volumes only with NAS score. The study also lacks a control group without NAFLD but since the study required a liver biopsy for correlating the liver his-tology with adipose tissue, a control group without liver disease could not be justified ethically.
In conclusion our study observed that in Indian patients with NAFLD, both subcutaneous and total adipose tissue volume are related to the disease seve-rity as determined by NAFLD activity score and subcutaneous adipose tissue volume is also related to the degree of hepatic steatosis. Presence of MS or insulin resistance had no correlation with the histo-logical severity. A study with larger number of pa-tients is required to substantiate the results.
ACKNOWLEDGMENT
None.
GRANTS OR FINANCIAL SUPPORT
None.
ABBREVIATIONS
• NAFLD: nonalcoholic fatty liver disease.
• VAT (V): visceral adipose tissue (volume).
• SAT (V): subcutaneous adipose tissue (volume).
• TAT (V): total adipose tissue (volume).
• HOMA-IR: homeostasis model assessment for insulin resistance.
• WC: waist circumference.
• FPG: fasting plasma glucose.
• TG: triglycerides.
• HDL: high density lipoproteins.
REFERENCES
1. Farrell GC, Larter CZ. Nonalcoholic fatty liver disease, from steatosis to cirrhosis. Hepatology 2006; 43: 99-112. 2. Vuppalanchi R, Chalasani N. Nonalcoholic fatty liver
disea-se and nonalcoholic steatohepatitis: disea-selected practical is-sues in their evaluation and management. Hepatology
2009; 49: 306-17.
3. Duseja A, Nanda M, Das A, Das R, Bhansali A, Chawla Y. Prevalence of obesity, diabetes mellitus and hyperlipide-mia in patients with cryptogenic liver cirrhosis. Trop Gas-troenterol 2004; 25: 15-7.
4. Duseja A, Sharma B, Kumar A, Kapil S, Das A, Dhiman RK, Chawla YK. Nonalcoholic fatty liver in a developing coun-try is responsible for significant liver disease. Hepatology
2010; 52: 2248-9.
5. Musso G, Gambino R, Cassader M. Non-alcoholic fatty liver disease from pathogenesis to management: an update.
Obes Rev 2010; 11: 430-45.
6. Amarapurkar D, Kumani P, Patel N, Gupte P, Kumar P, Agal S, Baijal R, et al. Prevalence of nonalcoholic fatty liver di-sease, population based study. Ann Hepatol 2007; 6: 161-3. 7. Singh SP, Nayak S, Swain H, Rout N, Mallik RN, Agrawal O, Meher C, et al. Prevalence of nonalcoholic fatty liver di-sease in coastal eastern India: a preliminary ultrasono-graphic survey. Trop Gastroenterol 2004; 25: 76-9. 8. Singh DK, Sakhuja P, Malhotra V, Gondal R, Sarin SK.
Inde-pendent predictors of steatohepatitis and fibrosis in Asian Indian patients with non-alcoholic steatohepatitis. Dig Dis Sci 2008; 53: 1967-76.
9. Madan K, Batra Y, Gupta SD, Chander B, Rajan KD, Tewatia MS, Panda SK, et al. Non-alcoholic fatty liver disease may not be a severe disease at presentation among Asian In-dians. World J Gastroenterol 2006; 12: 3400-5.
10. Duseja A, Das A, Das R, Dhiman RK, Chawla Y, Bhansali A, Kalra N. The clinicopathological profile of Indian patients with nonalcoholic fatty liver disease is different from that in west. Dig Dis Sci 2007; 52: 2368-74.
11. Larter CZ, Chitturi S, Heydet D, Farrell GC. A fresh look at NASH pathogenesis. Part 1: The metabolic movers. J Gas-troenterol Hepatol 2010; 25: 672-90.
12. Duseja A, Murlidharan R, Bhansali A, Sharma S, Das A, Das R, Chawla Y. Assessment of insulin resistance and effect of metformin in nonalcoholic steatohepatitis—a prelimina-ry report. Indian J Gastroenterol 2004; 23: 12-5.
13. Dowman JK, Tomlinson JW, Newsome PN. Pathogenesis of non-alcoholic fatty liver disease. Q J Med 2010; 103: 71-83.
14. Wajchenberg BL. Subcutaneous and visceral adipose tis-sue: their relation to metabolic syndrome. Endocr Rev
2000; 21: 697-738.
15. Polyzos SA, Kountouras J, Zavos C, Tsiaousi E. The role of adiponectin in the pathogenesis and treatment of non-al-coholic fatty liver disease. Diabetes Obes Metab 2010; 12: 365-83.
16. Marra F, Bertolani C. Adipokines in liver diseases. Hepato-logy 2009; 50: 957-69.
17. Van der Poorten D, Milner KL, Hui J, Hodge A, Trenell MMI, Kench JG, London R, et al. Visceral fat: a key mediator of steatohepatitis in metabolic liver disease. Hepatology
2008; 48: 449-57.
18. Ayonrinde OT, Olynyk JK, Beilin LJ, Mori TA, Pennell CE, de Klerk N, Oddy WH, et al. Gender specific differences in adipose distribution and adipocytokines influence ado-lescent nonalcoholic fatty liver disease. Hepatology 2011; 53: 800-9.
19. Steering Committee of the Western Pacific Region of the World Health Organization, International Association for the Study of Obesity, International Study Task Force The Asia-Pacific perspective; redefining obesity and its treat-ment. Australia: Health Communications; 2000, p. 8-56. 20. Dhiman RK, Duseja A, Chawla Y. Asians need different
cri-teria for defining overweight and obesity. Arch Intern Med 2005; 165: 1069-70.
21. World Health Organization. Definition, diagnosis and clas-sification of diabetes mellitus and its complications. Part 1: Diagnosis and classification of diabetes mellitus. Gene-va: World Health Organization; 1999, p. 31-3.
22. Expert Panel on Detection, Evaluation and Treatment of High Cholesterol in Adults Executive summary of the third report of the National Cholesterol Education Program (NCEP) expert panel on detection, evaluation and treat-ment of high blood cholesterol in adults (Adult Treattreat-ment panel III). JAMA 2001; 285: 2486-97.
23. Duseja A, Thumburu KK, Das A, Dhiman RK, Chawla YK, Bha-dada S, Bhansali A. Insulin tolerance test is comparable to homeostasis model assessment for insulin resistance in pa-tients with nonalcoholic fatty liver disease. Indian J Gas-troenterol 2007; 26: 170-3.
24. Chitturi S, Abeygunasekera S, Farrell GC, Holmes-Walker J, Hui JM, Fung C, et al. NASH and insulin resistance: Insulin hypersecretion and specific association with the insulin resistance syndrome. Hepatology 2002; 35: 373-9. 25. Yoshijumi T, Nakamura T, Yamane M, Islam AH, Menju M,
Yamasaki K, Arai T, et al. Abdominal fat: standardized technique for measurement at CT. Radiology 1999; 211: 283-6.
26. Kleiner DE, Brunt EM, Van Natta M, Behling C, Contos MJ, Cummings OW, Ferrell LD, et al; Nonalcoholic Steatohepa-titis Clinical Research Network. Design and validation of a histological scoring system for nonalcoholic fatty liver di-sease. Hepatology 2005; 41: 1313-21.
27. Kabir M, Catalano KJ, Ananthnarayan S, Kim SP, Van Cit-ters GW, Dea MK, Bergman RN. Molecular evidence su-pporting the portal theory: a causative link between visceral adiposity and hepatic insulin resistance. Am J Physiol Endocrinol Metab 2005; 288: E454-E461.
28. Park BJ, Kim YJ, Kim DH, Kim W, Jung YJ, Yoon JH, Kim CY, et al. Visceral adipose tissue area is an independent risk factor for hepatic steatosis. J Gastroenterol Hepatol
2008; 23: 900-7.
29. Klein S. The case of visceral fat: argument for the defense.
J Clin Invest 2004; 113: 1530-2.
30. Abate N, Garg A, Peshock RM, Stray-Gundersen J, Grundy SM. Relationships of generalized and regional adiposity to insulin sensitivity in men. J Clin Invest 1995; 96: 88-98. 31. Demerath EW, Sun SS, Rogers N, Lee M, Reed D, Choh AC,
Couch W, et al. Anatomical patterning of visceral adipose tissue: race, sex, and age variation. Obesity 2007; 15: 2984-93.
risk profile of premenopausal women. Diabetes Care 1999; 22: 1471-8.
33. Lara-Castro C, Weinsier RL, Hunter GR, Desmond R. Vis-ceral adipose tissue in women: longitudinal study of the effects of fat gain, time, and race. Obes Res 2002; 10: 868-74.
34. Eguchi Y, Mizuta T, Sumida Y, Ishibashi E, Kitajima Y, Iso-da H, Horie H, et al. The pathological role of visceral fat accumulation in steatosis, inflammation, and progression of nonalcoholic fatty liver disease. J Gastroenterol 2011; 46: 70-8.
35. Das K, Das K, Mukherjee PS, Ghosh A, Ghosh S, Mridha AR, Dhibar T, et al. Nonobese population in a developing coun-try has a high prevalence of nonalcoholic fatty liver and significant liver disease. Hepatology 2010; 51: 1593-602. 36. Porter SA, Massaro JM, Hoffmann U, Vasan RS, O’Donnel
CJ, Fox CS. Abdominal subcutaneous adipose tissue: a pro-tective fat depot? Diabetes Care 2009; 32: 1068-75.
37. Liu J, Fox CS, Hickson DA, May WD, Hairston KG, Carr JJ, Taylor HA. Impact of abdominal visceral and subcutaneous adipose tissue on cardiometabolic risk factors: the Jackson heart study. J Clin Endocrinol Metab 2010; 95: 5419-26. 38. Goel K, Misra A, Vikram NK, Poddar P, Gupta N.
Subcu-taneous abdominal adipose tissue is associated with the metabolic syndrome in Asian Indians independent of intra-abdominal and total body fat. Heart 2010; 96: 579-83.
39. Nagaretani H, Nakamura T, Funahashi T, Kotani K, Miyana-ga M, TokunaMiyana-ga K, Takahashi M, et al. Visceral fat is a ma-jor contributor for multiple risk factor clustering in Japanese men with impaired glucose tolerance. Diabetes Care 2001; 24: 2127-33.
40. Lirussi F, Vitturi N, Azzalini L, Orando S, Orlando R, Pleba-ni M, Realdi G. Perihepatic adipose tissue thickness: a new non-invasive marker of NAFLD? J Gastrointestin Liver Dis