VIBRATION REDUCTION INDEX K
IJIN HOLLOW CONSTRUCTIONS:
APPLICATION OF THE EUROPEAN STANDARD EN12354 TO THE
SPANISH CONSTRUCTIONS
REFERENCIA PACS: 43.55.Rg
Esteban, A.; Cortés, A. (1) Villot, M; Martin, C. (2)
(1) Centro Tecnológico LABEIN. Acoustics Area Cuesta de Olabeaga, 16. 48013 Bilbao, España Tel: 34 944 892 400. Fax: 34 944 411 749 E-mail: [email protected], [email protected] (2) C.S.T.B. Noise and Vibration Department
24, Rue Joseph Fourier. 38400 Saint-Martin-d`Hères, France Tel: 33 476 762 515. Fax: 33 476 442 046
E-mail: [email protected]
,
[email protected]ABSTRACT
The vibration reduction index Kij is one of the key parameters when using the new European prediction tools developed in the EN 12354. The standard gives an estimation of this parameter using the relation between the masses of monolithic elements. However, past studies showed the need for more complete researches in this field, involving also hollow construction elements, commonly used in southern Europe.
This paper presents some results of field measurements of the Kij parameter, showing meaningful differences with the calculated values.
INTRODUCTION
The acoustical quality of dwellings in Spain was guaranteed up to day with the compliance of the building regulation NBE-CA88 [1]. This regulation established laboratory requirements to each construction element depending on its use (separating or partition walls, floors…). However, the new Spanish Building Regulation [2] will consider the whole building as a product itself (performance-based-regulation). In this way, the building is responsible for fulfilling the acoustical insulation requirements: not only the separating element (floor, wall...) must comply with the regulation, but also flanking transmissions should be taken into account. In addition, in situ measurements could be performed to verify that the building complies with the quality requirements.
All this background leads to the need for prediction tools allowing architects and engineers to evaluate each transmission path and the global behaviour from the design stage. This problem has been studied for long time in Europe [3,4], resulting in the European Standard EN 12354 [5]. This standard presents a simplified method of the SEA model and provides a reasonably accurate prediction [6,7], with the advantage of using usual laboratory results (R, Ln…).
that important differences may appear when using hollow elements, like ceramic bricks or beam and block floors.
Being concerned about this problem, the Building Regulation Department of the Basque Government has launched a research project in collaboration with the Technological Center LABEIN and the CSTB to adapt the EN12354 standard to the Spanish.
EXPERIMENTAL APPROACH
The research (still in progress) has been based on experimental field measurements in different buildings and trying to undertake many different construction elements. The Kij parameter has been measured according to prEN ISO 10848-1 [11] from the known expression:
(1)
where:
- D v,ij = is the velocity level difference (in dB) between elements i and j, when i is excited.
- I ij = junction length between elements i and j
- ai ; aj = equivalent absorption lengths .
Junction velocity level difference measurement using a standard tapping machine and a hammer as excitation sources.
The equivalent absorption length is obtained from the following expression:
(2)
Where:
- Ts,i,situ = is the structural reverberation time (measured in situ).
- Si = is the surface area
- fref = 1000 Hz
i j
ij ji
v ij v ij
a
a
I
D
D
k
×
×
+
+
=
10
log
2
, ,f
f
T
C
S
a
refsitu i s
i situ
i
⋅
⋅
⋅
⋅
=
, , 0
2
,
2
.
bricks. Partition and separating walls were measured, with surface densities (including the plaster layer) from 75 to 250 kg/m2.
A comparison between the measured values and those given in the EN12354 is discussed below.
[image:3.596.91.509.319.520.2]Cross junctions:
Figure 1 shows the flanking-flanking Kij for a lightweight concrete brick wall joined to a beam and
concrete block floor (a) and a hollow ceramic brick wall joined to a similar floor (b). In wall (a) the junction is parallel to the beam direction, while in wall (b) the junction is perpendicular to the beams. It is noticeable that, although in both situations the measured Kij is quite invariant with the frequency (at least in the low-medium frequency range), the measured values are about 5-6 dB higher than those given in the EN12354 (same value in both measurement, as the surface density was the same for both walls). This could be due to the hollow construction of the floor, which leads to a higher attenuation at the joint. The same behaviour has been measured for other combinations of floor and walls. Unfortunately, as the floor ceiling was covered with a plaster layer, it is impossible to assess if the wall was standing over the concrete beam or over the blocks when the wall was parallel to the junction. More work will be necessary to evaluate the effect of the beam position in parallel junctions.
Figure 1: wall to wall transmission (+junction). (a) Junction parallel to the beam direction. (b) Junction perpendicular to the beam direction
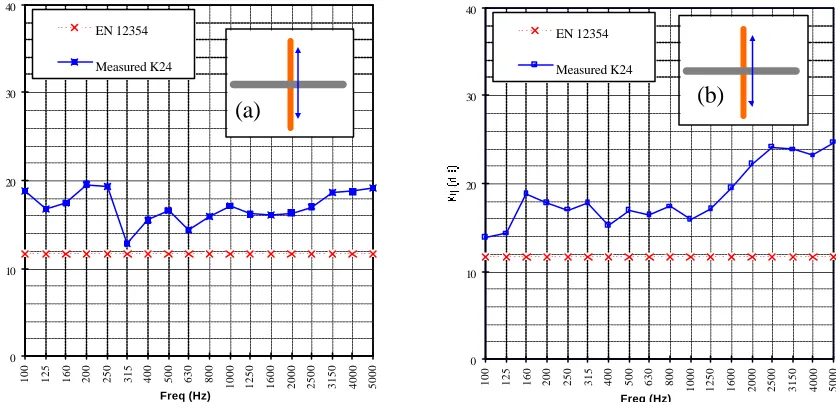
Figure 2 show the same situations, but concerning the floor to floor flanking transmission. In this
situation, important differences can be observed between both junctions. The measured Kij when the junction is perpendicular to the beam (b) presents the same behaviour than those measured for the wall to wall transmission: non-frequency dependence in low and medium freq. range and values about 6dB higher than EN12354. However, the situation with the beams parallel to the junctions (a) shows a Kij decreasing with the frequency, thought the average value is quite similar to the value given in the standard for low frequencies. Similar behaviours have been observed before [9] and could be due to an energy attenuation of the beam and block floors in the beam-perpendicular direction [10].
0 10 20 30 40
100 125 160 200 250 315 400 500 630 800 1000 1250 1600 2000 2500 3150 4000 5000 Freq (Hz)
EN 12354
Measured K24
0 10 20 30 40
100 125 160 200 250 315 400 500 630 800
1000 1250 1600 2000 2500 3150 4000 5000 Freq (Hz)
EN 12354
Measured K24
Figure 2: floor to floor transmission (+junction). (a) Junction parallel to the beam direction. (b) Junction perpendicular to the beam direction
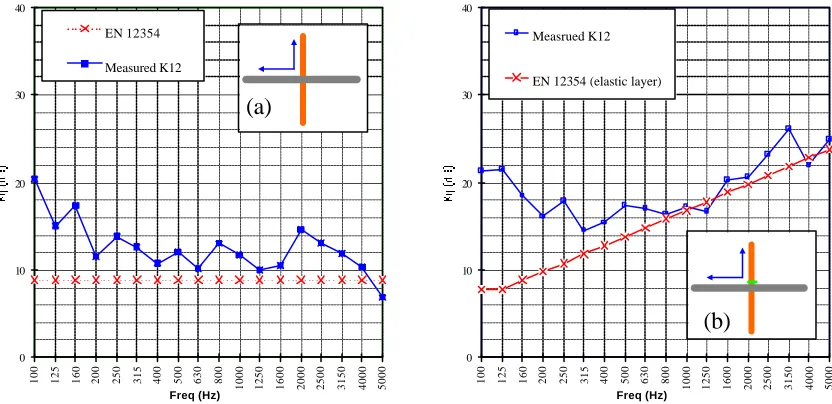
Concerning the angle transmission throughout a cross-junction, figure 3 shows two different situations: (a) hollow ceramic brick wall standing over a beam and block floor (rigidly joined) and a similar situation (b) but with a resilient layer between the wall and the floor (elastic junction).
For the rigid junction (a), once again a systematic deviation between the measured and calculated values has been found, although in this situation the difference is about 2-3 dB, probably due also to the hollow construction.
For the elastic junction (b), very important differences with the calculated values are found (deviations from 6 to more than 10 dB in the low frequency range). These differences at low frequencies can affect decisively the global estimate of the sound insulation, leading to important errors. Anyway these deviations could be due to an inappropriate characterisation of the elastic layer, so here is also another need of researching work.
Walls and beams where parallel in both situations. Measurements carried out in similar conditions but with perpendicular beams and walls showed the same behaviour.
-10 0 10 20 30
100 125 160 200 250 315 400 500 630 800
1000 1250 1600 2000 2500 3150 4000 5000 Freq (Hz)
EN12354
Measured K12
-10 0 10 20 30
100 125 160 200 250 315 400 500 630 800
1000 1250 1600 2000 2500 3150 4000 5000 Freq (Hz)
EN12354
Measured K13
10 20 30 40
Measrued K12
EN 12354 (elastic layer)
10 20 30 40
EN 12354
Measured K12
(a)
(a)
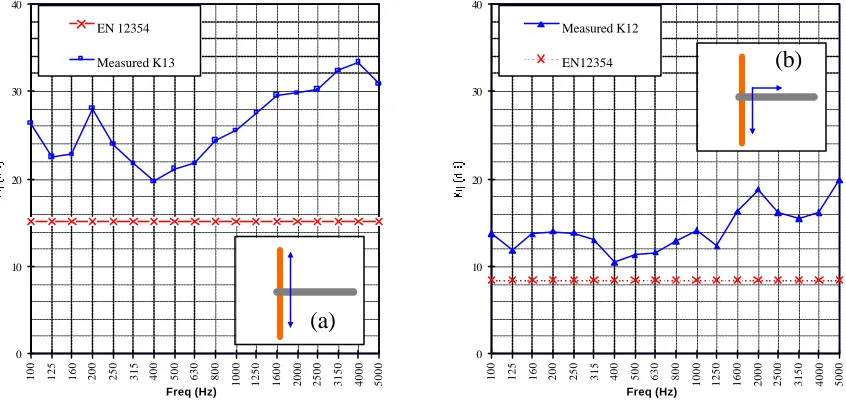
[image:4.596.93.509.536.738.2]Tee junction:
Next figure shows the behaviour of tee junctions involving hollow ceramic bricks and beam and block floors (façade junction). In this situation the wall to wall flanking path is not affected by the beam direction, as façade walls stand always over a solid concrete beam. As can be observed
in figure 5 (a), the wall to wall attenuation across a T junction differs substantially from the
EN12354 calculated data, with differences up to 10dB in low frequencies and even more when increasing frequency.
[image:5.596.88.511.258.460.2]Angle path can be affected by the beam direction. Presented data belongs to a beam direction perpendicular to the façade, and shows (once again) a deviation of about 4dB compared with the EN12354 values. Measurements carried out when the beam direction was parallel to the façade showed slightly smaller differences, about 2-3 dB. In average, the deviations were very similar to those found for the angle path in + junctions.
Figure 4: T junction: (a) wall to wall transmission. (b) angle transmission
CONCLUSIONS
- Significant differences have been found between measured and calculated values in almost all the different junction kinds. This is probably due to the hollow nature of the Spanish constructions.
- The differences are especially important with the transmission involving beam and block floors. Attenuation along the floor could be of great importance.
- Using the European Standard EN 12354 without any modification with usual Spanish
constructions may lead to important mistakes when predicting the noise transmission paths and the global behaviour of a building.
- There is a need to do more research in this field and to validate the accuracy of the CEN models to be able to supply effective tools to the architects and building designers.
0 10 20 30 40
100 125 160 200 250 315 400 500 630 800 1000 1250 1600 2000 2500 3150 4000 5000 Freq (Hz)
Measured K12
EN12354
0 10 20 30 40
100 125 160 200 250 315 400 500 630 800 1000 1250 1600 2000 2500 3150 4000 5000 Freq (Hz)
EN 12354
Measured K13
(a)
ACKNOWLEDGEMENT
The authors gratefully acknowledge the support of the Basque Government for the develop of this project.
REFERENCES
[1] Spanish Building Regulation: Noise in Buildings. NBE-CA 1988
[2] Drafts of the new Spanish Building Regulations. www.codigotecnico.org
[3] R.J.M Craik, Sound Transmission Through Buildings Using Statistical Energy Analysis, Gower (1996)
[4] E. Gerretsen ; T. Nightingale. Prediction models in Building Acoustics (1999).
[5] EN 12354-1,2: Building acoustics - Estimation of acoustic performance of buildings from the performance of elements. Part 1: Airborne sound insulation between rooms; Part 2: Impact
sound insulation between rooms (2000).
[6] Dan B. Pedersen. Evaluation of EN12354 part 1 and 2 for Nordic Dwelling Houses (1999).
[7] H.A Metzen. Accuracy of CEN-prediction Models Applied to German Building Situation
(1999).
[8] Cortés, Azucena ; Craik, Robert J.M. ; Esteban, Alberto. Impact sound insulation:
measurement and prediction in hollow constructions of the Basque Country (2002).
[9] Acoubat v3.1. Technical documentation.
[10] C. Hopkins. Direct and flanking transmission with beam and block floors (2003).
[11] CEN/TC 126 N 284. Acoustics: Laboratory measurement of the flanking transmission of