ISSN 2007-1639
contexto
Revista de la Facultad de Arquitectura
Universidad Autónoma de Nuevo León
Una publicación de la
Universidad Autónoma de Nuevo León
Dr. Jesús Ancer Rodríguez
Rector
Ing. Rogelio G. Garza Rivera
Secretario General
Dr. Ubaldo Ortiz Méndez
Secretario Académico
Lic. Rogelio Villarreal Elizondo
Secretario de Extensión y Cultura
Dr. Celso José Garza Acuña
Director de Publicaciones
M.C. Francisco Fabela Bernal
Director de la Facultad de Arquitectura
Dra. Ma. Teresa Ledezma Elizondo
Subdirectora de la Facultad de Arquitectura
Lic. Ramón Alejandro Barrera Domínguez. Lic. Oneida Martinez Martinez.
Editores Responsables
Lic. Ramón Alejandro Barrera Domínguez.
Diseño
Contexto Revista de la Facultad de Arquitectura Universidad Autónoma de Nuevo León, Año 5. Número 5. Septiembre 2010 - Septiembre 2011. Fecha de publicación: 21 de Septiembre 2011. Revista anual, editada y publicada por la Universidad Autónoma de Nuevo León, a través de la Facultad de Arquitectura. Domicilio de la Publicación: Av. Pedro de Alba S/N, Ciudad Universitaria, San Nicolás de los Garza, Nuevo León, México, C.P. 66451. Teléfono: (81) 83294160, Fax: 83764635 Impresa por: Imprenta Universitaria, Av. Universidad s/n CD. Universitaria, C.P. 66451, San Nicolás de los Garza, Nuevo León, México.
Número de reserva de derechos al uso exclusivo del título Contexto Revista de la Facultad de Arquitectura Universidad Autónoma de Nuevo León, otorgada por el Instituto Nacional del Derecho de Autor: 04-2009-061217153900-102, de fecha 12 de Junio de 2009. Numero de certificado de licitud de título y contenido: 14,912, de fecha 17 de Agosto de 2010, concedido ante la Comisión Calificadora de Publicaciones y Revistas Ilustradas de la Secretaría de Gobernación. ISSN:2007-1639. Registro de marca ante el Instituto Mexicano de la Propiedad Industrial: en trámite.
Las opiniones y contenidos expresados en los artículos son responsabilidad exclusiva de los autores.
Prohibida su reproducción total o parcial, en cualquier forma o medio, del contenido editorial de este número.
Fecha de terminación de impresión: 28 de Septiembre de 2011, Tiraje: 1,500 ejemplares. Distribuido por Universidad Autónoma de Nuevo León a través de la Facultad de Arquitectura. Alfonso Reyes 4000 nte, 5º piso, San Nicolás de los Garza, Nuevo León, Mexico. C.P. 64440.
CONSEJO DE REDACCIÓN
Director de la Revista Dr. Diego Sánchez González Secretario de redacción / Editorial Board Lic. Ramón Alejandro Barrera Domínguez
Secretario de intercambio y redes / Exchange and nets secretary Lic. Oneida Martínez Martínez
Consejo Editorial / Board Editorial
Dra. Dulce María Barrios y Ramos García (UNAM, México) Dra. Carmen Egea Jiménez (Universidad de Granada)
Dra. Irma Laura Cantú Hinojosa (Universidad Autónoma de Nuevo León) Dra. María S. Arzaluz Solano (Colegio de la Frontera Norte)
Dr. Richard Hartwing (Texas A&M University-Kingsville)
Dr. Eduardo Sousa González (Universidad Autónoma de Nuevo León) Dr. Jeffrey S. Smith (Kansas State University)
Dr. Adolfo B. Narváez Tijerina (Universidad Autónoma de Nuevo León) Dr. Diego Compán Vázquez (Universidad de Granada)
Dr. René Coulomb Bosc (Universidad Autónoma Metropolitana) Dr. Armando V. Flores Salazar (Universidad Autónoma de Nuevo León) Dr. Michael A. McAdams (Fatih University)
Dr. Jesús A. Treviño Cantú (Universidad Autónoma de Nuevo León) Dr. Rubén Hernández -León (Universidad de California, Los Ángeles) Dr. Rubén Salvador Roux Gutiérrez (Universidad Autónoma de Tamaulipas) Dr. Rafael Longoria (Universidad de Houston)
Dr. Alfredo Palacios Barra (Universidad del Bio Bio) Dr. Javier Iván Soledad Suescún (Universidad de Pamplona) Dr. Alejandro García García (Universidad Autónoma de Nuevo León)
Distribución / Distribution: Editorial Universidad Autónoma de Nuevo León. Padre Mier Pte. 909. Col. Centro. Monterrey, Nuevo León, México. CP. 64000.
Impreso en México. Todos los derechos reservados
©Copyright 2011
Noticias y comentarios
49
27
Visión Social del Urbanismo: de la teoría a la práctica.
Alfredo Palacio Barra
Economía, empleo y productividad en las metrópolis de México
.
Edel Cadena Vargas / Guadalupe Hoyos Castillo / Juan campos Alanis
65
Medio ambiente y el uso del suelo soporte de decisiones de planificación
del Sistema: Un ejemplo de aplicación
Ardeshir Anjomani,*Ali Saberi and Naveed Shad.
Contexto del urbanismo y ordenación del territorio desde la perspectiva social
Diego Sánchez González
Contenido.
El impacto de la rotación de personal en las empresasconstructoras
del estado de Nuevo León.
Ana Ramona Cabrera Piantini ,Nora Livia Rivera Herrera María Teresa Ledezma Elizondo
83
9
Artículos
Reseñas
Entrada al Diseño: Juventud y Universidad
Jesús A. Treviño C.
93
97
La incorporación del valor público a la propiedad privada
en la prácticadel valuador.
Adolfo Benito Narváez Tijerina.
Presentación
5
El imaginario urbano eurocéntrico y la anticiudad utópica de Wright.
33 03
49
Reviews
Economy, employment and productivity in the metropolis of Mexico
.
Edel Cadena Vargas ,Guadalupe Hoyos Castillo, Juan Campos Alanis
65
Enviroment and land use decision support
System planning: An example of application
Ardeshir Anjomani,*Ali Saberi and Naveed Shad.
The Eurocentric urban imaginary and utopian against-city of Wright.
Adolfo Benito Narváez Tijerina
The impact of staff turnover in companies construction
of the state of Nuevo León.
Ana Ramona Cabrera Piantini , Nora Livia Rivera Herrera María Teresa Ledezma Elizondo
83
Presentation
5
News and Comment
27
Context of urban and regional planning from a social perspective.
Diego Sánchez González
97
The incorporation of public value to private property appraiser’s practice.Adolfo Benito Narvaéz Tijerina
93
Entrance to the design: Youth and CollegeJesús A. Treviño C.
Articles
9
Urban Social Vision: from theory to practice.
Diego Sanchez-Gonzalez*
Del estado del arte a la práctica
El siglo XXI comienza con la urgente necesidad de acometer las transformaciones en las regiones urbanas de los países desarrollados y, sobre todo, en los países en desarrollo, en un contexto de Cambio Climático y Globalización, imbuidos por una crisis económica global sin precedentes.
La región de América Latina y el Caribe, como exponente del modelo de crecimiento urbano no planificado e insostenible, se enfrenta a la incertidumbre de afrontar y gestionar los crecientes riesgos naturales y sociales (Sánchez-González, 2011b), la discriminación de las minorías y grupos sociales vulnerables, c o m o l o s n i ñ o s , a d u l t o s m a y o r e s , discapacitados, indígenas, inmigrantes, entre otros.
El desafío consiste en superar visiones parciales y escalas espacio-temporales inadecuadas para posibilitar la comprensión de la compleja y convulsa realidad socioespacial urbana y territorial, que demanda superar el predominio de los estudios excesivamente descriptivos y posibilitar investigaciones analíticas que contribuyan al cambio anhelado (Hiernaux y Lindón, 2006; Sánchez-González y Egea-Jiménez, 2009).
En las ciudades mexicanas y, en general de América Latina, se ha experimentado un a g r a v a m i e n t o d e l a s h e t e r o g é n e a s desigualdades socioespaciales y de la pobreza u r b a n a , l o q u e s e h a d e n o m i n a d o “urbanización de la pobreza” (Lozano, 1997). Este escenario actual es propicio para discutir sobre los temas prioritarios de la ciudad, donde el urbanismo social es una respuesta a las complejas cuestiones sociales, que deben ser El siglo XVIII vio nacer una sociedad
contemporánea urbana e industrial, aquejada por los incipientes conflictos socioespaciales que, 250 años después, el vigente modelo de crecimiento económico y demográfico global no solo no ha conseguido minimizar sus efectos colaterales, sino que se han visto seriamente agravados, planteando la necesidad urgente de discutir la esencia misma de un modelo en crisis (Ramírez-Vázquez, 1995).
En las últimas décadas la preocupación por la cuestión urbana han desembocado en la proliferación de estudios sobre urbanismo, planificación urbana y ordenación del territorio, cuyas temáticas y metodologías han experimentado cambios significativos. Las transformaciones territoriales y sociales han favorecido el desplazamiento de temas tradicionales, dando cabida a nuevas exigencias sobre los recientes escenarios urbanos, metropolitanos y regionales, donde son reseñables las contribuciones desde e n f o q u e s t e ó r i c o s y m e t o d o l ó g i c o s disciplinarios e interdisciplinarios, para la comprensión de la ciudad y su territorio. Asimismo, este resurgir de lo urbano ha propiciado la crítica y la necesaria discusión a partir de la redefinición de los conceptos y la relectura de diferentes autores clásicos desde h e t e r o g é n e o s p o s i c i o n a m i e n t o s epistemológicos (Castells, 1978; Borja y Castells, 1997).
El paradigma actual de nuestra sociedad es comprender y discutir las diferentes teorías sobre los retos de los asentamientos humanos y sus regiones, a través de distintas aproximaciones al urbanismo y la ordenación del territorio (Sanchez-Gonzalez, 2011a).
*Doctor en Geografía por la Universidad de Granada (España). Profesor-Investigador Titular de la Facultad de Arquitectura de la Universidad Autónoma de Nuevo León y Miembro del Sistema Nacional de Investigadores, CONACYT (México). Correo: [email protected]
Contexto del urbanismo
y ordenación del territorio
desde la perspectiva social
contexto septiembre 2011 06
comprendidas en un contexto de agravamiento de las áreas metropolitanas, marcadas por la segregación socioespacial de las periferias y centros históricos degradados.
El análisis de los asentamientos humanos y sus regiones permite discutir sobre los c o m p l e j o s p r o c e s o s s o c i o e s p a c i a l e s derivados de la huella indeleble de los heterogéneos escenarios surgidos de la estructura urbana y la conformación y participación desigual de los diferentes actores sociales en un contexto de crisis política, económica y medioambiental.
Los verdaderos protagonistas de la literatura contenida en estas páginas son los espacios urbanos y, sobre todo, los ciudadanos anónimos, que con mayor o menor representación, se disputan y padecen los desequilibrios de la ciudad. Es necesario propiciar un urbanismo social donde los ciudadanos son personas conscientes con derechos y deberes, actores validos, necesarios e irremplazables en un complejo mecanismo de intereses, donde está en juego el futuro de la construcción de los asentamientos humanos. Para ello, será imprescindible cambiar la forma de cómo vemos, estudiamos y vivimos las urbes, reivindicando el derecho inalienable a la ciudad, a través del ejercicio de la planificación urbana y la ordenación del territorio.
Las contradicciones gestadas a la sombra de la crisis económica mundial propician el debate sobre los verdaderos intereses de la centralidad de las políticas urbanas, demasiadas veces supeditadas al capital. La crisis del capitalismo pone de relieve la dependencia y el uso desmedido e irracional del territorio, especialmente a través de la especulación del suelo urbano, y favoreciendo la segregación y desigualdad social.
a través de diferentes aproximaciones de las ciencias sociales y humanidades, tales como urbanismo, geografía, economía y sociología. En el material publicado se expresan un conjunto de reflexiones y estudios relativos a los conflictos socioespaciales en el escenario urbano de Estados Unidos y América Latina, donde la ciudad es presentada como un proceso de construcción social, determinada por diferentes crisis políticas, sociales, económicas, culturales y medioambientales.
El primer artículo, realizado por Ardeshir Anjomani, Ali Saberi y Naveed Shad, del University of Texas at Arlington, Estados Unidos, se centra en el empleo del modelo de Sistema Espacial de Soporte de Decisiones (SDSS) en la planificación del territorio y medio ambiente, a través del uso de los Sistemas de Información Geográfica. Mediante un estudio de caso, se presenta un modelo para el análisis y desarrollo de alternativas en la gestión del uso del suelo en la periferia de las áreas metropolitanas. El estudio defiende el uso de un modelo de optimización que permita reducir costos y efectos negativos, a partir de un enfoque más sensible con los recursos del medio ambiente. El modelo proporciona un índice que permite a los planificadores y tomadores de decisiones conocer la magnitud del ahorro de los costes relativos, y favorecer la planificación de las áreas metropolitanas y sus regiones.
A continuación, Alfredo Palacio, de la Universidad del Bio Bio, Chile, nos presenta una visión social del urbanismo en América del Sur, concretamente en Chile. Partiendo de concepciones teóricas gestadas en las c i e n c i a s s o c i a l e s , s e a n a l i z a l a s contradicciones de la evolución y situación actual del urbanismo chileno, anclado en la legitimación del discurso del Bicentenario de la Independencia. Un debate ineludible que no
En este escenario complejo y convulso surge la necesidad imperiosa de llevar y defender el discurso académico en el escenario de la política, como formula para corregir los profundos desequilibrios socioespaciales gestados en las áreas metropolitanas y favorecer un modelo socializador de construcción de las urbes y sus regiones. El quinto número de la revista Contexto se centra e n l a cuestión urbana y su región,
elude la crítica, en un contexto de hacer frente a los paradigmas de la globalización y la necesidad de propiciar un urbanismo socialmente comprometido.
07
Borja, J. y Castells, M., (1997), Local y global. La gestión de las ciudades en la era de la información. Madrid: Editorial Taurus. Castells, M., (1978), La cuestión urbana. México: Siglo XXI Editores.
Hiernaux, D. y Lindón, A. (dir.), (2006), Tratado de Geografía Humana. Barcelona: Editorial Anthopos.
Lozano, W., (1997), La urbanización de la pobreza. Santo Domingo: Facultad Latinoamericana de Ciencias Sociales. Ramírez-Vázquez, P., (1995), Ramírez Vázquez en el urbanismo. México: Instituto Mexicano de Administración Urbana.
Sánchez-González, D., (2011a),"Reflexiones sobre Geografía Urbana, Urbanismo y Ordenación del Territorio en países en desarrollo. El caso de México", en Sánchez-González, D., Ledezma Elizondo, María Teresa; y Rivera Herrera, Nora Livia (coord.): Geografía Humana y crisis urbana en México. Monterrey, México: Universidad Autónoma de Nuevo León, pp. 15-36.
Sánchez-González, D., (2011b), "Precipitaciones extremas y sus implicaciones en procesos de remoción en masa en la planificación urbana de Tampico, México", en Cuadernos Geográficos, Nº 48, 2011-1, Abril-Septiembre, Granada: Editorial Universidad de Granada, pp. 135-159.
Sánchez-González, D. y Egea-Jiménez, C., (2009), "Vulnerabilidad sociodemográfica y ambiental, viejos y nuevos riesgos", en Cuadernos Geográficos, Nº 45, 2009-2, Granada: Universidad de Granada, pp. 9-10.
El trabajo analiza distintas bases de datos oficiales para posibilitar la comprensión de las diferencias regionales en materia económica de las 56 zonas metropolitanas del país. Los resultados permiten comprender dos procesos presentes y antagónicos en las urbes mexicanas: el aumento del crecimiento demográfico y el progresivo estancamiento del dinamismo económico de las mismas en materia de empleo y productividad.
El cuarto artículo es autoría de Adolfo Benito Narváez, de la Universidad Autónoma de Nuevo León, México, quien aborda el problema de los imaginarios urbanos en un contexto de crecimiento urbano a nivel global. El autor parte de los planteamientos teóricos sobre la ciudad utópica del celebre arquitecto estadounidense Frank Lloyd Wright (1867-1959), uno de los principales exponentes de la arquitectura del siglo XX y conocido por la arquitectura orgánica y funcional de sus diseños. El diseño de Broadacre City (1930-1935) es un proyecto experimental, influenciado por la Ciudad Jardín y la idea de la descentralización, que se convirtió en una critica al congestionamiento urbano y a la planificación urbana moderna, que ha tenido una enorme trascendencia en la forma de leer y entender la ciudad del siglo XX, y está materializada en algunos elementos visibles en los procesos de creación de las ciudades redes a nivel planetario en el presente siglo XXI.
Asimismo, en la sección Noticias y Comentarios se presenta una síntesis de un trabajo realizado por Ana Ramona Cabrera, Nora Livia Herrera y María Teresa Ledezma, de la Universidad Autónoma de Nuevo León, México, sobre el impacto de la rotación del p e r s o n a l l a b o r a l e n l a s e m p r e s a s constructoras en el área metropolitana de Monterrey, México.
El presente número incluye dos interesantes novedades editoriales, el libro Entrada al Diseño. Juventud y Universidad (2009) de Luis Porter, editado por la Universidad Autónoma Metropolitana, y reseñado por Jesús Antonio Treviño, de la Universidad Autónoma de Nuevo León, México; y el libro Emulación del valor inmobiliario y dinámica territorial (2010) de Jesús Manuel Fitch, editado por la Universidad Autónoma de Nuevo León y la Universidad Politécnica de Cataluña, y reseñado por Adolfo Benito Narváez, ambos de la Universidad Autónoma de Nuevo León, México.
Este número de Contexto incorpora artículos y trabajos de notoria actualidad y relevancia teórica y empírica, que favorecen la discusión teórica y metodológica, así como permiten contribuir a la comprensión del fenómeno urbano y su territorio. El comité editorial de Contexto y la Facultad de Arquitectura de la Universidad Autónoma de Nuevo León afirman su compromiso de contribuir al desarrollo y divulgación de la investigación sobre arquitectura y asuntos urbanos y regionales desde los diferentes campos disciplinarios e interdisciplinarios de las ciencias sociales y humanidades a nivel nacional e internacional.
Los resultados, basados en una muestra de 17 estudios de caso, plantean la hipótesis de que la rotación del personal en el sector de la construcción está relacionada con la productividad y la eficiencia de las empresas. La precariedad en el empleo, asociada a los bajos salarios y la informalidad, así como a la ausencia de programas de capacitación, entre otros factores sociolaborales, favorece la rotación de personal, repercutiendo en la baja productividad y eficiencia del sector en la región.
33 09
This paper deals with land use/environmental planning problems and describes the application of an innovative planning approach to develop alternative land use solutions. It provides an implementation example of a framework that can be applied to a variety of complex environmental and land use planning problems. The paper first briefly introduces an analysis process and a related Spatial Decision Support System (SDSS), which utilizes GIS and optimization models, both of which were developed in previous works.
Then it attempts to demonstrate how the process and the SDSS can be used in real world situations to help in analysis and planning of spatial distribution of activities.
This is accomplished by applying the innovative land-use planning approach to an area located in the fringe of a thriving metropolitan area, which encompasses a newly developed lake and major thoroughfares.
K e y w o r d s : e n v i r o m e n t a l p l a n n i n g , optimizatión, development, processes.
Enviromental and land use Planning
decision support system: An
application example.
Este artículo trata sobre el uso del suelo / problemas de planificación ambiental y se describe la aplicación de un enfoque de planificación innovador para desarrollar soluciones alternativas de uso del suelo. Se proporciona un ejemplo de implementación de un marco que se puede aplicar a una variedad de complejos problemas de la planificación ambiental y uso de la tierra.
El primer artículo presenta brevemente un proceso de análisis relacionados con el sistema espacial de soporte de decisiones (SDSS), que utiliza modelos de SIG y de optimización, los cuales se han desarrollado en trabajos anteriores. A continuación, se intenta demostrar que el proceso y el SDSS se pueden utilizar en situaciones del mundo real para ayudar en el análisis y la planificación de la distribución espacial de las actividades. Esto se logra mediante la aplicación del innovador uso de la tierra enfoque de planificación de una zona situada en el borde de una próspera área metropolitana, que incluye un lago de nuevo desarrollo y las principales carreteras.
Palabras clave: planificación ambiental, optimización, desarrollo, procesos.
* Professor at the School of Urban and Public Affairs, University of Texas at Arlington. Professor Anjomani holds a Ph.D. and M. P. from University of Southern California, and a M. Arch from University of Tehran. Dr. Anjomani's research interests include urban and regional economics, economic development and developing countries, research and analytical technique, analysis of urban development, transportation planning, land use analysis and modeling, land use planning and urban design, and use of GIS technologies for spatial analyses. Email: [email protected]
Resumen
Abstract
Ordenación Ambiental del Territorio
sistema de apoyo a la decisión: Un
ejemplo de aplicación.
oday p l a n n e r s deal with many complicated issues, such as land use a n d environmental problems. Many of the problems arising from these issues are too complex to be solved by a purely speculative approach based on experience, intuition, and imagination. On the other hand, an inductive analytic approach based solely on a detailed study of the problem is also insufficient. A more effective approach involves including elements of the two approaches in a scientific process based on a combination of experimentation, observation, and explanation.
This paper provides an implementation framework of this more effective approach which can be applied to a variety of complex environmental and land use planning problems.
This example uses a Spatial Decision Support System (SDSS) which integrates optimization models, Geographic Information Systems (GIS), and the knowledge and expertise of the planner-analyst. The planner-analyst also incorporates the community's wants and values into the planning process. The framework integrates the existing and recently developed ideas and theories into the SDSS
The goal of this Spatial Decision Support System (SDSS) is a more sensitive approach to land use planning which considers environmental and other important issues. The SDSS also strives to make use of technological advances to overcome some of the traditional problems and important non quantifiable considerations in land use planning.
The potential of the Spatial Decision Support System will also be investigated by applying it to a real-world situation.
The land use study presented can be used as a prototype by professional planners involved in a variety of related spatial problems, such as regional planning, location analysis, environmental planning, and landscape design problems of macro and micro scale.
Introduction
With U.S. cities expanding rapidly beyond traditional urban centers, concern surfaced about the urbanization of the rural landscape. In 1970, popular support for improving environmental quality and mitigating future land impacts led to the enactment of the National Environmental Protection Act (NEPA). In more recent years, local and regional efforts have begun to recognize the effect of land use on the quality of the environment, and improved land use has resulted in a reduction of environmental hazards and land use conflicts. Efforts in the United States and Europe started basing land use decisions on land resources. Ian McHarg (1969) based a comprehensive plan for the development of an entire region on e n v i r o n m e n t a l a n d l a n d r e s o u r c e characteristics.
McHarg also used land suitability analysis by applying overlaying map techniques.
McHarg (1969) used the traditional suitability analysis both for analysis of a highway location and also for land use planning for Staten Island which popularized the technique. With the advent of the computer and ever abundant digital data the analysis technique has evolved and has been integrated as one of the major component of GIS (for overview of the land use suitability analysis technology and projects see Collins et al., 2001). However, according to Jiang et al. (2000), "it is widely recognized that GIS still needs integration of new analysis and modeling methods if it is to achieve its potential as a general-all-purpose tool for environmental and urban planning" (in this point see also Goodchiled, 2000).
Integrating GIS and suitability analysis with other land use related emerging fields such as agent based modeling and land-cover change is a newer development first discussed by Gimblett (2002) and Westervelt (2002). (Also see Brown et al., forthcoming.) Similarly, land use change and land use dynamics is a more recent interest and have captured attention of several researchers including Veldkemp and Verburg (2004) and Verburg and Veldkemp (2005).
Background
Early in the 20th century the impact of human activity on the environment became an issue with physical scientists.
T
1
33 11
The question today is:
Can spatial arrangements of land use be found that yield significant improvements in energy consumption, ecological stability, or agricultural production? This question can be answered only by comparing existing patterns to the best known patterns.
As a step toward determining optimal land use patterns, Anjomani (1984 and 1992) suggested applying optimization models in the suitability analysis stage of the land use planning process, instead of the traditional overlaying map technique or its new variants as one of the major functions of the GIS packages.
He argued that because traditional suitability analysis and related GIS applications do not consider demand, the results are not useful. To achieve results that consider demand, he suggested applying an optimization model as a relatively simple or more sophisticated optimization models. These models are special type of linear or quadratic programming models (Mirchandani and Francis, 1990).
Replacing the overlay technique in suitability analysis with these type of models is important for several reasons, some of which will be discussed in this paper.
At this point, however, the significance of this replacement in relation to GIS should be discussed. GIS is becoming an indispensable part of any spatial analysis because of its important attributes and capabilities.
Given the technological advancements of the past two decades, especially in regards to information and computer technology, it is only natural that GIS will also become an indispensable part of planning activities.
GIS's spatial analysis functions, such as overlays, buffers, measures of contiguity, and the like, along with the facilitation of data manipulation, analysis, and display and was demonstrated by Albers (1991), Miller et al. (1998) and others make GIS a necessary tool for every land use/environmental analysis.
All the features offered by GIS are needed in different stages of the land use/environmental planning process such as the one used in the proto-type example in this paper, however, our discussions are concentrated more around the suitability analysis aspects of GIS.
The suggestion to replace the overlay technique with the optimization model in suitability analysis is not intended to undermine the use of GIS for land use/environmental planning. What is needed, however, is a consensus on the best technique for suitability analysis. The technique can then be included in planning related GIS packages. Indeed, similar developments in facility location analysis have already resulted in the inclusion of similar optimization models in some of the G I S p a c k a g e s s u c h a s A R C / I N F O , (Environmental Systems Research Institute [ESRI], Redlands, California, USA).
This article will attempt to briefly demonstrate the superiority of the proposed optimization model.
GIS has also been a very useful tool in applying suitability analysis.
The combination of this feature with the functions and facilities mentioned above makes GIS a unique tool for land use/environmental planning.
Currently, the allocation of land resources for human uses is seen as critical to ecological stability and energy conservation.
This article will attempt to briefly demonstrate the superiority of the proposed optimization model. Recent advances in computer technology have greatly improved methods and models and their potential applications in planning. Two examples of this methodology are optimization models (Mirchandani and Francis, 1990) and (GIS) (Tomlin, 1990, Huxhold, 1991). Both approaches have characteristics that make them useful for a variety of applications. Harris (1988) encouraged the use of GIS in conjunction with analytic models, and Harris and Batty (1993) suggested linking GIS to models used in the planning process.
Anjomani and Saberi (1992) proposed a Spatial Decision Support System (SDSS, see Dansham, 1991 and Greenman and Stillwell, 2002).
The overlaying map technique has been the traditional method for suitability analysis. Hopkins (1977) provided a useful overview of suitability analysis, and some of the variants are provided by GIS software. Anjomani (1984) argued that the overlaying map technique only deals with the supply-side (i.e., which land is good for what use) without considering the demand-side (i.e., how much of each use is needed). As a result, the analysis normally shows oversupply of some uses and undersupply, or even lack of, other uses. This leads planners to select an area for a use in a less optimal location, or to not select a use in a more optimal location.
Our previous studies concluded that the results of conventional suitability analysis can be misleading .2
12
Figure 1
An optimization model was used in the optimization phase, and GIS was used for visualization, planning analysis, and data manipulation. This paper will examine and evaluate the applicability of this process and the SDSS in solving the problems of allocating land uses and preserving environmentally sensitive areas. The SDSS will be applied to a lakeside suburban area in the Dallas Fort Worth metropolitan and will provide details of how such a process can be applied in a real setting. Before describing the example, however, a summary review of the theoretical framework and the model will be discussed.
Suitability Analysis is the traditional method for determining land use allocation, and is a major stage in the Chapin and Kaiser (1979) seven-stage and Kaiser et al. (1995) five-step land-use planning process. The main purpose of suitability analysis is to find the most suitable land area for each land use under consideration. The results of suitability analysis "are used as input to the land use design process and they help suggest more optimal spatial allocation of future urban activities and open space" (Chapin and Kaiser, 1979, p. 291).
Theoretical Framework
environmental factors, this SDSS has four major components: 1) data manipulation, 2) an optimization phase to replace the overlaying t e c h n i q u e o f s u i t a b i l i t y a n a l y s i s , 3 ) visualization, graphic analysis, and mapping (Ducrot et al., 2004), and 4) interaction with SDSS by the planner/analyst to manipulate and improve the results.
Suitability Analysis is the traditional method for determining land use allocation, and is a major stage in the Chapin and Kaiser (1979) seven-stage and Kaiser et al. (1995) five-step land-use planning process.
13
To overcome this problem he suggested use of an optimization model. In particular, he suggested an optimization model that considers the demand for land uses and maximizes the total net effects (or minimizes the total negative effects) , as opposed to maximizing or minimizing the effect of each individual parcel as was commonly done in deriving composite effects in traditional overlay techniques. Furthermore, the total cost figure of the optimization model provides a measure that can guide the planner in selecting alternatives or evaluating suggested changes at the later stages in the development process, based on observed cost increases or decreases.
Our previous studies discussed the need for a method of measuring the effect that proposed changes in zoning would have on the outcome for the areas as a whole and the need for a more precise land-use plan.
Also, it was asserted that land use planning "is a special process that a planner/analyst goes through using his/her tools, intuition, and knowledge;" and therefore, deriving one shot results from any particular tool or model for land-use/environmental planning is unrealistic.
3
The process for use of the model in large-scale planning has been suggested in previous related studies as summarized below:
Stage 1: Data manipulation and preparation of final ratings. Application of the optimization model to derive the first optimum solution. Anjomani also argued that the overlaying map technique minimizes the negative effects for individual parcels, rather than for the whole area under study; and therefore, the results are not globally optimal.
Furthermore, since different tools require different ways of doing things, today's c o m p u t e r i z e d m e t h o d s n e c e s s i t a t e modification of the process itself. As such, a main part of the SDSS is a planning process which employs the suggested optimization model as a tool in different planning stages which is used repeatedly and iteratively inside this process; therefore, the results from the optimization model are not final by themselves and gradually improve through the application of the process.
Stage 2: Preparation of a general thoroughfare plan.
Stage 3: Overcoming the problems in the first
o p t i m a l s o l u t i o n b y c o n s i d e r i n g t h e thoroughfare plan, design and community's
input.
Stage 4: Checking the plan with respect to the problems discussed above.
Stage 5: Overcoming the problems by design
inputs and by incorporating the intuition and expert knowledge of the planner.
Stage 6: Manipulating the data based on improvements (removal of the related data for cells that do not need improvements) and running the optimization model again.
Stage 7: Repeating Stages 3 through 6 until the results become satisfactory.
Stage 8: Further refining the results and applying the process to major sub-regions and different jurisdictions of the study area.
This process will fine-tune the plan to the needs of different localities so that it realistically reflects the situation. More details about this process will be presented in the application example.
If the suitability of an area for a particular use is assumed to be a linear function of several factors, such as soil condition, slope, accessibility, etc., then the development suitability of location i for land use j, Sij, can be represented as:
Sij = b1 F1ij + b2 F2ij + b3 F3ij + .... + bk Fkij (1)
or
Sij = k bk Fkij (2)
where F 's are ratings of each factor according to the degree of its effects, positive or negative, on each of the selected land uses, j ; and b' s are coefficients, measuring importance (weight) of the k selected factors, F ‘s, in determining suitability of location i for land use j . Multi criteria evaluation techniques (Saaty 1980,
14
Since the suitability scores for each land use, Sij's, are, in a sense, representing overal negative or positive effects of the factors on land uses. In deriving the composite suitability of all land uses, therefore, the goal of the overlaying map technique can be achieved by selecting the land use with the smallest cost score (or, the highest net benefit score) for each cell. Anjomani (1984) criticized this technique, and, suggested using an optimization model which uses Sij to derive suitabilities with global optimization and demand consideration. (For further information on optimization models see Mirchandani and Francis, 1990, and on linear programming see Killen, 1983).
Barber (1976) formulated a land-use plan-design model as a multi-criterion problem and used the same village that Schlager used as a case study to illustrate the application of the model in twenty four zones. Brotchie et. al (1973) proposed a model that determined least-cost allocation of activities to zones. Gordon and McReynolds (1974) formulated a model of optimal urban form which used an optimization model and applied it to the Los Angeles metropolitan area which was divided to 30 study zones. Churieco (1993) attempted to integrate linear programming and GIS for land use modeling purposes. Even though these studies were land-use related, none of them were used for suitability analysis, and only a few used similar models.
Voogd, 1983, Massam, 1988 and 1992 and Malczewski, 1999) can be used to determine the importance weights (b). Anjomani (1984) suggested use of the Delphi technique (Lindstrom and Turoff, 1977) to derive the coefficients. This technique is used in the application described in this paper.
When these coefficients are derived, data are collected for factors and encoded for each zone of the study area and each land use and their ratings are prepared accordingly. Suitability scores for each land use, Sij's, can then be calculated by multiplying coefficients and the related factor rating scores. They are then summed up as shown in equations 1 and 2.
Optimization and the Model
Optimization models have been used in previous land use studies by several researchers (for review of these works see Van Ittersum et al. (1998) and Briassoulis (2002). Herbert and Stevens (1960) formulated a residential model which placed households in different socioeconomic groups based on their choice of housing type.
The location of each housing type was based on maximizing the difference between the housing budget and the cost of housing. This resulted in the allocation of households in an optimal configuration. In 1965, Schlager f o r m u l a t e d o n e o f t h e f i r s t a p p l i e d mathematical programming models as a land-use plan-design model. His model minimized the cost of land development in the study area while meeting the development demands and other constraints.
Furthermore, most used a much smaller number of zones (usually below 50), and the zones were much larger in size with a combination of different land uses.
The variants of optimization models which can be used for the purpose at hand normally selects land parcels with a minimum resource loss (or maximum net effects) for the proposed activities. In simplified terms, the cells with the least resource (or dollar) losses were selected first. Additional sites were selected sequentially with higher and higher losses until all the cells were filled with the specified activities. Similarly, the variant of the optimization model presented in this paper selects the cells with the least resource losses so that the proposed development area (33,027 cells) is filled with the seven land uses to a pre-specified limit based on the demand for particular land uses. Let Xij stand for the allocation of land use j to cell i where i = 1,...., 33,027, in our application example explained below, and j is the selected land use category according to the demand in the application example. If land use j , allocated to cell i, Xij will take the value of 1; otherwise, Xij will take the value of 0, which indicates land use i is not allocated to cell j . As such, Xij is the solution matrix for the land use problem as formulated in the optimization model:
Z = i j Sij Xij (3)
i Xij = Mj for all j's, j=1, 2,....,7 (4)
j Xij = 1 for all i's, i=1, 2,...., 33,027 (5)
Xij = 0 or 1 for all j's (6) Maximize
Subjet to
33 15 Z is the total net benefit for the area as a whole.
M represents the demand for each use, as explained in the next section, for the seven land uses of low, medium-low, and medium-high density residential; low and high intensity commercial; light industrial; and open space; respectively. The set of constraints (equations 4 to 6) is needed to constrain land use to only one land use allowed to be allocated to a cell. The objective function to be optimized is a function of suitability indices Sij whose values record the suitability of assigning use i to cell j
as discussed before.
It is important to note that the net benefit (cost) indicator from the model output, Z, will determine the total benefits or net effects (cost or negative effects) of the final solution in relative terms. In addition, it also provides a helpful device for comparing alternatives, since an alternative with a "less cost" indicator is normally preferred to one with a "more cost" indicator.
Application Example
As previously mentioned, the process of land use allocation is determined by the interaction between the model and the planner analyst. The allocation model seeks to minimize the overall costs of development (or to maximize the net positive effects), whereas the planner-analyst seeks to improve the relationships between activities and bring intuitive considerations, community values and desires, and other important aspects into the plan. This interactive process leads to the creation of a discrete number of alternatives for land use allocation.
In one stage of the interaction process the planner traces the street network for each of the alternatives. Proposed roads are most commonly the subject of this combined land use thoroughfare analysis.
At this stage the planner selects the least-cost or least-environmentally-impacted corridors between points. Costly parcels are set aside, and favored areas are selected and entered into the computer to form the basis for progressive interactive searches.
The study area described in this paper surrounds the newly developed Joe Pool reservoir lake in the Dallas Fort Worth metropolitan area.
The study area encompasses six city jurisdictions and covers approximately 87,400 acres. For the purpose of this analysis, the study area is divided into 33,027 individual grid cells. This total number of cells is also reflected in equation 5 of the optimization model.
The first phase in applying the Spatial Decision Support System (SDSS) to the lakeside setting involves data collection and manipulation based on Anjomani (1984) and Turner II et al. (1995). Six environmental land features--soil strength, soil stability, flooding and drainage, visual resources, slope and tree coverage; and four man made land features--proximity to major sanitary sewer lines, access to major Six environmental land features--soil strength, soil stability, flooding and drainage, visual resources, slope and tree coverage; and four man made land features--proximity to major sanitary sewer lines, access to major highways, proximity to water lines, and compatibility of adjacent existing land use were selected as major factors affecting land development. These factors were then inventoried within each of the cells of the study area and encoded for each cell. When these were completed for all cells, it was necessary to rate each land feature according to its effects for each of the selected land uses.
The selected land uses were low density, medium low density, and medium high density residential, low intensity and high intensity commercial, light industrial, open space, and road location.4 However, road location was used only for preparing the thoroughfare plan and road locations. Land features (factors) and land uses used in the study are shown in Table 1.
16
TABLE 1: LAND FEATURES (FACTORS) AND LAND USES USED IN THE STUDY
Environmental Man-Made
Land Features
Land Features
Land Uses
1-Soil Strength 1-Proximity to Sewer Lines 1-Low Density Residential
2-Soil Stability 2-Access to Major Highway 2-Medium-Low Density
Residential
3-Flooding and Drainage 3-Proximity to Water Lines 3-Medium-High Density
Residential
4-Visual Resources 4-Compatibility with Adjacent 4-Low Intensity Commercial 5-Slope Existing Land Use 5-High Intensity
6-Tree Coverage 6-High Industrial
7-Open Space
The importance weight for factors (the b coefficients in equations 1and 2) are need to be determined at this stage. Banai (1993) and Wu (1998) use analytic hierarchy process. In this application, as mentioned earlier, the weights for factors were obtained using the Delphi technique. (Lindstone and Turoff, 1977). This technique was used to determine the importance weights of each factor for each land use. A group of knowledgeable persons not involved in the plan development were selected as experts and surveyed to determine the relative importance of the factors. The purpose of the repeated rounds of Delphi surveys was to reach a consensus among the experts in weighting the factors.
The purpose of the repeated rounds of Delphi surveys was to reach a consensus among the experts in weighting the factors. During the course of these surveys, the experts had the opportunity to compare their responses with those of other experts and to make changes accordingly or to offer a rationale for their choices.
Because in the Delphi technique the anonymity of the experts is maintained, the experts are able to make their responses without any undue pressure. The experts selected for this study represented a variety of backgrounds related to the planning and development fields (planners, developers, architects, landscape architects and engineers). This allowed for a variety of viewpoints and considerations beyond the technical aspects.
Th e su rve y i n stru me n t co n si ste d o f background information and a description of the project, the land uses to be considered, the factors to be weighted and the weighting system. Numeric weights consisted of discrete values ranging from 0 to 10 with 10 meaning very high importance and 0 no importance. In applying the process, three sounds of survey were conducted with each of the Delphi group members to reach the consensus.
The given weight of a land feature was then multiplied by the numerical ratings of the land features that provided the Sij matrix. At this
stage the optimization model was applied to this data set, Sij, resulting in the first optimal
solution for the area of study . The results are depicted in map form in Figure 2 .5
4
As Figure 2 shows, the first round of results shows what the "final composite map" of the suitability analysis (overlaying map technique) should have provided: the most suitable location for each of the seven land use categories.
Evaluation of the First Optimal Solution
After the first application of the optimization model, the optimal solution is based solely on land and environmental resources, such as soil, slope, vegetation, etc., and the existing man made features in the area, such as street access and proximity to sewer lines and water pipes.
33 17 Figure 2
Applying the Process
It is important to point out that the conceptual planning and design process begins at the Stage 2 of the process and goes hand-in-hand with the subsequent stages. The conceptual planning and design process starts by identifying the most important planning elements and then deciding their approximate locations. Simultaneously, the thoroughfare plan and plan for other infrastructures are developed.
In order to overcome many of these problems, intervention by the planner analyst is necessary. This intervention becomes possible through application of the planning process laid out earlier in the Theoretical Framework section.
6
Five categories of problem with the plan at this stage of development have been identified in previous related studies.
First, the interactions between zones are not considered and secondly, they do not take the thoroughfare plan into consideration. These problems are inherent in the optimization procedure itself (or even in conventional suitability analysis).
For the first problem the adjacency and external effects have not been considered, and for the second problem, the trip type interaction effects related to the thoroughfare plan have not been considered .
The third problem with the optimization model was that the selected locations were either too dispersed or too concentrated for the specified activities. The fourth problem involved those planning and design considerations that require the planners' intuition and design knowledge. Lastly, as Harris (1989) asserted, most large planning problems cannot be solved optimally with computers alone. The last three problems are related to the degree of concentration or spread of activities in the domain of subjective planning design.
The process is then extended by stepping down gradually to less important elements.
Thoroughfare Plan and Important
Land Use Elements
In Stage 2 the planner-analyst develops a rough thoroughfare plan for the whole region. The planner starts with a preliminary consideration of land use and transportation. This stage of the work began by considering the overall location of more important land use elements.
The elements are such things as major and minor activity centers including high intensity commercial activities, and in this particular example, location of open space around the lake for environmental considerations as well as accommodation of recreational activities. These also would be the best factors for providing guidelines for preparation of the thoroughfare plan.
The location of major land use elements, such as centers and open spaces, are identified using a 'bubble' diagram or a marked area map and a technique discussed below.
18
Technique to Help in the Selection
Process
The selection process can be facilitated by informed decision making, based on the behavior of the model. Several runs can be performed in which demands for the land use type under consideration are changed, one at a time in small increments, to see how the model selects the incrementally selected preferred locations (second best, third best, etc.).
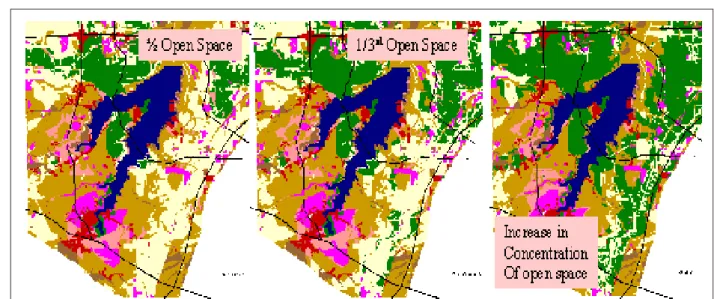
For example, knowing that the maximum demand for open space in this area is 7,752 cells (26.5%), the demand is increased incrementally from 20, to 30, to 40, to ... percent to discover the direction in which the incrementally added open space development would go.
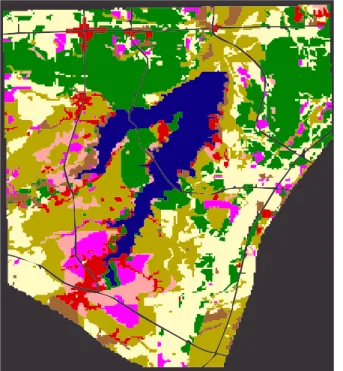
By repeating this procedure several times, it readily becomes apparent how the model will behave in each circumstance. Figure 3 shows application of such a procedure for open space. Figure 4 shows the result of this procedure for the peninsula, as a focus area of study. The best combination of commercials, and light industrial activity pattern and other related land uses for this area which was selected for this purpose in the previous stages also can be seen in Figure 4.
FIGURE 3: Results of Improvement Technique for Open Space
by the model (i.e., interactions between zones, socio economic factors, and political considerations).
Those sites with the potential of becoming regional centers, preservation areas, open spaces, etc., will become apparent, and, after several runs and the consideration of the thoroughfare and infrastructure plans, the best arrangement for allocation of activities (land uses) can be selected. In the sample study area, the process helped to identify major nodes (Figure 4) as was discussed earlier.
The lower part of the peninsula was identified as the major business district.
The southeast part of the sector and the central part were identified as low and high commercial intensity centers.
The next step involves putting aside the scores assigned to the cells of those areas that were
After completing the above procedure, the analyst has a better idea of how the model responds to changes and he/she can begin involving issues that have not been considered
selected above for the specific development, deleting them from the input data set, and running the model to obtain the first generation alternative solutions (Figure 4). By doing this, the cells selected by the analyst are not included in the optimization procedure. Therefore, since their uses have already been assigned, the cost factors (or rates) should not be considered during the next round of applying the optimization process.
By fixing some locations and rerunning the model the resulting land use pattern for the rest of the area will also be affected. In the sample study area the results of the run were compared, and their outcomes indicated that
33 19
Run 1 Run 3
Run 4 Run 2
Figure 18
Figure 21 Figure 19
Figure 20
FIGURE 4: Results of Improvement Technique for Peninsula
The result of the solution overall helps to satisfy more goals of the project. Comparing these results, and the changes that process is allowing, with the static result from the the policy restrictions caused a major difference in the settlement patterns (Figure 5). The result of the solution overall helps to satisfy more goals of the project.
traditional overlaying map technique, Figure 6, shows how much these two results differ and the potential that the new process and SDSS provides for improving the land use planning process. Putting all of the findings together, the planner is now able to use the GIS to overlay the proposed transportation map on this basic land use map. The planner can then begin to adjust the boundaries of the selected sites to generate a preliminary land use plan.
The planners also created a network of major arteries about a mile apart in accordance with the transportation network already developed or planned in the surrounding area.
This thoroughfare plan will play a major role in later stages of analysis when the preferred alternatives for activities inside the study region are selected.
FIGURE 5: The Results of Third Round Application
20
FIGURE 6
The selected location of the main commercial development can be seen in Figure 5.
After selecting the location of the high intensity commercial area the area is deleted from the database, the demand is adjusted accordingly, and the optimization model is run a second time. Figure 4 also shows the results of the second run of the optimization model because of the deletion of the designated amount of a high intensity commercial area from the data base with resultant adjustment of demand for the rest of the area. The second run of the model will produce a new selection pattern for the calls. This result constitutes the new best selection given the new demand specifications. These changes are observable in the new results in Figure 4.
Continuing Interaction and Locating
Other Important Elements
As stated earlier, the main goal of the Interactive Model Planner approach is to introduce new information into a plan based on the planner's and the community's objectives. Planners and community objectives involve issues such as the preserving of certain resources, the locating of development on remaining lands based on least cost, the concentrating of certain land uses in certain areas, or the achievement of a meaningful overall distribution of land uses.
In the sample study area, important resource protection policies were considered, including the preservation of specific environmentally sensitive areas adjacent to the lake, the allocation of subcenters, the designation of critical intersections and lands adjacent to major highways and the preservation of sites for industrial development. In order to do this, these areas were deleted from the active data set, and after adjusting the demand factors, the model was run for the next set of optimum results.
This process emphasizes the interaction between the optimization model and the planner. Using this process along with GIS and its special features, a best solution to the land-use problem is sought. The interaction process breaks with the traditional static approach of urban spatial structure models which assume "all of the relevant information is initially known to the planner and there is no need for additional information to enter to the system throughout the procedure" (Berechman, 1974, p. 249). At the conclusion of the process a discrete number of alternatives are generated that are concerned with more sensitive issues such as aesthetics, socio economic political considerations, and transportation issues.
Putting all of the findings together, the planner-analyst can use GIS to overlay the proposed transportation map on this basic land-use map. The planner-analyst can then begin to adjust the boundaries of the selected sites to generate preliminary land-use plan. This is important to note that every time the model is run, aside from the results which were discussed; it also produces the total net benefit measure, Z in equation 3, which can be compared to previous measures to see the overall effects of the changes made. This measure, then, in a sense, provide an index which helps in deciding changes and understanding the tradeoffs involved.
The above procedure should be repeated several times, giving planners the opportunity to use their intuition about locational decisions in fixing the use, deleting the cost factors from the main data set, running the model, and evaluating the locations suggested by the model. This will ensure that the land use and thoroughfare plans will be considered simultaneously.
33 21
The chart below shows the summary of procedures:
Summary of the Procedures
The analyst in the regional base interaction with the preliminary land use solution:
1. Determine model behavior by increasing or decreasing activities one at a time, and observing the results using GIS.
2. Fix the preferred locations for major and minor CBD developments, based on the planner's professional judgment and intuition. The planner used basic planning principles and considered community and regional needs and preferences in making these decisions.
3. Delete the cost factors related to the selected sites from the main data set.
4. Run the model to find the optimal solution for the region based on the changes made in the previous steps. The first optimal solution was based on information collected by the study group and was determined without any interaction.
5. Transfer the computer output in the form of a land use map using GIS and make further adjustments to the boundaries of the land use areas.
To further refine the derived plan, a similar process should be applied to important subregions and varying jurisdictions within the study area.
Discussion
By applying the SDSS to the study area, a plan was developed which avoids hazardous areas and loss of land resources, determines the most suitable sites for new development based on the considerations of the social, economic, and environmental values. This is made possible with the use of the optimization model. The model shows the optimum solution in every interaction and in every stage of the process. This allows deliberate intervention by the planner-analyst who also brings the community's values into the process. The process employs the optimization model as a tool for continuous use, as opposed to a conventional one-shot approach, and in this way overcomes some of the problems associated with these models (see for example Harris, 1989). This, along with the inclusion of the planner-analyst's intuition helps in deriving more meaningful results.
Different land use solutions can be examined for a given area and the best combination of uses can be selected.
The human factor is preserved by providing a way for the planner-analyst to interact in the process. He/she can control the demand and improve the results step by step. This is important since the common belief today is that science and technology based planning models cannot replace human value judgments.
While a computer model can provide estimates on such things as resource and flood potential or ecological compatibility, trade off decisions should be subjectively evaluated by the planner analyst.
This can be given analytical support by alternative generating techniques (Brill et. al, 1982 and Chang et. al, 1982). The planner can base a decision on existing and future socio economic conditions and a community's objectives and desires, using compatibility, access, environmental, and other tangible and intangible factors.
This type of land modeling allows analysts to test many alternative scenarios and examine the sensitivity of the SDSS process to small and large changes in different criteria (i.e., natural features of the land: slope, soil characteristics, etc.).
Policy analysis can be greatly aided by the ability to choose the least objectionable areas for specific types of development.
This benefit to policy analysis has become possible partly through the total benefit (or total cost) figure being produced by the process in every step or for every alternative which, as a policy index, allows in a sense the planner or decision maker to ascertain the consequence of any policy or land use changes.
General land use patterns, new developments, transportation facilities, recreational facilities, and the overall potential of surrounding areas, as much as possible, are all taken into account in formulating an acceptable plan.
22
Conclusion
This paper provided a concrete implementation example of ideas and theories in land-use/environmental planning that has been presented in the literature for several decades, as well as more recent ideas and modifications.
The process discussed in this paper attempts to provide a comprehensive approach to environmental and land use planning on a large scale. This process aids decision makers in overcoming the negative effects, costs, and uncertainties in the planning process for relatively large areas. This is accomplished by providing pertinent information on specific locational decisions for a variety of applications partly through the overall measure provided by the model which guides planners and decision makers in evaluating changes and selecting alternatives.
The four major components of this approach are:
1) the assessment of land resources, 2) the optimization model that derives the land use plan, 3) visualization and plan manipulation using GIS, and 4) the interaction between the planner and the computer model.
In this last step the planner changes the solution suggested by the computer based on his or her understanding of reality. The spatial pattern of the most efficient sites which would generate the most environmentally beneficial and cost effective development can be determined, or, in broader terms, the development with the highest net benefit to the society can be created.
The computer aided Spatial Decision Support System presented in this study demonstrates savings in overall cost and negative effects which can be achieved by taking a more sensitive approach to the environment and resources through use of the optimization model.
The model's overall net benefit measure serves as an index in the planning process, that allowing planners or decision makers to know the relative savings cost magnitude as a result of planning decisions.
More importantly, this paper shows how this approach can be a tool for planners and decision makers in examining the multitude of land development or spatial planning options which exist.
The planner can objectively analyze the options and determine the ones which best resolve conflicts or make the most of available opportunities. The options which avoid heavy environmental costs can also be identified.
These approaches help decision makers, planners, and private citizens in the following ways:
1. Use environmental land use planning as a learning tool providing opportunity for monitoring cost and negative effects of land use change.
2. Rapidly generate alternative plans expressing a variety of community objectives and showing desirable and undesirable aspects.
3. Help make the planning process more logical by providing accurate and objective land use comments to the general public in a comprehensive fashion
This process helps in the understanding of environmental hazards and degradation, a region's land resources, and development opportunities.
This information can be combined with other relevant information to make informed and intelligent planning decisions which not only respect short term economic concerns, but also long term environmental conservation and community goals as well.
Further research needs to be directed toward a better understanding of related problems and in identifying and evaluating any possible problems in the steps of the application process. Also, further research is needed in the application of the SDSS in related areas, and it is important to further explore any other potential uses of the process. In addition, research into the implications of using SDSS in areas with multiple economic regions and multiple political jurisdictions is needed.