Neurología 2006;21(7):341-347
Introducción. El objetivo de este trabajo es calcular los costes directos, indirectos e intangibles de un brote de es-clerosis múltiple (EM) en nuestra cohorte de pacientes.
Métodos. Partimos de datos obtenidos de cuestionarios del paciente, historias clínicas, tarifas del Servicio Catalán de Salud e Instituto de Estadística de Cataluña. Realizamos un estudio del coste de la enfermedad con el método del capital humano para estimar los costes indirectos y medidas de calidad de vida para estimar los gastos intangibles.
Resultados. Ciento cuarenta y ocho pacientes afectos de EM, controlados en nuestra unidad, que contestaron, consecutivamente, al cuestionario elaborado. Los costes di-rectos resultan 1.498,5-1.537,9 euros (hospitalizado y am-bulatorio, respectivamente) y los indirectos 1.530,6 euros. El coste medio total estimado es de 3.048,8 euros por paciente y brote. Los gastos intangibles a añadir al coste total resul-tan 539 euros por paciente y brote.
Conclusiones. El coste total de un brote de EM estima-do en nuestra población (3.048,8 euros) es menor que lo pu-blicado anteriormente. El gran impacto económico de la EM vendrá dado fundamentalmente por la progresión de la dis-capacidad más que por los brotes.
Palabras clave:
Esclerosis múltiple. Brote. Costes. Cataluña.
Neurología 2006;21(7):341-347
The costs of a multiple sclerosis relapse in Catalonia (Spain)
Introduction.The objective of this study is to calcu-late direct, indirect and intangible costs of a relapse in multiple sclerosis (MS) in our cohort of patients.
Methods. Data from patient questionnaires, hospital charts, Catalan Public Healthcare System tariffs and Ca-talan Statistics Institute. We employed a cost-of-illness method. The human capital approach was used to esti-mate indirect costs, and quality-of-life measurements were used to estimate intangible costs.
Results. 148 MS patients monitored in our MS-Unit consecutively answered the questionnaire elaborated. We calculated 1,498.5-1,537.9 euros for direct costs (hospital admission and outpatient, respectively) and 1,530.6 euros for indirect costs. We estimated an average total cost of 3,048.8 euros per patient/relapse. We also calculated intangible costs, 539 euros per patient and relapse, which should be added to the previous figure.
Conclusions. The total cost of a MS relapse in our population (3,048.8 euros) is lower than the cost reported in the literature. The economic impact of MS is due to its disabling progression rather than to relapses.
Key words:
Multiple sclerosis. Relapse. Costs. Catalonia.
INTRODUCCIÓN
La esclerosis múltiple (EM) es una enfermedad crónica del sistema nervioso central causante de un gran impacto socioeconómico debido a su prevalencia (53,8 por 100.000 habitantes en nuestra área (Cataluña)19y porque afecta pre-dominantemente a adultos jóvenes. Es la segunda causa más frecuente de discapacidad neurológica en adultos jóvenes, únicamente superada por los accidentes de tráfico8.
Los nuevos tratamientos para la EM han demostrado su eficacia, sobre todo para reducir la frecuencia y la severidad de los brotes. Pero su precio es elevado, por lo que se hace necesario evaluar su eficiencia.
Este trabajo trata de calcular los costes directos, indi-rectos e intangibles de un brote de EM en una cohorte de pacientes de nuestra área como un primer paso en el
estu-33 341
Originales
¿Cuánto cuesta un brote de esclerosis
múltiple en Cataluña?
V. Casado1
S. Martínez-Yélamos1 A. Martínez-Yélamos2 O. Carmona3
L. Alonso1 L. Romero1 E. Moral1 T. Arbizu1
1Unidad de Esclerosis Múltiple
Servicio de Neurología Hospital Universitario de Bellvitge L’Hospitalet de Llobregat (Barcelona)
2Servicio de Neurología
Hospital de Viladecans Barcelona
3Servicio de Neurología
Hospital de Figueres Girona
Correspondencia: Virginia Casado
Unidad de Esclerosis Múltiple Hospital Universitario de Bellvitge Feixa Llarga, s/n
08907 L’Hospitalet de Llobregat (Barcelona) Correo electrónico: [email protected]
Recibido el 28-7-05 Aceptado el 27-3-06
dio del coste global de la EM y del coste-efectividad (efi-ciencia) de los nuevos fármacos inmunomoduladores.
MÉTODOS
Hemos calculado los costes de un brote de EM desde una perspectiva social en un estudio observacional y bot-tom-up(estimando el coste en la población a partir de los resultados obtenidos en la muestra analizada) con un enfo-que de prevalencia de la enfermedad.
Fuentes de datos
Se elaboró un cuestionario sobre aspectos sociales, de-mográficos y ocupacionales de los pacientes y sus cuidado-res y sobre los costes atribuibles a la EM en cada caso. El cuestionario fue voluntario y anónimo. Se envió a los pa-cientes que siguen controles en nuestra unidad junto con un consentimiento informado que dichos pacientes devol-vían firmado junto con las respuestas. Los pacientes diag-nosticados recientemente fueron excluidos a fin de evitar una percepción negativa de su enfermedad con un cuestionario complejo y que hace hincapié en la discapacidad y también los pacientes que estaban participando en ensayos clínicos que generalmente consumen más recursos que el resto de pacientes (visitas, exploraciones complementarias, etc.). Se recogieron, consecutivamente, los cuestionarios recibidos en nuestra unidad durante los primeros 6 meses posteriores al envío (1/9/2001 a 28/2/2002).
El cuestionario incluyó información sobre aspectos de-mográficos (edad, sexo, empleo, nivel educacional), clínicos (duración de la enfermedad, tratamientos recibidos), del consumo de recursos (visitas médicas, enfermería, asistencia social, hospitalizaciones, rehabilitación, ambulancias) y de la productividad (bajas laborales, salarios, invalidez prematu-ra). Los datos sobre el consumo de recursos se refirieron a los 15-365 días previos a la recogida de los datos, depen-diendo del tipo de recurso, de la siguiente forma:
— Año previo para hospitalizaciones y días de baja la-boral debidos a la EM.
— Tres meses previos para visitas médicas especializadas. — Quince días previos para tratamientos médicos,
re-habilitación, visitas al médico de cabecera, desplaza-mientos en ambulancia y exploraciones complemen-tarias (analítica, radiografías, etc.).
La situación laboral de los pacientes se refirió al mo-mento en que los pacientes respondieron al cuestionario. Generalmente un período de 3 meses es considerado fia-ble para la recogida de datos retrospectiva, mientras que para acontecimientos más importantes o menos frecuen-tes como una hospitalización 1 año puede considerarse
Las respuestas de los pacientes se corroboraron, cuando fue posible, con otras fuentes de datos como las historias clínicas, la base de datos European Database for Multiple Sclerosis (EDMUS) y los archivos de hospital, que aportaban datos clínicos de cada paciente (a fin de verificar los obteni-dos de las respuestas a los cuestionarios, que podrían ser más inexactos); el Instituto Catalán de Estadística aportó los datos correspondientes a la población general de Cataluña.
La aparición y duración de un brote se estableció de acuerdo con lo que constaba en la historia clínica de cada paciente. La duración se definió como el número de días transcurridos entre la aparición del nuevo síntoma neuroló-gico y su remisión y/o estabilización tras la administración del tratamiento esteroideo. En este estudio sólo se han in-cluido los brotes moderados y/o severos.
Hemos considerado un brote «moderado» al que requie-re tratamiento esteroideo endovenoso debido a la aparición de un nuevo síntoma neurológico o al empeoramiento de uno existente, acompañado de un cambio objetivo en un sistema funcional relevante de la Expanded Disability Sta-tus Scale (EDSS) que suponga al menos el incremento de 0,5 puntos en la EDSS o de 1 punto en uno o más sistemas funcionales que no sean el referido a la función mental ni a la de esfínteres.
Costes directos
Se calcularon mediante el método del coste de la enfer-medad, multiplicando los recursos consumidos por su coste unitario (coste de oportunidad), por paciente y brote.
Desde una perspectiva social, los costes unitarios se cal-cularon a partir de los precios de mercado (p. ej., para fár-macos) y a partir de las tarifas del Servicio Catalán de Salud como aproximación cuando otros costes unitarios no esta-ban disponibles en nuestra área (hospitalizaciones, consul-tas médicas, exploraciones complementarias, etc.).
Costes indirectos
Para calcular los costes indirectos, los generados a con-secuencia de la pérdida de productividad, se empleó el mé-todo del capital humano de la siguiente manera10,11:
Costes de morbilidad = número de días perdidos de trabajo debido a un brote de EM×salario diario medio
en nuestra región (Instituto Catalán de Estadística) Los costes derivados de la mortalidad de la EM se han excluido, de acuerdo con Hodgson et al.11, porque conside-ramos que no existen diferencias entre la productividad perdida debido a que el paciente a causa de la EM está tem-poralmente de baja, o tiene invalidez permanente para
tra-Neurología 2006;21(7):341-347
mortalidad prematura en la EM es limitado y puede consi-derarse irrelevante durante un brote.
Costes intangibles
Los costes intangibles que se deben al dolor, pena, an-siedad y limitaciones sociales son muy difíciles de cuantifi-car y de «traducir» en valores monetarios. Hemos estimado estos costes asignando un valor de utilidad a los pacientes con y sin brote, comparando la diferencia de utilidades y QALY (quality of life adjusted life years, o años de vida ajus-tados por calidad de vida) entre ambos grupos y asignando un coste de 55.000 euros por cada QALY perdido (obtenido a partir de valores de referencia empleados en evaluaciones económicas9).
El valor de utilidad es un instrumento estandarizado de calidad de vida que da una descripción del estado de salud de los pacientes en un momento determinado. Hemos obte-nido los valores de utilidad de un grupo de pacientes con-trolados en nuestra unidad que realizaron una escala vali-dada de calidad de vida, la Escala Analógica Visual (EAV), sobre su estado global de salud en dos momentos precisos: durante el brote de EM y durante un período estable de su enfermedad. Con los valores de la EAV se determinó la cali-dad de vida y se obtuvieron las utilicali-dades de los paciente, de acuerdo con la fórmula (1-u) = (1-v)2,29, donde ues el valor de la utilidad y v el resultado de la EAV26. El número de QALY perdidos a causa del brote, que viene dado por la dife-rencia de utilidades en los pacientes durante el brote y du-rante el período estable, se multiplica por el valor asignado a un QALY y se divide posteriormente por la duración media de un brote (días) para obtener los costes intangibles de un brote de EM. Como el valor de 55.000 euros por QALY es dis-cutible9, hemos realizado un análisis de sensibilidad asignan-do valores de 33.000 y 77.000 euros por cada QALY perdiasignan-do. Los análisis estadísticos se realizaron con el programa SPSS 10.0. Se emplearon los tests de χ2, t de Student y U de Mann-Whitney.
RESULTADOS
Hemos analizado 148 pacientes que contestaron al cuestionario, consecutivamente, durante los 6 meses que si-guieron al envío por correo de dicho cuestionario («respon-dedores»). Todos ellos estaban diagnosticados de EM (crite-rios de Poser), incluidos en la base de datos EDMUS y seguían controles periódicos en nuestra unidad de EM.
La edad media de los pacientes «respondedores» (55 mu-jeres y 93 hombres) fue de 41 años (DE: 10,7). La duración media de la enfermedad fue de 12,8 años (DE: 8,7). El 78% de los pacientes tenían EM en forma recurrente-remitente, el 12,8 % EM secundaria progresiva y el 8,7 % EM primaria pro-gresiva. La mediana del EDSS fue 2 (0-9,5) y la media 2,7
(DE: 2,2); el 65,5 % de los pacientes puntuaban EDSS entre 0-3, el 26,3 % entre 3,5-5,5, el 5,4 % entre 6,5-7,5 y el 2,7 % entre 8-9,5.
Estas características (tabla 1) son similares a las descri-tas previamente en la población general de EM. Además no encontramos diferencias estadísticamente significativas en-tre la características clínicas de los 148 pacientes «respon-dedores» y los pacientes que no respondieron al cuestiona-rio (n = 255, «no respondedores») (tabla 1).
De acuerdo con la práctica clínica habitual en nuestra unidad de EM, el manejo de un brote moderado de EM in-cluye, al menos:
— Una visita al servicio de urgencias, desde donde el paciente es referido a la unidad de EM.
— Una visita al médico de cabecera, que refiere al pa-ciente a la unidad de EM y/o se encarga de la reali-zación de las recetas adicionales y partes de baja ne-cesarios.
— Dos visitas al neurólogo de la unidad de EM: al inicio del brote, para evaluación clínica e indicación de tratamiento, y tras el tratamiento esteroideo, para establecer el fin del brote y valorar la necesidad de cambios en la actitud terapéutica de la EM en cada caso.
— La administración del tratamiento estándar para un brote de EM.
— Desplazamientos en ambulancia requeridos por aque-llos pacientes con discapacidad residual previa a la aparición del brote.
Obtenemos un valor de 1.498,52 €en costes directos
cuando el paciente requiere ser hospitalizado para el tra-tamiento del brote o de 1.537,95 euros cuando este
trata-35 343
Neurología 2006;21(7):341-347
¿Cuánto cuesta un brote de esclerosis múltiple en Cataluña? V. Casado, et al.
Respondedores No respondedores
p
(n=148) (n=255)
Edad media (años) 41,3 (DE: 10,7) 42,1 (DE: 11,3) 0,4
Hombres (%) 37 37 0,8
Duración media de
EM (años) 12,8 (DE: 8,7) 11,9 (DE: 8,14) 0,3
EDSS (mediana) 2 2 0,5
Tasa de brotes en año
previo 0,3 0,3 0,2
Forma clínica (%)
Recurrente-remitente 78 81,9 0,5
Secundaria progresiva 12,8 8,6 0,2
Primaria progresiva 8,7 9,4 0,7
miento se administra de forma ambulatoria en hospital de día (tabla 2). Éstos son los costes directos mínimos estima-dos de un brote moderado de EM debiestima-dos al consumo de re-cursos que genera la aparición de dicho brote, considerando el procedimiento estándar que se aplica a los pacientes en nuestra unidad cuando sufren un brote de su enfermedad.
Por otra parte, en la muestra analizada un brote causa una media de 23,5 días de baja laboral (oscilando entre 1-150 días), lo que supone un coste indirecto de 1.530,6 euros por paciente y brote. Los días de baja laboral se calcularon en los pacientes que realizaban un trabajo remunerado en el momento de contestar el cuestionario (41,8 %) y que, ade-más, habían tenido un brote de su EM durante el año previo (17,6 % de todos los pacientes «respondedores», es decir, 26 pa-cientes).
El coste total medio estimado (directo e indirecto) es de 3.048,84 euros por paciente y brote: 3.029,1 euros cuando el paciente es hospitalizado y 3.068,5 euros cuando el trata-miento es ambulatorio. Los costes indirectos suponen el 50,2 % del total.
Los costes intangibles deben añadirse a este coste total. Para ello analizamos 14 pacientes que realizaron una EAV durante un brote y durante un período estable de su EM (tabla 3). A partir de las puntuaciones en esta escala obte-nemos que la diferencia media de utilidades debido al brote en el grupo de pacientes estudiado (n = 14) fue de 0,065; la
duración media del brote en estos mismos pacientes fue de 55,07 días (DE: 32,5), con lo que los costes intangibles resul-tan 539 euros por paciente y brote (tabla 3). Si realizamos un análisis de sensibilidad asignando diferentes valores a cada QALY perdido (diferente «voluntad de pagar» por cada QALY), los costes intangibles por paciente y brote oscilan entre 323,4 y 754,6 euros (tabla 3).
DISCUSIÓN
Nuestra unidad de EM es el centro de referencia para la población de la Costa de Ponent, un área sanitaria con 1.117.940 habitantes, en la región de Cataluña (6.343.110 habitantes). En esta área hemos calculado para la EM una prevalencia de 53,82/100.000 habitantes y una incidencia media anual de 3,04 (DE: 0,64) por 100.000 a lo largo de los últimos 15 años19. Estos valores son similares a los publica-dos en otros estudios epidemiológicos realizapublica-dos en Espa-ña25, lo que indica que los pacientes controlados en nuestra unidad son probablemente representativos de la población total de EM en nuestra área. El hecho de poder considerar que la muestra estudiada es representativa de la población general de EM es fundamental en la realización de un análi-sis del tipobottom-upcomo el que aquí presentamos a la hora de extraer conclusiones relevantes. Probablemente nuestros 148 pacientes (alrededor del 4 % de todos los pa-cientes afectos de EM en Cataluña) son un fiel reflejo de lo que ocurre en la población general de EM en Cataluña o en un país del sur de Europa.
Como principales limitaciones de este trabajo destaca-mos el pequeño tamaño de la muestra (148 pacientes) y la
Neurología 2006;21(7):341-347
¿Cuánto cuesta un brote de esclerosis múltiple en Cataluña? V. Casado, et al.
Ingresado Hospital de día
Metilprednisolona (4.500 mg en 5 días) 72,5 72,5 Ranitidina (300 mg/día×5 días) 3,48 3,48 Suero fisiológico (×5 días) 5,14 5,14
Una visita a urgencias 80,54 80,54
Una visita al médico de cabecera/
otro especialista 44,87 44,87
Dos visitas al neurólogo 89,74 89,74 Cinco días de ingreso hospitalario 901,52
Cinco desplazamientos en
ambulancia×0,2* 211
Cinco días de tratamiento
en hospital de día 772,15
Nueve desplazamientos en
ambulancia×0,2* 379,8
Total 1.498,52 1.537,95
* 0,2: factor de corrección estimado, asumiendo que sólo los pacientes con EDSS ≥4 requieren ambulancia para sus desplazamientos cuando tienen un brote.
Tabla 2 Coste mínimo directo estimado para un brote de esclerosis múltiple (euros)
N = 14 Durante Durante
brote período estable
Edad media (años) (DE) 38,2 (9,9)
Mujeres (%) 57 %
EDSS (media/mediana/DE) 4,2/4/1,9 3,1/3/2,4 EAV (puntuación media) (DE) 49,7 (25,8) 57,3 (26) QALY (media) (DE) 0,71 (0,2) 0,77 (0,3) Diferencia de QALY (media) (DE) 0,065 (0,15)
Duración media del brote (días) (DE) 55,07 (32,5) Coste intangiblepor paciente y brote
Si 1 QALY = 55.000 euros 539 euros Si 1 QALY = 33.000 euros 323,4 euros Si 1 QALY = 77.000 euros 754,6 euros
EAV: Escala Analógica Visual; QALY: quality of life adjusted life years, o años de vida ajustados por calidad de vida (AVAC). EDSS: Expanded Disability Status Scale;DE: desviación estándar.
limitaciones hemos decidido calcular los costes directos co-mo los mínico-mos requeridos, de acuerdo con el protocolo de manejo del brote de EM en nuestra unidad, en lugar de la media de recursos consumidos, que constituiría un valor más inexacto (debido al tamaño limitado de la muestra ob-tendríamos valores muy dispersos). Recursos adicionales ta-les como rehabilitación, exploraciones complementarias de laboratorio y/o imagen, visitas a otros especialistas, etc., que pueden ser necesarios en algunos casos de brote no se han incluido en este trabajo. Los costes directos así estimados son, pues, aplicables a los 148 pacientes de la muestra ana-lizada.
A pesar de que obtuvimos una tasa de respuesta a los cuestionarios relativamente baja, creemos que esto no su-pone un sesgo de selección importante, ya que no encontra-mos diferencias estadísticamente significativas entre los pa-cientes «respondedores» y «no respondedores» (tabla 1).
En cuanto a los costes indirectos, por limitaciones inhe-rentes al método del capital humano sólo se han podido cal-cular en los pacientes que realizaban trabajo remunerado en el momento de sufrir un brote (26 pacientes); en ellos hemos calculado la pérdida media de productividad originada por los días de baja laboral debidos al brote de EM (23,5 días). En otros estudios publicados1,15,9el número medio de días de baja laboral debido a la EM (y no sólo al brote) oscila entre 14 y 34,7 días por paciente y año para pacientes con EDSS > 4. La tasa de desempleo debida a la EM en estos estu-dios1,15,9oscila entre el 28 y 60 %, mientras que en nuestra muestra es del 31,04%. La alta tasa de desempleo debida a la EM en nuestros pacientes, a pesar de que su EDSS medio es relativamente bajo (2,47), resulta sorprendente. Este hecho podría explicarse, en parte, por la relativa facilidad con la cual el sistema sanitario vigente concede a estos pacientes el estatus de invalidez laboral, incluso con grados leves de disca-pacidad según la EDSS. Los neurólogos, al contrario, solemos recomendar a los pacientes mantener su trabajo y sus activi-dades cotidianas el mayor tiempo posible, considerando que ésta es la mejor terapia ocupacional existente.
A la hora de calcular los costes directos las tarifas pue-den no reflejar con exactitud los costes de oportunidad de los recursos consumidos (costes unitarios). En el Reino Uni-do se considera que las tarifas sobreestiman los costes en aproximadamente un 20 %20, mientras que en Alemania las tarifas incluirían incentivos para una reducción en su uso, siendo por ello más bajas que el coste de oportunidad real15. Este aspecto no ha sido establecido en España y podría llevar a una sobrevaloración o infravaloración de los costes totales para la sociedad.
Otra limitación del estudio es la dificultad en la cuanti-ficación de los costes intangibles, no exenta de controver-sias. Al estimar dichos costes se asume la imprecisión debida a parámetros tan subjetivos como la calidad de vida o las utilidades y debida también a la falta de estudios publicados en España que establezcan los valores monetarios de las
medidas de calidad de vida. Para estimar estos costes en nuestra cohorte de pacientes consideramos apropiado apli-car la metodología empleada por Henriksson9a las utilida-des obtenidas en los pacientes controlados en nuestra uni-dad. La muestra en la que analizamos las utilidades es pequeña (n = 14), pero el valor del número de QALY perdidos debido a un brote que obtenemos en nuestra muestra (0,065) es similar al publicado por Henriksson et al. (0,063)9, lo que conferiría fiabilidad a nuestros resultados. Los costes intangibles obtenidos en este subgrupo de 14 pacientes que sufrieron un brote únicamente pretenden ser una aproxi-mación de lo que supondrían estos costes (hasta hoy infra-valorados), destacando su relevancia en una enfermedad crónica como es la EM.
Se podría decir que los pacientes de nuestra cohorte es-tán «poco discapacitados» para una duración larga de la en-fermedad, lo que significaría un posible sesgo de selección. Pero hallazgos similares de cambios modestos en la discapa-cidad debida a la EM a lo largo del tiempo han sido publica-dos en estudios prospectivos de historia natural en Catalu-ña17y también en el condado de Olmsted (Estados Unidos)23. Sorprendentemente, un número importante de estos pacites «poco discapacitados» no podían trabajar debido a su en-fermedad (31,04 %), tal como se discute anteriormente.
Cuando comparamos nuestros resultados con otros estu-dios publicados9,3,4,12,21encontramos que los costes directos son menores en nuestra población (tabla 4). Este hecho puede explicarse por las diferentes metodologías empleadas7o por las diferencias entre los sistemas sanitarios de cada país. El coste medio total para un brote de EM es de 2.240 euros pa-ra Grima et al.6, que excluye los pacientes con EDSS mayor de 6, de 3.093 euros para Henriksson et al.9y de 3.384 euros para Kobelt et al.12.
Encontramos también en la literatura que los costes in-directos en los estudios de coste de la enfermedad24,20,18,1, son considerablemente más altos que los costes directos. Es-to no ocurre en nuestro trabajo, probablemente porque los
37 345
Neurología 2006;21(7):341-347
¿Cuánto cuesta un brote de esclerosis múltiple en Cataluña? V. Casado, et al.
3.525 Norte de Inglaterra Blumbardt et al., 1996 305 Canadá (ambulatorio) Brown et al., 1996 3.260 Canadá (hospitalización) Brown et al., 2000
2.237 Suecia Kobelt et al., 2000
1.848 Suecia Henriksson et al., 2001
2.309 EE.UU. (brote moderado) O’Brien et al., 2003 15.899 EE.UU. (brote severo) O’Brien et al., 2003 1.538 Cataluña (ambulatorio) Casado et al., 2002 1.499 Cataluña (hospitalización) Casado et al., 2002
costes indirectos se producen sobre todo a consecuencia de la progresión de la enfermedad. Además, el método del capi-tal humano16,2tiende a infravalorar estos costes en la pobla-ción «inactiva» (que no está trabajando). Aun así, Henriksson et al.9encuentran los costes directos (incluyendo el coste del interferón y de los cuidados informales) mayores que los costes indirectos en un interesante estudio transversal reali-zado en Suecia empleando el método de coste de la enfer-medad basado en la teoría del capital humano.
En nuestra población, dentro de un sistema sanitario pú-blico, el coste total de un brote de EM será, como mínimo, de 3.048,84 euros por paciente, algo menor que lo publicado previamente en la literatura. Los costes intangibles de 539 euros por paciente y brote deberían también ser añadidos.
Un alto porcentaje de los pacientes analizados (67 %) recibían tratamiento inmunomodulador, pero consideramos que el coste estimado para un brote moderado, el coste adi-cional generado por un brote, no tiene por qué ser diferente entre pacientes tratados o no con agentes inmunomodula-dores. Qué duda cabe que un aspecto importante a conside-rar en próximos estudios será si, dada la eficacia demostrada de los tratamientos inmunomoduladores en reducir tanto la severidad como el número de los brotes, la parte del coste global de la EM atribuible a los brotes será menor en los pa-cientes tratados.
Los análisis coste-utilidad publicados13,14proporcionan, mediante la creación de un sistema de modelos, datos acer-ca del coste de la EM (a partir de estudios de coste de enfer-medad9) y acerca del coste-efectividad del interferón-beta, mostrando la relevancia del tratamiento de la EM en la polí-tica sanitaria. Creemos por ello que son necesarios nuevos estudios en nuestra población para evaluar el coste real de la EM y la eficiencia de los tratamientos.
Los resultados del presente trabajo son limitados y cons-tituyen únicamente un aspecto parcial de un estudio global de coste de la enfermedad en nuestra población. Son ade-más datos preliminares obtenidos en una muestra pequeña de pacientes, pero que pretenden impulsar un trabajo en esa línea ampliando la muestra entre otras regiones españo-las. Estamos llevando a cabo estudios más amplios que com-pletarán el coste total de la EM, su relación con la progre-sión de la discapacidad y otras variables que pueden influir en el coste total. Los resultados de este tipo de estudios se-rán de utilidad a la hora de analizar el coste-efectividad de los tratamientos para la EM en un futuro.
AGRADECIMIENTOS
SOIKOS. Centro de Estudios de Economía de la Salud. Barcelona.
Al doctor G. Kobelt por su colaboración en el cálculo de
BIBLIOGRAFÍA
1. Amatto MP, Battaglia MA, Caputo D, Fattore G, Gerzelli S, Pitta-ro M, et al. The costs of multiple sclePitta-rosis: a cPitta-ross-sectional, multicenter cost-of-illness study in Italy. J Neurol 2002;249: 152-63.
2. Asche CV, Ho E, Chan B, Coyte PC. Economic consequences of multiple sclerosis for Canadians. Acta Neurol Scand 1997; 95:268-74.
3. Blumhardt LD, Wood C. The economics of MS: a cost of illness study. Br J Med Econ 1996;10:99-118.
4. Brown MG, Murray TJ, Fisk JD. A therapeutic and economic as-sessment of interferon beta in multiple sclerosis. Halifax: Dal-housie Multiple Sclerosis Research Unit, 1996.
5. Casado V, Martínez-Yélamos S, Martínez-Yélamos A, Carmona O, Hernández JJ, Arbizu T. A relapse of multiple sclerosis: how much does it cost in Catalonia? Mult Scler 2002;8 (Suppl. 1): 301.
6. Grima DT, Torrance GW, Francis G, Rice G, Rosner AJ, Lafortune L. Cost and health related quality of life consequences of multiple sclerosis. Mult Scler 2000;6:91-8.
7. Grudzinski AN, Hakim Z, Cox ER, Bootman JL. The economics of multiple sclerosis, distribution of costs and relationship to disea-se disea-severity. Pharmacoeconomics 1999;15:229-40.
8. Hauser SL. Multiple sclerosis and other demyelinating diseases. En: Isselbacher KJ, Braunwald E, Wilson JD, Martin JB, Fauci AS, Kasper DL, editores. Harrison’s principles of internal medicine. Toronto: McGraw Hill Inc., 1994; p. 2281-94.
9. Henriksson F, Fredrikson S, Masterman T, Jönson B. Costs, qua-lity of life and disease severity in multiple sclerosis: a cross-sec-tional study in Sweden. Eur J Neurol 2001;8: 27-35.
10. Hodgson TA, Meiners MR. Cost-of-illness methodology: a guide to assessment practices and procedures. Milbank Memorial Fund Quarterly/Health Soc 1982;60:429-91.
11. Hodgson TA. Cost of illness in cost-effectiveness analysis, a re-view of the methodology. Pharmacoeconomics 1994;6:536-52. 12. Kobelt G, Jönson L, Henriksson F, Fredrikson S, Jönson B. Cost-utility analysis of interferon beta 1b in secondary progressive multiple sclerosis. Int J Technol Assess Health Care 2000;16: 768-80.
13. Kobelt G, Jönson L, Miltenburger C, Jönson B. Cost-utility of in-terferon beta 1b in secondary progressive multiple sclerosis, using natural history data. Int J Technol Assess Health Care 2002;18:127-38.
14. Kobelt G, Jönson L, Fredrikson S. Cost-utility of interferon beta 1b in the treatment of patients with active relapsing-remitting or secondary multiple sclerosis. Eur J Health Econom 2003;4:50-9. 15. Kobelt G, Lindgren P, Parkin D. Costs and quality of life in
mul-tiple sclerosis. An observational study in Germany. HEPAC 2001; 2:60-8.
16. Liljas B. How to calculate indirect costs in economic evalua-tions. Pharmacoeconomics 1998;13:1-7.
17. Martínez-Yélamos S, Casado V, Carmona O, Martínez-Yélamos A, Ramón JM, Arbizu T. Prognosis in relapsing-remitting multi-ple sclerosis. A hierarchical model. Mult Scler 2002;8 (Suppl. 1):215.
18. Midgard R, Rüse T, Nyland H. Impairment, disability and
handi-Neurología 2006;21(7):341-347
cohort in More and Romsdal County, Norway. J Neurol 1996; 243:337-44.
19. Moral E, Carmona O, Casado V. Estudio de la incidencia de la esclerosis múltiple en la región sanitaria de Costa de Ponent durante 15 años consecutivos. Neurología 2002;17:494-597. 20. Murphy N, Confavreux C, Haas J, Köning N, Roullet E, Sailer M,
et al, and the Cost of Multiple Sclerosis Study Group. Economic evaluation of multiple sclerosis in the UK, Germany and France. Pharmacoeconomics 1998;13:607-22.
21. O´Brien JA, Ward AJ, Patrick AR, Caro J. Costs of managing an episode of relapse in multiple sclerosis in the United States. BMC Health Serv Res 2003:3:17.
22. Parkin D, Jacoby A, McNamee P, Miller P, Thomas S, Bares D. Treatment of multiple sclerosis with interferon beta: an
apprai-sal of cost-effectiveness and quality of life. J Neurol Neurosurg Psychiatry 2000;68:144-9.
23. Pittock SJ. Change in MS-related disability in a population-ba-sed cohort, a 10-year follow-up study. Neurology 2004;62:51-9. 24. The Canadian Burden of Illness Study Group. Burden of Illness of multiple sclerosis, part I: Cost of Illness, and part II: Quality of life. Can J Neurol Sci 1998;25:23-37.
25. Tola MA, Yugueros MA, Fernández-Buey N, Fernández-Herranz R. Prevalence of multiple sclerosis in Valladolid, northern Spain. J Neurol 1999;246:170-4.
26. Torrance GW, Feeny DH, Furlong WJ, Barr RD, Zhang Y, Wang Q. Multiattribute utility function for a comprehensive health sta-tus classification system. Health Utility Mark 2. Med Care 1996; 34:702-22.
39 347
Neurología 2006;21(7):341-347
ESTUDIO DEL COSTE DE LA
ESCLEROSIS MÚLTIPLE EN EL BAIX
LLOBREGAT. ANÁLISIS EN FUNCIÓN
DE LA DISCAPACIDAD.
TESIS DOCTORAL
Virginia Casado Ruiz.
Director de tesis: Txomin Arbizu Urdiain
Programa de Doctorado en Investigación de la Fisiopatología de la
Enfermedad de la Universidad de Barcelona
.
http://msj.sagepub.com
Multiple Sclerosis
DOI: 10.1177/1352458506073480
2007; 13; 800 originally published online Mar 15, 2007; Mult Scler
T. Arbizu
V. Casado, L. Romero, L. Gubieras, L. Alonso, E. Moral, S. Martinez-Yelamos, A. Martinez-Yelamos, O. Carmona andCatalonia, Spain An approach to estimating the intangible costs of multiple sclerosis according to disability in
http://msj.sagepub.com/cgi/content/abstract/13/6/800 The online version of this article can be found at:
Published by:
http://www.sagepublications.com
can be found at: Multiple Sclerosis
Additional services and information for
http://msj.sagepub.com/cgi/alerts Email Alerts:
http://msj.sagepub.com/subscriptions Subscriptions:
http://www.sagepub.com/journalsReprints.nav Reprints:
http://www.sagepub.com/journalsPermissions.nav Permissions:
An approach to estimating the intangible costs
of multiple sclerosis according to disability in
Catalonia, Spain
V Casado1, L Romero1, L Gubieras1, L Alonso1, E Moral1, S Martı´nez-Ye´lamos1, A Martı´nez-Ye´lamos2, O Carmona3 and T Arbizu1
Multiple sclerosis (MS) is a chronic demyelinating disease, which represents a great economic burden to society. Cost-of-illness studies of MS tend to underestimate the intangible costs related to pain, anxiety and helplessness. The purpose of this study was to estimate the intangible costs of MS, and determine whether these costs increase as disability progresses. We studied 211 consecutive patients with MS who attended our MS unit. Patients mean age was 41.6 (SD: 10.7) years, 69% were female, and their mean Expanded Disability Status Scale (EDSS) score was 2.47 (SD: 2.05). Quality-of-life was measured with the EuroQoL visual analogue scale. Quality-adjusted life year (QALY) was calculated for each patient. Patients were grouped into five disability stages according to their EDSS, and QALY was compared between patients and a group of healthy controls matched by age and sex. A benchmark value was ascribed to each QALY lost, and the intangible costs per patient-year were calculated as t0 (EDSS/0), t1100 (EDSS/13), t8250 (EDSS/3.55.5),t9900 (EDSS/67)
andt11 000 (EDSS /7.5). Sensitivity analysis showed a similar progression of costs. We conclude
that intangible costs are relevant in MS, especially when disability increases. Although the method to calculate the costs remains controversial, we consider that they should be included in cost analysis of MS.Multiple Sclerosis2007;13: 800804. http://msj.sagepub.com
Key words:disability evaluation; Expanded Disability Status Scale (EDSS); intangible costs; multiple sclerosis; quality-adjusted life years; quality of life
Introduction
Multiple sclerosis (MS) is a chronic, demyelinating, inflammatory disease of the central nervous system (CNS). The aetiology of MS is still unknown, and its prognosis is unclear. Although life expectancy is relatively unaffected, MS has considerable morbid-ity natural history studies show that 50% of
patients need help to walk 10 years after diagnosis [1].
In Spain, the prevalence of MS is approximately 5060 per 100 000 population [2,3], and MS affects
predominantly young adults (onset in third decade of life), and females (female:male/2:1). Due to
these particular features, MS imposes a great eco-nomic burden on patients and society; recently, this burden has been estimated in cost-of-illness studies [3,4].
The pain, helplessness, anxiety, and other symptoms associated with MS can dramatically affect quality of life in patients and their care-givers, which can be represented by ‘intangible costs’. These intangible costs relate to changes in health status brought about by healthcare inter-vention and the particular disease. Many issues should be included in estimating these costs, such as changes in residence, pain, anxiety, social functioning, ability to perform activities of daily
1Multiple Sclerosis Unit, Institute of Biomedical Investigation, University Hospital of Bellvitge, Faculty of Medicine,
Campus Bellvitge, University of Barcelona, Spain
2Department of Neurology, Hospital de San Lorenzo, Viladecans, Barcelona, Spain 3Department of Neurology, Hospital de Figueres, Girona, Spain
Author for correspondence: V Casado, Unitat d’Esclerosi Mu´ltiple, Hospital Universitario de Bellvitge (H. Duran i Reynolds), Gran vı´a s/n, km 2, 7, E-08907 L’Hospitalet de Llobregat, Barcelona. Spain. E-mail: [email protected] Received 7 February 2006; accepted 27 September 2006
living (including leisure time), and, in general, changes in the patient’s way of life because of the disease. These are not explicitly valued in mone-tary terms, but they can be measured and valued by health state utility methods.
Other costs are easier to quantify, and are considered ‘tangible costs’, such as direct medical costs (hospital fees, drugs, equipment, supplies, professional fees), direct non-medical costs (trans-portation for care, lodging for family, additional home care), and indirect medical costs (earnings lost during illness or treatment, and from disabil-ity). The utility value is a standardised quality of life instrument, which describes the current and global health status of a patient. For the purpose of pharmacoeconomic analyses, utility can be used in its strict economic sense: the level or degree of satisfaction or well-being relative to other health states. Utility quantifies the value that an indivi-dual places on an aspect of health and well-being. Utility measures are applied increasingly in phar-macoeconomic analyses because many diseases require inclusion of the patient’s predilections or preferences for particular outcomes, and these preferences can be assessed through measurement of the patient’s quality of life.
Ideally, utility of health states should be derived directly using standard gamble or time-trade off techniques, but there is no gold standard health utility measure. Generic measures of health utility have been used in studies of MS, such as the Euro Quality of Life-5 Dimensions (EQ-5D), HUI Mark III etc. [5,1215], and visual analogue scale
(VAS) scores have also been used to estimate utility [69,11].
Cost-utility analysis of different therapies at-tempts to express health outcomes in terms of the quality-adjusted life year (QALY), where the degree of health utility obtained with a therapy may temper the extension in the length of life. For example, an extra year of life with constant pain from a treatment may be only half as valuable to a patient as a year of perfect health, thereby equating to a QALY of 0.5 and not 1.0.
Utility may be used beyond the cost-utility analysis of drugs or treatments, to assist the practi-tioner and patient in choosing the optimal treat-ment. In addition, assessing the utility and quality of life in every state of a particular disease MS in
our case is relevant as a comprehensive measure
of health outcome that includes both mortality and morbidity.
Several studies have shown a significant reduc-tion in quality of life in patients with MS, especially as disability progresses [1015]. However, the
in-tangible costs are not easy to calculate, and they tend to be underestimated in studies reporting the costs of MS. Only a few of the cost of illness studies
on MS have included intangible costs [1215], and
those studies did not consider these costs uni-formly.
The aim of this study was to estimate the intangible costs of MS in patients at different disability stages. As it is difficult to express these losses in monetary values, we used quality of life measurements as an approach to estimating the intangible costs of MS.
Methods
We analysed data from 211 consecutive patients with definite MS, who attended our MS unit, where they were monitored and included in the European Database for Multiple Sclerosis (EDMUS). Their mean age was 41.6 years (SD: 10.7), 69% were female, and their mean Expanded Disability Status Scale (EDSS) score was 2.47 (SD: 2.05). We grouped the patients according to their disability (EDSS score) and compared the quality of life of the patients with that of a group of healthy controls (n/58), matched by age and sex. To include
subjects from a similar socio-demographic back-ground as the patients and in the same timeframe, we chose the healthy relatives who accompanied the patients as controls.
Patients were classified according to their disabil-ity (EDSS scores) into five groups, which represented the clinically relevant stages of MS: stage I (EDSS/0,
patient is not disabled but diagnosed with chronic disease; n/24); stage II (EDSS/13, minimally
disabled;n/124); stage III (EDSS/3.55.5, rather
disabled;n/36); stage IV (EDSS/67, still capable
of walking with aid; n/14); and stage V (EDSS/
7.59.5, unable to walk at all;n/8).
The intangible costs were calculated per patient per year in each disability stage and in the entire sample.
To estimate the loss of quality of life associated with the occurrence of a relapse, a separate analysis was performed in a subgroup of patients (n/14).
Quality of life was assessed in these patients when they first came to our MS unit with new neurolo-gical symptoms, when the occurrence of a relapse was confirmed by a neurologist, and at a different time when they were in a stable phase of their disease. Intangible costs due to a relapse were obtained from number of QALY lost because of a relapse, which was calculated as the difference in utility in patients during the relapse and during the stable period, multiplied by the value ascribed to a QALY, and then divided by the mean duration of the relapse.
We obtained the utility derived from the non-descriptive part of the EQ-5D, a generic, validated, preference-based instrument to measure quality of
life, using a VAS. In this scale, patients indicate their current health status on a scale between 0 (worst possible state) and 100 (best possible state), and the measure gives a global approach of their health-related quality of life. Patients and controls provided answers willingly and anonymously. The results of VAS were used to calculate utility and QALY for each group of patients and the controls (general population), according to the formula:
ð1uÞð1vÞ2:29
where u is the utility value and v the result of the VAS [17].
The formula u/1/(1/v)q, describes the
pre-viously established relation between VAS scores and utility [6,7,9,17]. We used the value of
q/2.29, as calculated by Torranceet al. [17], where q is derived from a fictitious ‘person mean’, a person whose responses are all identical to the mean responses of the sample. In this study, the fitted disutilitydisvalue relation for the person
mean was u/v2.29, based on theoretical
considera-tions and risk function estimaconsidera-tions. The fitting process used simple straight-line regression through the origin on the natural log transformation. The fitted function is then re-expressed in utilityvalue
terms as u/1/(1/v)2.29, which we used in our
study.
A benchmark value oft55 000 has been ascribed
to each QALY lost [15,16]. The value of the QALYs lost by MS patients, who have a lower QALY than controls, is considered an intangible cost [3,15]. As the value ascribed to a QALY lost is controversial, and has not been specifically established in Spain, we performed a sensitivity analysis that ascribed different values to each QALY lost [15].
Patients and controls gave their written in-formed consent to participate in the study. The project was approved by the Ethics Committee of Bellvitge University Hospital and Bellvitge Biome-dical Investigation Institute, Barcelona, Spain.
Results
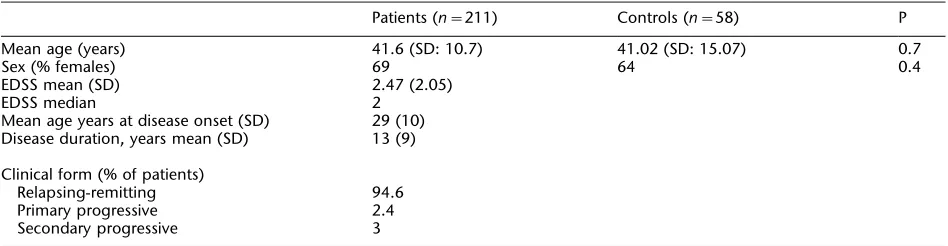
The characteristics of patients (n/211) and
con-trols (n/58) are described in Table 1. Age and sex
did not differ (P/0.05) between the two groups.
We obtained intangible costs by multiplying the number of QALY lost because of MS by the value ascribed to a lost QALY, t55 000. These costs were t0 for EDSS group I,t1100 for EDSS group II,t8250
for EDSS group III, t9900 for EDSS group IV, and t11 000 for EDSS group V (Table 2). Ast55 000 per
QALY lost is a debatable value [15], we used values of t33 000 andt77 000 per QALY lost (or different
‘willingness to pay’ for a QALY) in the sensitivity analysis, and obtained a similar progression of costs with increasing EDSS scores.
The mean difference in utility due to a relapse in a subgroup of patients (n/14) was 0.065. The mean
duration of the relapse in these patients was 55.07 days (SD: 32.5), estimated from their clinical charts, giving the intangible cost of t539 per patient and
relapse (Table 3). The sensitivity analysis ascribed different values to a QALY lost, and estimated the total intangible cost per patient and relapse as
t323.4754.6 (Table 3).
Discussion
Intangible costs concern pain, grief, anxiety and social handicap, and are difficult to quantify and translate into monetary values. However, they may be relevant in a chronic disease such as MS, especially in the higher stages of disability.
[image:12.595.61.535.579.702.2]Imprecision is assumed when estimating intan-gible costs because of the subjectivity involved in estimating parameters, such as quality of life or utility, and the lack of validated published studies in Spain that assign monetary values to quality-of-life measurements. We consider that the inherent imprecision when estimating quality of life is a limitation of our study. We used the VAS, which
Table 1 Baseline characteristics of patients and controls, matched by age and sex, where quality of life was analysed
Patients (n/211) Controls (n/58) P
Mean age (years) 41.6 (SD: 10.7) 41.02 (SD: 15.07) 0.7
Sex (% females) 69 64 0.4
EDSS mean (SD) 2.47 (2.05)
EDSS median 2
Mean age years at disease onset (SD) 29 (10) Disease duration, years mean (SD) 13 (9)
Clinical form (% of patients)
Relapsing-remitting 94.6
Primary progressive 2.4
Secondary progressive 3
has a strong ‘floor effect’, and tends to overestimate quality of life perception in patients. However, it also has the advantage of being easily applicable.
There are many significant controversies relating to utility measurement [5]. We used the VAS to obtain utility in an indirect way because the VAS alone does not measure health utility. Many exam-ples of this method have been reported, and have shown that utility measurements and VAS scores are highly correlated [69,17]. Based on previous
studies and the presumed controversy about utility measurement, we considered it reasonable to ob-tain the predicted utility derived from the VAS scores of patients and controls, which provided an easier method to estimate utility. The VAS is a simple instrument to measure health preferences, and it is easily applicable, inexpensive and quick to administer. It may imply less variability in utility obtained than other complex methods (choice-based, by time-trade off, multiattribute, etc.), and provide information that is more precise. Predicted utility appears to be a reasonable alternative for use in decision analysis in the absence of directly derived data.
To estimate the intangible costs in our cohort, we considered the method of Henriksson appro-priate [15], and applied it to the utility values of patients monitored in our MS unit. We obtained the utility values from the VAS, therefore, they are less accurate than those obtained from generic instruments to directly measure health-utility, such as the EQ-5D or HUI Mark 3, which have a multiattribute, preference-based system. We con-sider that our estimates of intangible costs consti-tute an interesting approach to these costs when estimating the minimum intangible costs to assign to MS, and that they are simpler to obtain using our method.
The value ascribed to a QALY in our study is based on the reference value calculated in 1996 in the US, and in 1998 in the UK [16], and it has already been applied to MS in a Swedish study [15]. When population-specific QALY values are not available, we believe that using reference values together with a sensitivity analysis [15] may be appropriate as an approach to estimate intangible costs in MS patients. Attaching a common value to a QALY lost implies that individual preferences are over-ridden, and that the over-riding variations appear at different times when quality of life is evaluated. Nevertheless, QALY constitute one of the best instruments available to measure quantity and quality of life, although the best method to trans-late QALY into monetary values remains contro-versial. A recent paper by Gyrd-Hansen [18] on this issue concluded that although a unique monetary value cannot be theoretically established for the QALY, a pragmatic perspective should be applied to obtain QALY values which could be used to im-prove efficiency in healthcare.
Another limitation of our study is the small sample, especially in higher stages of disability. Regardless of the small sample size, we included patients distributed across the entire spectrum of MS, and our results may approximate what occurs in the general MS population. In the case of patients having a relapse, although the sample we used to estimate utility was very small (n/14), the
[image:13.595.60.534.97.164.2]value obtained for the difference in QALY due to a relapse (0.065) is similar to that obtained by
Table 3 Measure of quality of life and estimate of intangible costs in MS patients having a relapse
n/14 During relapse
During
stabilisation period
Age (years) 38.2 (SD: 9.9)
Female (%) 57%
EDSS (mean/median/SD) 4.2/4/1.9 3.1/3/2.4 VAS mean score (SD) 49.7 (25.8) 57.3 (26) QALY mean (SD) 0.71 (0.2) 0.77 (0.3) Difference in QALY-mean 0.065 (0.15)
Mean (SD) duration of a relapse days
55.07 (32.5)
Intangible costs per patient and relapse
If one QALY/t55 000 t539
If one QALY/t33 000 t323.4
If one QALY/t77 000 t754.6
[image:13.595.61.289.528.684.2]VAS, visual analogue scale; QALY, quality of the adjusted life years; EDSS, Expanded Disability Status Scale; SD, standard deviation.
Table 2 Intangible costs in euros per patient/year according to disability (EDSS stages)
EDSS 0 1.03.0 3.55.5 6.07.0 7.59.5 Mean Controls
No. of patients 24 124 36 14 8 211 58
VAS mean score 75.5 71.7 52.1 52.9 49.4 67.3 75.5
QALYs (mean number) 0.92 0.9 0.77 0.74 0.72 0.84 0.92
Cost (if a QALY lost/t55 000) 0 1100 8250 9900 11000 4400
Cost (if a QALY lost/t33 000) 0 660 4950 5940 6600 2640
Cost (if a QALY lost/t77 000 0 1540 11550 13860 15400 6160
EDSS, Expanded Disability Status Scale; VAS, Visual Analogue Scale; QALY, equality-adjusted life years. Costs were calculated for the five groups based on the EDSS stages and in the entire sample. A sensitivity analysis was also performed, which ascribed different values to each QALY lost.
Henrikssonet al. (0.063) [15], which may indicate the reliability of our results.
Intangible costs have been included in some studies of the cost of MS [1215]. The results
obtained with our approach show a similar progres-sion of costs with the progresprogres-sion of disability as those reported previously and when a relapse of MS occurs, although our values are lower than the published values in all EDSS stages. This difference might be explained by a more positive perception of MS in our patients, but it may also be a consequence of overestimating quality of life by the VAS and methodological differences. Thus, we believe that our results are a minimum approach to estimate the intangible costs due to MS to take into account when assessing the total costs of the disease.
According to our estimates, the intangible costs of MS reach betweent1100 andt11 000 per patient
per year, depending on the extent of disability. The occurrence of a relapse implies an intangible cost of
t539.
Our work is intended to highlight the relevance of estimating intangible costs in a chronic disease such as MS. We believe these costs are important contributors to the global costs of the disease, and that they increase with the progression of disability and relapses. However, the relevance of intangible costs involves more than their monetary value because the global conception of cost implies the inclusion of a measure of other costs of MS, including quantity and quality of life. This would allow comparisons with the costs of other diseases. Intangible costs may be comparable among differ-ent MS populations because the patidiffer-ents’ quality of life would not be affected by parameters such as unit costs, resource consumption or healthcare systems, which affects direct and indirect costs when calculated between different countries; this is a major problem in assessing costs in multicentric studies.
Intangible costs are easy to obtain with our approach. Even if the method to calculate these costs is controversial (due to subjectivity of quality of life parameters, suitability of quality of life scales, utilities measurement, QALY monetary values, and, in general, to the lack of a standardised methodol-ogy), we consider that intangible costs should be included in costs analysis of MS.
Acknowledgements
We thank Dr Kobelt for her suggestions and for reviewing the manuscript, and our own institutions for funding this project.
References
1. Weinshenker BG, Bass B, Rice GPA. The natural history of multiple sclerosis: a geographically based study.Brain 1989;112: 13346.
2. Bufill E, Blesa R, Galan I, Dean G. Prevalence of multiple sclerosis in the region of Osona, Catalonia, Northern Spain.J Neurol Neurosurg Psychiatry 1995;58: 57781.
3. Kobelt G, Pugliatti M. Cost of multiple sclerosis in Europe.Eur J Neurol2005;12: 6367.
4. Patwardhan MD, Matchar DB, Samsa GP, McCoy DC, Williams RG, Li TT.Costs of multiple sclerosis by level of disability: a review of literature.Mult Scler 2005;
11: 23239.
5. Fisk JD, Brown MG, Sketris IS, Metz LM, Murray TJ, Stadnyk KJ.A comparison of health utility measures for the evaluation of multiple sclerosis treatments.
J Neurol Neurosurg Psychiatry2005;76: 5863.
6. Havranek E, Simon TA, L’Italien G, Smitten A, Hamber AB, Chen Ret al. The relationship between health perception and utility in heart failure patients in a clinical trial: results from an OVERTURE substudy.
J Card Fail 2004;10: 33943.
7. Mrus JM, Yi MS, Freedburg KA, Wu AW, Zachin R, Gorshi Het al. Utilities derived from visual analog scale in patients with HIV/AIDS.Med Decis Making 2003;23: 41421.
8. Naglie G, Tomlinson G, Tansey C, Irvine J, Ritvo P, Black SEet al. Utility-based quality of life measures in Alzheimer disease.Qual Life Res2006;15: 63143. 9. Torrance GW, Feeny D, Furlong W. Visual analog
scales: do they have a role in the measurement of preferences for health states? Med Decis Making 2001;
21: 23934.
10. The Canadian Burden of Illness Study Group.
Burden of multiple sclerosis: part II: quality of life.Can
J Neurol Sci1998;25: 3138.
11. Grima DT, Torrance GW, Francis G, Rice G, Rosner AJ, Lafortune L. Cost and health related quality of life consequences of multiple sclerosis. Mult
Scler2000;6: 9198.
12. Kobelt G, Lindgren P, Parhin D, Francis D, Johnson M, Bates D et al. Costs and quality of life in multiple sclerosis. A cross-sectional study in the United
Kingdom. EFI Research Report No. 398, 2000.
13. Kobelt G, Lindgren P, Smala A, Jo¨nson B.Costs and quality of life in multiple sclerosis. An observational study in Germany.HEPAC 2001;2: 6068.
14. Kobelt G, Berg J, Atherley D, Hadjimichael O, Jo¨nson B.Costs an quality of life in multiple sclerosis, a
cross-sectional study in the USA. SSE/EFI Working Paper
Series in Economics and Finance No. 594, December 2004: 234.
15. Henriksson F, Fredrikson S, Masterman T, Jo¨nson B.Costs, quality of life and disease severity in multiple sclerosis: a cross-sectional study in Sweden.Eur J Neurol
2001;8: 2735.
16. Newhouse JP. US and UK health economics: two disciplines separated by a common language? Health Econ1998;7: S7992.
17. Torrance GW, Feeny DH, Furlong WJ, Barr RD, Zhang Y, Wang Q.Multiattribute utility function for a comprehensive health status classification system. Health Utility Mark 2.Med Care 1996;34: 70222.
18. Gyrd-Hansen.Willingness to pay for a QALY, theore-tical and methodological issues. Pharmacoeconomics
ESTUDIO DEL COSTE DE LA
ESCLEROSIS MÚLTIPLE EN EL BAIX
LLOBREGAT. ANÁLISIS EN FUNCIÓN
DE LA DISCAPACIDAD.
TESIS DOCTORAL
Virginia Casado Ruiz.
Director de tesis: Txomin Arbizu Urdiain
Programa de Doctorado en Investigación de la Fisiopatología de la
Enfermedad de la Universidad de Barcelona
.
BioMedCentral
BMC Health Services Research
Open Access
Research article
Direct and indirect costs of Multiple Sclerosis in Baix Llobregat
(Catalonia, Spain), according to disability
Virginia Casado*
1, Sergio Martínez-Yélamos
1, Antonio Martínez-Yélamos
2,
Olga Carmona
3, Lucia Alonso
1, Lucia Romero
1, Esther Moral
1,
Laura Gubieras
1and Txomin Arbizu
1Address: 1Multiple Sclerosis Unit, Institute of Biomedical Investigation, University Hospital of Bellvitge, Faculty of Medicine, Campus Bellvitge, University of Barcelona (IDIBELL), Barcelona, Spain, 2Neurology Department, Hospital de San Lorenzo, Viladecans, Barcelona, Spain and 3Neurology Department, Hospital de Figueres, Girona, Spain
Email: Virginia Casado* - [email protected]; Sergio Yélamos - [email protected]; Antonio Martínez-Yélamos - [email protected]; Olga Carmona - [email protected]; Lucia Alonso - [email protected]; Lucia Romero - [email protected]; Esther Moral - [email protected]; Laura Gubieras - [email protected]; Txomin Arbizu - [email protected]
* Corresponding author
Abstract
Background: Multiple sclerosis (MS) is an incurable chronic disease that predominantly affects young adults. It has a high socio-economic impact which increases as disability progresses. An assessment of the real costs of MS may contribute to our knowledge of the disease and to treat it more efficiently. Our objective is to assess the direct and indirect costs of MS from a societal perspective, in patients monitored in our MS Unit (Baix Llobregat, Catalonia) and grouped according to their disability (EDSS).
Methods: We analysed data from 200 MS patients, who answered a questionnaire on resource consumption, employment and economical status. Mean age was 41.6 years, mean EDSS 2.7, 65.5% of patients were female, 79.5% had a relapsing-remitting course, and 67.5% of them were receiving immunomodulatory treatment (IT). Patients were grouped into five EDSS stages. Data from the questionnaires, hospital charts, Catalan Health Service tariffs, and figures from Catalan Institute of Statistics were used to calculate the direct and indirect costs. The cost-of-illness method, and the human capital approach for indirect costs, were applied. Sensitivity analyses were performed to strengthen results.
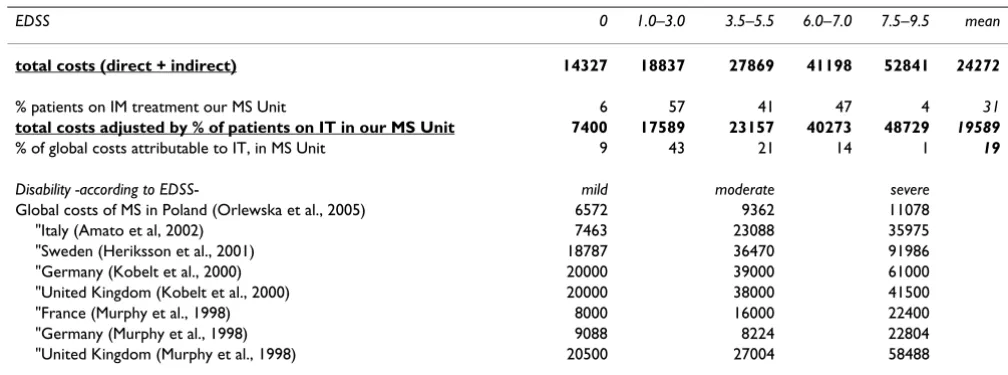
Results: The mean total annual cost of MS per patient results 24272 euros. This cost varied according to EDSS: 14327 euros (EDSS = 0), 18837 euros (EDSS = 1–3), 27870 euros (EDSS = 3.5–5.5), 41198 euros (EDSS = 6–7) and 52841 euros (EDSS>7.5). When the mean total annual costs was adjusted by the mean % of patients on IT in our Unit (31%) the result was 19589 euros. The key-drivers for direct costs were IT in low EDSS stages, and caregiver costs in high stages. Indirect costs were assessed in terms of the loss of productivity when patients stop working. Direct costs accounted for around 60% of total costs in all EDSS groups. IT accounts from 78% to 11% of direct costs, and decreased as disability progressed.
Conclusion: The total mean social costs of MS in a cohort from Baix Llobregat (Catalonia) were estimated at 24272 euros per patient/year, and ranged between 14327 euros (EDSS = 0) and 52841 euros (EDSS = 7.5–9.5). Total costs, and particularly informal and direct costs, increased as the disability progressed. IT should be able to delay the progression of disability to be efficient and not only effective.
Published: 01 November 2006
BMC Health Services Research 2006, 6:143 doi:10.1186/1472-6963-6-143
Received: 17 May 2006 Accepted: 01 November 2006
This article is available from: http://www.biomedcentral.com/1472-6963/6/143 © 2006 Casado et al; licensee BioMed Central Ltd.
BMC Health Services Research 2006, 6:143 http://www.biomedcentral.com/1472-6963/6/143
Background
Multiple sclerosis (MS) is a chronic, demyelinating inflammatory disease of the central nervous system (CNS). Its aetiology is still unknown. In Spain, the preva-lence of MS is 53–58 per 100000 [1,2]. It predominantly affects young adults, with onset in third decade of life, and females (ratio 2:1).
The prognosis for MS is unclear and is probably influ-enced by genetic, biochemical and clinical factors. Life expectancy seems to be relatively unaffected by MS, but morbidity is considerable: 50% of patients will need help to walk 10 years after diagnosis, according to natural his-tory studies[3]. However, recent studies show that the dis-ease has a more benign evolution[4].
MS represents the second most common cause of disabil-ity in young adults, after road accidents, and has a high socioeconomic impact.
In the last decade immunomodulatory treatments (IT) have demonstrated their efficacy [5-8] in reducing the number of relapses and, to a lesser extent, in slowing the progression of the disability. However, these tendencies have still not been confirmed for the long term. As treat-ments are expensive, a question arises: are they efficient, as well as being effective? In other words, because of their beneficial effect and despite their elevated costs, is IT more cost-saving than other therapeutic options in the long term? Many cost-effectiveness analyses have been pub-lished [9-17] with controversial results.
It is essential to assess the real cost of MS if we are to make a cost-effectiveness analysis whose results can be applied to daily clinical practice. Cost-utility analysis, a particular type of cost-effectiveness analysis in which outcomes are measured in terms of quality of life, may be particularly appropriate for a disease like MS, as the assessment of quality of life integrates physical and psychological com-ponents of wellbeing which are affected by the disease [18]. The cost of MS has been calculated in several coun-tries [19-32]. These studies have shown the significant economic impact of the disease and how it increases as disability progresses. Cost-of-illness studies are of particu-lar interest because they show costs of every item related to the disease, thus revealing the main factors that contrib-ute to the total costs.
Our study, the first of this type in our region (Catalonia, Spain), attempts to assess the overall cost to society of MS, calculated from a population of patients monitored in our MS Unit. The approach that we used could be extended to assess MS costs nationwide. Our intention was also to show how the costs of MS change as the disease progresses. Therefore, costs were calculated in different
stages of disability as measured by the EDSS (Expanded Disability Status Scale).
A prevalence cost-of-illness analysis, like the one we present, measures a disease's baseline costs to society. Such an analysis could be useful for making decisions on research investments. In contrast, incidence based cost studies are more useful when estimating the effect of a treatment on future costs.
Methods
We performed an observational cost-of-illness study [33,34] for MS, a chronic disease, using a prevalence approach, which entails estimating all costs for a particu-lar population. We calculated the cost of MS per patient over a given period of time (1 year) in a specific geograph-ical area (Baix Llobregat, Catalonia, Spain). We estimated costs for a group of patients whose results could be extrap-olated to the general population (a "bottom-up" approach). Data were collected in those patients retro-spectively, as they referred to what occurred previous to the moment when they answered the questionnaire elab-orated. A "top down" approach would have involved using data from database and statistical registers. Such an approach is not suitable for a chronic disease like MS. It would tend to underestimate total costs, as information would not be available for calculating every cost in the patient population (e.g. indirect costs).
Patients'
We calculated direct and indirect costs due to MS for a group of 200 patients monitored in our MS Unit, who answered, consecutively, a questionnaire elaborated for that purpose. Recently diagnosed patients were excluded from the study, as a complex, disability-focused question-naire could have given them a negative perception of their disease. Patients who were participating in clinical trials at the time of the study were also excluded, as they tend to consume more resources than the general MS population (outpatients' visits, tests...). We considered the clinical and demographic characteristics of the patients in the study to be similar to those of the general MS population seen in our clinics. No statistically significant differences were found between patients who answered the question-naire and patients who did not (except for the percentage of patients on IT, see Table 1).
BMC Health Services Research 2006, 6:143 http://www.biomedcentral.com/1472-6963/6/143
(EDSS = 7.5–9.5, patient is unable to walk at all): 11 patients. Patients' EDSS scores were obtained from their medical charts.
Data collection
The questionnaire was anonymous and voluntary. It was mailed to 454 patients with a statement of informed con-sent to be signed by patients and caregivers. A letter explaining the purpose of the study was also sent to every patient. We obtained 200 responses (44%). Data were col-lected on socio-demographic and clinical characteristics; work-status; resource consumption; and costs attributable to MS during the previous 15–365 days. The length of the recall period varied according to the item in question, to minimize any possible bias due to a patient's lack of memory. The recall periods for the different items were as follows:
-previous year for hospitalisation, need for caregivers and sick leave, due to MS
-previous 3 months for outpatient visits
-previous 15 days for drug treatments, rehabilitation, vis-its to the General Practitioner, ambulance displacements, laboratory-imaging tests, and days of leisure time and/or daily activities lost due to MS.
A recall period of 1–3 months has been shown to be gen-erally reliable for retrospective data. For more important or less frequent events, such as hospitalisation, a 12-month recall period is considered appropriate [25-27,30,32].
Questions about home modifications referred to the full duration of the disease. The unit costs for adaptations were not available for our region. Therefore, we used the mean cost per patient per year of home adaptations made because of MS, which has previously been calculated in the European Community [25-27,29].
Data obtained from questionnaires were verified and completed with data taken from inpatient records, medi-cal files and the Medimedi-cal Records Department, to improve reliability of the patients' responses. Data were then annu-alised when necessary. The study period was one year, from 1-8-2001 to 31-7-2002.
The Ethical Committee of the University Hospital of Bel-lvitge and the Institute for Biomedical Investigation of Bellvitge (Barcelona, Spain), where the study was carried out, gave their approval for the whole project.
Unit costs
Unit costs were obtained from: Catalan Health Institute tariffs (costs of: procedures, visits to physicians, hospitali-sations); the Catalan Institute of Statistics (the minimum hourly wage, the average costs of labour in each sector of activity, the median time to find a job in Spain); market prices for pharmacological treatments (Drugs and Chemists Pharmacy Database of the General Council of Official Colleges of Pharmacists, 2004); and investments required to over-come architectural barriers. Every unit cost was updated to the equivalent number of euros in 2004, as the resources consumed in 2001 and 2004 did not differ greatly.
Direct costs
We calculated the direct costs by multiplying the resources consumed per patient by their unit costs. The costs of hos-pitalisation, ambulatory assistance, treatments, rehabilita-tion, transport, investments to overcome architectural barriers, disability aids, and informal care (provided by a non-paid caregiver who was a relative in most cases) are included as direct costs [25-27,30].
Indirect costs
[image:18.612.53.557.99.213.2]We used a Human Capital Approach to estimate the indi-rect costs. This approach involves analysing MS-attributa-ble loss of productivity, in terms of morbidity and mortality. The number of days lost due to sick leave and changes in the work status of patients and caregivers
Table 1: The baseline characteristics of patients analysed.
N = 200 N = 254 p
Mean age -years- 41.6 42.1 0.6
Sex (%female) 65.5 63.3 0.6
EDSS (mean) 2.7 2.8 0.9
EDSS (median) 2 2 0.6
Mean disease duration (years) 12.3 11.9 0.7
Clinical form of MS (% of RR/SP/PP) 79.5/13/7.5 81.9/8.7/9.4 0.3
Mean number of relapses during the previous year 0.3 0.3 0.2
% of patients on IT 67.5 45.7 0.0
No differences were found between patients who answered the questionnaire (N = 200) and patients who did not answer it (N = 254), except for the percentage of patients on IT.