Non-invasive assessment of liver fibrosis using ARFI with
pathological correlation, a prospective study
Wan Wan Yap,* Rathy Kirke,* Eric M. Yoshida,** David Owen,*** Alison C. Harris*
* Department of Abdominal Radiology.** Division of Gastroenterology.*** Department of Pathology. University of British Columbia, Vancouver General Hospital, Canada.
ABSTRACT
Introduction.ARFI is a new technique that uses acoustic push pulse to generate tissue displacement resul-ting in shear wave propagation, can be used to measure elasticity of tissue. We aim to assess feasibility of ARFI as a non-invasive method to measure liver fibrosis compared to histological fibrosis scores and to com-pare our results with the published pooled-meta-analysis cut off values. Material and methods. Prospective study to compare median velocities of ARFI shear wave measurements (Virtual Touch Imaging™ ACUSON S2000, Siemens, Mountain View CA) with Batts and Ludwig liver fibrosis scoring system F0-F4. Results. 70 patients (mean = 49 years) were included. Etiologies were chronic hepatitis C (n = 43), chronic hepatitis B (n = 7) and others (n = 20). Median ARFI values (m/sec) for fibrosis stages and inflammatory stages measured were F0: 1.52, 1.42; F1: 1.50, 1.37; F3: 2.36, 2.41 and F4: 2.61. Areas under the curve for grade 3 = 0.875, stage 3 = 0.867; grade 2 = 0.4, stage 2 = 0.3.Using the cut-off ARFI value of 1.34 m/s for F ≥ 2 suggested in the meta-analysis, we found sensitivity of detecting true F ≥ 2 is 68%, specificity 66%, PPV 74% and NPV 59%. For F ≥ 3 using the cut-off ARFI value of 1.55 m/s, we found sensitivity of 95%, specificity 86%, PPV 74% and NPV 98%. No stage 4 was compared due to insufficient cases. Conclusion. ARFI has strong correlation with higher fibrosis scores compared to lower. When compared to the pooled meta-analysis cut off values, the sensitivity and specificity for detecting true F ≥ 3 are higher than that of F ≥ 2.
Key words. Liver biopsy. Chronic liver disease. Histological score. Meta-analysis.
Correspondence and reprint request: Wan Wan Yap, MBChB, MRCS, FRCR Department of Abdominal Radiology, Vancouver General Hospital 899 West 12th Avenue, Vancouver, BC, V5Z 1M9, Canada Tel.: +177 8847-8060
E-mail: [email protected]
Manuscript received: January 29, 2013. Manuscript accepted: February 18, 2013. INTRODUCTION
Chronic hepatitis, in particular secondary to hepa-titis C remains an important public health issue as it
affects 3% of the population worldwide.1 The sequelae
of chronic hepatitis are liver fibrosis, cirrhosis, liver failure and the development of hepatocellular carcino-ma (HCC). The assessment of liver fibrosis is there-fore clinically important in predicting outcome and prognosis. HCCs rarely develop without the
under-lying fibrosis and cirrhosis.2 Traditionally, liver
biop-sy has been used and still is the gold standard
method for staging fibrosis.3,4 The procedure has
se-veral disadvantages; its invasive nature has associated
morbidity and mortality,5 heterogeneous involvement
of liver fibrosis and inter-observer variability in
his-tological grading of the specimens.6 Biopsying a
small core of tissue thus may not be representative of the full extent of disease.
As a consequence, there is considerable research into finding the best non-invasive method of asses-sing liver fibrosis. Several serum biomarkers have
been shown to predict severe liver fibrosis.7,8 simple
scoring systems which incorporate patients’ routine laboratory measurements have been devised to
impro-ve the diagnosis of liimpro-ver fibrosis9 and elastography
using ultrasound and magnetic resonance based
ima-ging have also been developed.10 There has been
con-siderable interest in the development and usage of transient elastography, (Fibroscan® Echo Sens, Paris France) which has been shown to be a promi-sing non-invasive method for the assessment of liver
fibrosis.11 Fibroscan® is limited by obesity for
patients with body mass index exceeding 28,12
There is also a lack of anatomical correlation with high-resolution ultrasound imaging and the absence of diagnostic imaging capability (e.g. surveillance for hepatocellular carcinoma, portal hypertensive changes and portal vein thrombosis).
Acoustic radiation force impulses (ARFI) is a new imaging tool, which uses acoustic-push pulse to ge-nerate acoustic shear wave on a region of interest and uses tissue displacement response to estimate the elasticity of the particular tissue. The speed of shear wave propagation is expressed in meters per second (m/s). The peak displacement amplitude is in-versely proportional to the elasticity of tissue which is based on Young modulus. It has been shown that the time to peak displacement and recovery time
correlates with tissue stiffness.13 To generate useful
images, ultrasound tracking algorithm is utilised and commercially available ultrasound machines have since been developed which is able to incorpo-rate acoustic radiation forces geneincorpo-rated on tissues and monitor their displacements, using correlation-based methods. The data collected is then used to generate transient information of the time to peak tissue displacement and recovery time which can be
use to derive the tissue stiffness.14
There is increasing interest in this technique with several studies published in the recent literature comparing ARFI with other non-invasive methods and liver biopsies as reference standards in the assessment of liver fibrosis. The pooled meta-analysis
by Friedrich-Rust, et al. attempts to find a cut-off
ARFI value for each histological fibrosis stage.15
In several recent studies, ARFI has been compared
with other non-invasive techniques16 or liver biopsies
but in these, biopsy was not performed at the time of
ARFI measurement.17 Additionally, to our knowledge,
there has been no prospective study that compares the cut-off ARFI value and same day liver biopsy with the recommended pooled-meta-analysis ARFI values.
The primary end point of our study is to compare ARFI values with the histological assessments of liver fibrosis and inflammatory activities expressed in stage and grade respectively, which is the current gold standard.
A secondary end point is a comparison of our re-sults with the cut-off values for each histological staging recommended in the pooled meta-analysis, the largest series to date.
MATERIAL AND METHODS
No direct financial support was provided for this study. Ethics approval was obtained from the
Uni-versity of British Columbia Ethics Research Board. Consecutive patients who were referred for percuta-neous core liver biopsy from the Division of Gas-troenterology were recruited. Study period was from September 2009 to January 2012.
Inclusion criteria
All patients referred for ultrasound-guided percu-taneous liver biopsies with a history of chronic liver disease for the assessment of liver fibrosis. Patients who were able to provide full informed consent for the study in addition to the required informed con-sent for the liver biopsies.
Exclusion criteria
Patients who were unable to provide full infor-med consent for the study even though consent via family members may have been obtained for the cli-nically needed liver biopsy. Abnormal coagulation profiles that preclude liver biopsies based on depart-mental protocol; international normalized ratio (INR) > 1.5, prothrombin time > 50 seconds and platelet count < 50,000/mL. Relative and absolute contraindications to liver biopsy e.g. biliary ductal dilatation, ascites, and presence of hepatocellular carcinoma.
Ultrasound
All patients attended for liver biopsies had abdomi-nal ultrasounds performed by qualified technologists prior to the biopsies. After it was deemed safe to biop-sy, with consent obtained both for the study and the biopsy, the radiologists (WWY and RK with 5 years of ultrasound experience each) then positioned the patient appropriately and selected the area to biopsy. ARFI measurements were obtained from the chosen location. The measurements were taken from the right lobe, not more than 5 cm from the skin surface, using an intercostal approach. After the measurements were recorded, a single core needle biopsy using an 18G biopsy needle, was taken from the area in which the measurements were made. Specimens were fixed in formalin and sent to the laboratory. Patients recovered and were monitored in the department for one hour prior to discharge.
Acoustic radiation frequency impulses
ARFI technology uses tissue strain imaging to assess tissue stiffness. A baseline measurement ,
obtained by passing a diagnostic intensity ultra-sound pulse through the tissue to be assessed, and a short duration (about 100 microseconds) high inten-sity ‘push’ pulse is subsequently transmitted through the same tissue. Diagnostic intensity tracking beams are then used to assess the magnitude
of displacement.18,19 Most tissues show displacement
magnitudes between one and 20 microns. Peak dis-placement time is usually less than one millisecond. Most tissues revert to their original state within
five milliseconds.20,21
Siemens ACUSON S2000 (Virtual Touch Ima-ging™, Siemens, Mountain View, CA) Virtual Touch Tissue quantification method of ARFI with a diagnostic 1-4 MHz transducer was used for our study. In this method, the velocity of the propaga-ted shear wave measured by the generation of a numerical value usually expressed in meters per second (m/s), which correlates with the stiffness of the tissue. A conventional B mode ultrasound image was obtained and an ROI (region of interest) was placed within the tissue. A median of 10 mea-surements were obtained for each patient, expressed in m/s, and median values calculated. All measure-ments were taken under direct sonographic visuali-zation from the right lobe of the liver. Factors such as aortic pulsation, respiratory fluctuations and presence of food in the stomach may be responsible
for left lobe measurements being less accurate22
(Figure 1) (e.g. of ARFI measured on ultrasound). The Batts and Ludwig scoring system for chronic hepatitis and liver fibrosis was used where necro-in-flammation is graded and fibrosis is staged using a
five-point scale, grade and stage 0-4.23 The biopsy
core was deemed adequate if the specimen was two cm or longer in length. Grading is a measure of the severity of necro-inflammation with lymphocytic pie-cemeal necrosis, lobular inflammation and necrosis
as criteria. Numerical values are given.23
• Grade 0. Portal inflammation only or no activity. • Grade 1. Minimal and patchy involvement. • Grade 2. Mild-involving some of the portal
tracts.
• Grade 3. Moderate involving all portal tracts. • Grade 4. Severe-may have bridging fibrosis.
The fibrosis score is as follows:
• Stage 0. No fibrosis.
• Stage 1. Fibrosis confined to portal tracts. • Stage 2. Fibrosis extending into the periportal
region with rare portal to portal septae.
• Stage 3. Many fibrous septae extending into the parenchyma but no cirrhosis.
• Stage 4. Cirrhosis.
Statistical analysis
The primary outcome measure is the median ARFI value computed from 10 measurements per pa-tient. As was done in previous research with ARFI scores, the median was used to remove effects of any unusual observations (a companion analysis was carried out using mean ARFI scores, but results were not different from those using median ARFI scores). SPSS version 20 was used for all statistical analysis. Scatterplots, Pearson and Spearman corre-lation coefficients were computed to assess associa-tion between ARFI values and fibrosis stage and grade. The cut-offs identified in a meta-analysis by
Friedrich-Rust, et al.15 were used to define
signifi-cant and severe fibrosis. Using these binary defini-tions, and each binary split of fibrosis grade and stage, two-by-two tables were constructed and sen-sitivity, specificity, positive predictive value and negative predictive value computed. Receiver opera-ting characteristic (ROC) curves, and area under the curve, were calculated for each two-by-two table.
RESULTS
Seventy-one patients met the inclusion criteria. One patient was excluded due to complete necrosis of the core biopsy specimen obtained as a result of acute hepatic necrosis secondary to autoimmune hepatitis. ARFI values of 70 patients were available for analysis. There were 31 females and 39 males, mean age of 49 years (range 20-83 years). Etiologies of the chronic liver disease were divided into 43 chronic hepatitis C, 7 chronic hepatitis B and 20 others comprised of 7 autoimmune hepatitis, 1 pri-mary biliary cirrhosis, 2 alcoholic hepatitis, 5 non alcoholic steatohepatitis (NASH), 2 cryptogenic hepatitis and cirrhosis, 1 cholestatic hepatitis, 1 me-thotrexate induced hepatitis and 1 Wilson’s disease.
DISCUSSION
In patients with chronic liver disease, the assess-ment of fibrosis is paramount in aiding clinical deci-sion-making, to discuss prognosis and in treatment planning which may include transplantation. Tradi-tionally, histopathological grading is the gold stan-dard. With the advent of non-invasive imaging techniques, there is increasing interest in the utility of these methods, with the hope of reducing the number of invasive liver biopsies needed.
Currently, the most widely used non-invasive technique is transient elastography (TE- Fibroscan®). This technique is influenced by gender, by body
mass index and by metabolic syndrome.24 Obesity is
one of the limiting factors, but this has been partially solved by the development of a large XL probe, designed to assess liver more than 2.5 cm from the skin. However, the validity and cut-off value for this probe in the assessment of fibrosis has not been
established.25 The lack of real-time morphological
assessment of the liver using this technique also potentially limits its use.
ARFI technology provides non-invasive informa-tion about mechanical properties of tissue, with additional advantage of concomitant high quality imaging, since ARFI technology is incorporated into a conventional ultrasound machine. The asses-sment of the background liver, complications of chronic liver disease (e.g., development of hepatocel-lular carcinoma or ascites), and Doppler asses-sment of hepatic vasculature can all be performed
The authors of the pooled meta-analysis15 with
which our results are compared, have defined F ≥ 2
as significant fibrosis, F ≥ 3 as severe fibrosis and
F = 4 as cirrhosis. They chose optimum cut-off values
of 1.34 m/s for F ≥ 2, 1.55 m/s for F ≥ 3 and 1.80 m/s
for F = 4. Using the cut-off ARFI value of 1.34 m/s for significant fibrosis as suggested by the meta-analysis, our study found a sensitivity of detecting
true F ≥ 2 is 68%, specificity of 66%, positive
predic-tive value (PPV) of 74% and negapredic-tive predicpredic-tive value
(NPV) of 59%. For F ≥ 3 (severe fibrosis) using the
cut-off ARFI value of 1.55 m/s, our study found a sensitivity of 95%, specificity of 86%, PPV of 74% and NPV of 98%.
We were not able to compare the cut-off values sug-gested by the meta-analysis for stage 4 as we only have one patient has histologically proven cirrhosis.
Table 2. Mean, standard deviation and range of ARFI-Median values at each level of Batt and Ludwig fibrosis grade.
Batt-Ludwig Mean (SD) Range Batt_Ludwig fibrosis Median (SD) ARFI-median Range
Inflammation ARFI-Median value (m/sec) Stage (m/sec)
Grade
0 1.52 (0.62) (1.13, 3.03) 0 1.42 (0.47) (1.09, 3.03)
1 1.50 (0.75) (0.87, 3.95) 1 1.37 (057) (0.87, 3.37)
2 1.58 (0.77) (0.92, 3.94) 2 1.38 (0.53) (0.92, 3.39)
3 2.36 (0.69) (1.38, 3.57) 3 2.41 (0.87) (1.38, 3.95)
4 N/A N/A 4 2.61 (0.75) (1.63, 3.57)
Table 1. Count and percent of patients at each level of Batt and Ludwig fibrosis grade and stage.
Batt-Ludwig Count of patients (%) Batt_Ludwig fibrosis Count (%) of patients
Inflammation grade Stage
0 8 (11) 0 15 (21)
1 21 (30) 1 16 (23)
2 26 (37) 2 18 (26)
3 15 (21) 3 14 (20)
4 0 (0) 4 7 (10)
Figure 2. Median value by Lud grade. Scatterplot ARFI-me-dian values (m/sec) and grading of liver necroinflammatory process.
Median of values
4.00
3.00
2.00
1.00
0.00
0.0 0.5 1.0 1.5 2.0 2.5 3.0
Lud grade
Figure 3. Median value by Lud stage. Scatterplot to
illus-trate the relation between the ARFI-median value (m/sec) and Batts and Ludwig stage.
Median of values
4.00
3.00
2.00
1.00
0.00
0.0 1 2 3 4
Lud grade
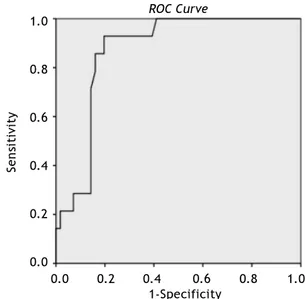
Figure 4. Area under the curve (AUROC) for Batts and
Lud-wig grade 3 = 0.875.
0.0 0.2 0.4 0.6 0.8 1.0
1-Specificity
Sensitivity
1.0
0.8
0.6
0.4
0.2
0.0
ROC Curve
0.0 0.2 0.4 0.6 0.8 1.0
1-Specificity
Sensitivity
1.0
0.8
0.6
0.4
0.2
0.0
Figure 5. Area under the curve (AUROC) for Stage 3 is
0.867.
ROC Curve
together with the evaluation of the severity of fi-brosis.
The potential clinical use of ARFI was shown in
vivo20 and since then, growing interest has
develo-ped in evaluating its clinical utility. This technique had been used to assess multiple organs with
varia-ble results, for example, the thyroid gland,26 the
tes-ticles27 and assessment of fibrosis post renal
transplant.28 Its use in the assessment of liver
fibro-sis is one of the most widely evaluated. Multiple stu-dies have been performed to assess the degree of fibrosis in the presence of known chronic liver
disease.17,25
Our results are comparable with other published data that showed that ARFI measurements increase as the liver fibrosis grade using Batts and Ludwig score, increase (2.61 m/s for fibrosis stage 4). At the lowest fibrosis score, in our study, unlike that by
Frederick-Rust, et al.17 no healthy volunteers were
One patient had a value of 3.03 m/s, but moderate hepatic steatosis (30% of fat) was found in this spe-cimen, which may have affected the measurement. In the presence of non-alcoholic fatty liver disease (NAFLD) or non-alcoholic hepatic steatosis (NASH), the correlation of ARFI value with fibrosis stage is not as good as those published on viral
he-patitis.25,29 The correlation with severe fibrosis and
cirrhosis is better using transient elastography with an XL probe than using ARFI in this group of patients.
Most of the other studies also utilized healthy volunteers with no known history of chronic liver disease and stage their fibrosis as F0 in the assumption that their livers are healthy without correlated with liver function tests or other serum biomarkers. In those populations in the published
study17 considerable variability was demonstrated in
the measured ARFI values with some volunteers having values that reached those with cirrhosis. In our study group, stage and grade 0 were histolo-gical proven, albeit small in number (Table 1), it showed that apart from one patient with high ARFI value and intercurrent hepatic steatosis, median ARFI values were below 1.5 m/s.
Multiple previous studies have managed to calcu-late cut-off values for their respective stages of fibrosis above grade 1, and some correlating with
histopathological findings. Lupsor, et al.30 showed
that the cut-off values (m/s) for fibrosis stages were:
1.19 (F ≥ 1), 1.34 (F ≥ 2), 1.61 (F ≥ 3) and 2.00
(F4). The study was performed in 112 patients. When they compared ARFI and TE, the areas under the receiver operating characteristic curves
(AUROC) were 0.709 vs. 0.902, P = 0.006 (F ≥ 1),
0.851 vs. 0.941, P = 0.022 (F ≥ 2), 0.869 vs. 0.926,
P = 0.153 (F ≥ 3) and 0.911 vs. 0.945, P = 0.331 (F4).
Sporea, et al.31 showed that the cut-off values for
predicting the stages of fibrosis were 1.19 m/s
for F ≥ 1 (based on Metavir staging system), 1.21 m/s,
(F ≥ 2 ), 1.58 m/s (F ≥ 3) and 1.82 m/s (F = 4). This
was conducted in 247 patients with hepatitis C and the correlation of 0.707 (Spearman r) was found.
In our pilot study32 of 21 patients, the median
values of the ARFI measurements and the histological fibrosis stage using modified Ishak score and Batts-Ludwig score were both highly significant (p < 0.01) with rho = 0.69 and rho = 0.72 respectively. The median ARFI for the pilot study population ranged from 0.92 to 4.17 m/sec. AUROC for the accuracy of ARFI imaging using both Ishak and Batts-Ludwig scores were 1.00 and 0.35, for the diagnosis of moderate fibrosis (histologic fibrosis
stage F ≥ 2) and 0.85 and 0.85 respectively for the
diagnosis of cirrhosis.
Our current study found that the correlations of ARFI values with fibrosis stage and inflammatory
grade ≥ 3 were 0.86 and 0.87, respectively. However,
the correlation was poorer for grade and stage < 3. We were not able to calculate meaningful ‘cut-off’ values for the respective fibrosis stages and inflam-matory grades as shown on the scatter plot. This differs from the other previous studies. The reasons may be due to our relatively small sample size and heterogeneous group of patients, but all our patients’ measurements were correlated with histo-logical grading and staging. Stage F2 represents ‘significant fibrosis’ group and F3 is ‘pre-cirrhosis’ and together with F1, they are also the intermediate group, the so-called ‘gray zone’, as other non-invasive methods have difficulty separating these groups reliably. Our study has shown that ARFI may be able to distinguish these two groups (F2 from F3) and this has clinical implication since treatments differ, especially in the context of viral hepatitis. There is emerging evidence however that liver biopsy has a 25% inherent error and the ‘gray zone’ is due to the artifact secondary to lower performance of
biopsy for the intermediate group.33
In the second section where we compare our
results with the pooled meta-analysis15 with cut-off
value of 1.34 m/s for significant fibrosis, our study
found that the sensitivity of detecting true F ≥ 2
was lower when compared to cut-off ARFI value of
1.55 m/s for F ≥ 3 (severe fibrosis). This
demonstra-tes that the ARFI values we obtained in our study population correlated better when fibrosis stage is 3 or higher, which also mean that ARFI may not be as useful in patients when fibrosis stages are 2 or lower, when those proposed cut-off values were used. As shown on the scatterplot (Figures 1 and 2), there is very little difference in the ARFI values between F0 and F2, which suggests that this method may not be as useful in differentiating between lower fibrosis grades.
values correlating with fibrosis stage or
inflamma-tory grade, unlike what was previously reported. 34
The limitations of our study include relatively small sample size, heterogenous etiologies for liver fibrosis which may affect the results. In addition, Batts-Ludwig fibrosis score is a 5 point scoring sys-tem which may be insufficient in differentiating the diverse group of patients who have fibrosis stages of 0 to 2. When we used Ishak scoring systems in our
pilot study,32 our correlation was better compared to
when the Batts-Ludwig system was used. However, the Batts-Ludwig scoring system was the only one used in our current study as, it once again reflects our clinical practice if ARFI was going to be utilized for day-to-day clinical use.
Although there had been promising results in re-cent published literature, we do not think that the cut-off values proposed by the pooled meta-analysis should be incorporating into clinical practice as
yet in view of the poor sensitivity of detecting F ≥ 2,
although better results seen for F ≥ 3. Further
research with a prospective longitudinal study for tracking temporal progression of fibrosis in patients at risk may be able to expand the use of ARFI.
In conclusion, our study showed that ARFI mea-surements increase as fibrosis stages and inflamma-tory grades increase. It correlates best with fibrosis grades and inflammatory stages 3 and above. In our study population, we did not find as good a correla-tion for F2 and lower, unlike that found in other published data. When we compare our results with the meta-analysis using the proposed cut-off values, the sensitivity, specificity, positive and negati-ve predictinegati-ve values are best when fibrosis stage is 3. These findings may be of value clinically as ARFI may be able to distinguish the two stages in the
intermediate group (F2 vs. F3) which also
tradition-ally known as the ‘gray zone’.
ABBREVIATIONS
• ARFI: acoustic radiation force imaging impulse. • AUROC: area under receiver operating
charac-teristic.
• HCC: hepatocellular carcinoma. • INR: international normalized ratio.
• m/s: meters per second.
• NAFLD: non-alcoholic fatty liver disease. • NASH: non alcoholic steatohepatitis. • NPV: negative predictive value. • PPV: positive predictive value.
• ROC: receiver operating characteristic.
• ROI: region of interest.
REFERENCES
1. Organization WH. Hepatitis C. Fact Sheet No 164. Gene-va: WHO1997.
2. Seeff LB, Hoofnagle JH. National Institutes of Health Con-sensus Development Conference: management of hepatitis C: 2002. Hepatology 2002; 36: S1-S2.
3. Gebo KA, Herlong HF, Torbenson MS, Jenckes MW, Chan-der G, Ghanem KG, El-Kamary SS, et al. Role of liver biopsy in management of chronic hepatitis C: a systematic re-view. Hepatology 2002; 36: S161-S172.
4. Saadeh S, Cammell G, Carey WD, Younossi Z, Barnes D, Easley K. The role of liver biopsy in chronic hepatitis C.
Hepatology 2001; 33: 196-200.
5. Castera L, Foucher J, Bertet J,Couzigou P, de Ledinghen V. FibroScan and FibroTest to assess liver fibrosis in HCV with normal aminotransferases. Hepatology 2006; 43: 373-4; author reply 5-6.
6. Soloway RD, Baggenstoss AH, Schoenfield LJ, Summerskill WH. Observer error and sampling variability tested in eva-luation of hepatitis and cirrhosis by liver biopsy. The Ame-rican Journal of Digestive Diseases 1971; 16: 1082-6. 7. Anastasiou J, Alisa A, Virtue S, Portmann B, Murray-Lyon I,
Williams R. Noninvasive markers of fibrosis and inflamma-tion in clinical practice: prospective comparison with li-ver biopsy. Eur J Gastroenterol Hepatol 2010; 22: 474-80. 8. Attallah AM, Mosa TE, Omran MM, Abo-Zeid MM, El-Dosoky I, Shaker YM. Immunodetection of collagen types I, II, III, and IV for differentiation of liver fibrosis stages in pa-tients with chronic HCV. J Immunoassay Immunochem
2007; 28: 155-68.
9. Angulo P, Hui JM, Marchesini G, Bugianesi E, George J, Farrell GC, Enders F. The NAFLD fibrosis score: a noninvasive system that identifies liver fibrosis in patients with NAFLD. Hepatology 2007; 45: 846-54.
10. Oudry J, Bastard C, Miette V, Willinger R, Sandrin L. Co-polymer-in-oil phantom materials for elastography. Ultra-sound In Medicine & Biology 2009; 35: 1185-97.
11. Foucher J, Chanteloup E, Vergniol J, Castéra L, Le Bail B, Adhoute X, Bertet J, et al. Diagnosis of cirrhosis by tran-sient elastography (FibroScan): a prospective study. Gut
2006; 5: 403-8.
12. Foucher J, Castera L, Bernard PH, Adhoute X, Laharie D, Bertet J, Couzigou P, et al. Prevalence and factors asso-ciated with failure of liver stiffness measurement using Fi-broScan in a prospective study of 2114 examinations. Eur J Gastroenterol Hepatol 2006; 18: 411-2.
13. Nightingale K. Acoustic Radiation Force Impulse (ARFI) Imaging : a Review. Curr Med Imaging Rev 2011; 7: 328-9. 14. Sarvazan AP, Rudenko OV, Swanson SD, Fowlkes JB,
Eme-lianov SY. Shear wave elasticity imaging : a new ultrasonic tchnology of medical diagnositcs. Ultrasound Med Biol
1998; 24: 1419-35.
15. Friedrich-Rust M, Nierhoff J, Lupsor M, Sporea I, Fierbin-teanu-Braticevici C, Strobel D, Takahashi H, et al. Perfor-mance of Acoustic Radiation Force Impulse imaging for the staging of liver fibrosis: a pooled meta-analysis. J Viral He-pat 2012; 19: e212-e219.
16. Kircheis G, Sagir A, Vogt C, Vom Dahl S, Kubitz R, Häussinger D. Evaluation of acoustic radiation force impulse imaging for determination of liver stiffness using transient elastography as a reference. World J Gastroenterol 2012; 18: 1077-84. 17. Friedrich-Rust M, Wunder K, Kriener S, Sotoudeh F,
Richter S, Bojunga J, Herrmann E. Liver fibrosis in viral hepatitis: noninvasive assessment with acoustic radiation force impulse imaging versus transient elastography.
18. Nightingale K, Stutz D, Bentley R, Trahey G. Acoustic ra-diation force impulse imaging: ex vivo and in vivo demons-tration of transient shear wave propagation. Presented at: Proceedings of the 2002 IEEE International Symposium on Biomedical Imaging Macro to Nano. Washington, DC, USA 2002; 556-9.
19. Nightingale KR, Palmeri ML. Acoustic Radiation Force Im-pulse (ARFI) Imaging: Fundamental Concepts and Image Formation In: Fatim M, Al-Jumaily A (eds.). Biomedical Applications of Vibration and Acoustics in Imaging and Chracterizations. New York: NY ASME Diginal Library; 2008.
20. Nightingale K, Soo MS, Nightingale R, Trahey G. Acoustic radiation force impulse imaging: in vivo demonstration of clinical feasibility. Ultrasound Med Biol 2002; 28: 227-35. 21. Melodelima D, Bamber JC, Duck FA, Shipley JA. Transient
elastography using impulsive ultrasound radiation force: a preliminary comparison with surface palpation elastogra-phy. Ultrasound Med Biol 2007; 33: 959-69.
22. D’Onofrio M, Gallotti A, Mucelli RP. Tissue quantification with acoustic radiation force impulse imaging: Measure-ment repeatability and normal values in the healthy liver.
AJR Am J Roentgenol 2010; 195: 132-6.
23. Batts KP, Ludwig J. Chronic hepatitis. An update on termi-nology and reporting. Am J Surg Pathol 1995; 19: 1409-17. 24. Roulot D, Czernichow S, Le Clesiau H, Costes JL, Vergnaud AC, Beaugrand M. Liver stiffness values in apparently healthy subjects: influence of gender and metabolic syn-drome. J Hepatol 2008; 48: 606-13.
25. Friedrich-Rust M, Romen D, Vermehren J, Kriener S, Sadet D, Herrmann E, Zeuzem S, et al. Acoustic radiation force impulse-imaging and transient elastography for non-invasive assessment of liver fibrosis and steatosis in NAFLD. Eur J Radiol 2012; 81: e325-e331.
26. Friedrich-Rust M, Romenski O, Meyer G, Dauth N, Holzer K, Grünwald F, Kriener S, et al. Acoustic Radiation Force Impulse-Imaging for the evaluation of the thyroid gland: a limited patient feasibility study. Ultrasonics 2012; 52: 69-74.
27. D’Anastasi M, Schneevoigt BS, Trottmann M, Crispin A, Stief C, Reiser MF, Clevert DA. Acoustic radiation force impulse imaging of the testes: a preliminary experience.
Clin Hemorheol Microcirc 2011; 49: 105-14.
28. Stock KF, Klein BS, Cong MT, Regenbogen C, Kemmner S, Büttner M, Wagenpfeil S, et al. ARFI-based tissue elastici-ty quantification and kidney graft dysfunction: first clini-cal experiences. Clin Hemorheol Microcirc 2011; 49: 527-35.
29. Bota S, Sporea I, Sirli R, Popescu A, Danila M, Sendroiu M. Factors that influence the correlation of acoustic radia-tion force impulse (ARFI), elastography with liver fibrosis.
Medical Ultrasonography 2011; 13: 135-40.
30. Lupsor M, Badea R, Stefanescu H, Sparchez Z, Branda H, Serban A, Maniu A. Performance of a new elastographic method (ARFI technology) compared to unidimensional transient elastography in the noninvasive assessment of chronic hepatitis C. Preliminary results. J Gastrointestin Liver Dis 2009; 18: 303-10.
31. Sporea I, Sirli R, Bota S, Fierbinteanu-Braticevici C, Petrisor A, Badea R, Lupsor M, et al. Is ARFI elastography reliable for predicting fibrosis severity in chronic HCV he-patitis? World J Radiol 2011; 3: 188-93.
32. Haque M, Robinson C, Owen D, Yoshida EM, Harris A. Com-parison of acoustic radiation force impulse imaging (ARFI) to liver biopsy histologic scores in the evaluation of chro-nic liver disease: A pilot study. Annals of Hepatology
2010; 9: 289-93.
33. Poynard T, Lenaour G, Vaillant JC, Capron F, Munteanu M, Eyraud D, Ngo Y. Liver biopsy analysis has a low le-vel of performance for diagnosis of intermediate sta-ges of fibrosis. Clin Gastroenterol Hepatol 2012; 657-63, e7.
34. Colombo S, Buonocore M, Del Poggio A, Jamoletti C, Elia S, Mattiello M, Zabbialini D, et al. Head-to-head comparison of transient elastography (TE), real-time tissue elastogra-phy (RTE), and acoustic radiation force impulse (ARFI) ima-ging in the diagnosis of liver fibrosis. J Gastroenterol
2012; 47: 461-9.