https://doi.org/10.5194/bg-14-4795-2017 © Author(s) 2017. This work is distributed under the Creative Commons Attribution 3.0 License.
Vertical segregation among pathways mediating nitrogen loss
(N
2
and N
2
O production) across the oxygen gradient
in a coastal upwelling ecosystem
Alexander Galán1,2,a, Bo Thamdrup3, Gonzalo S. Saldías4,5, and Laura Farías6,7,8
1CREA – Centro Regional de Estudios Ambientales, Universidad Católica de la Santísima Concepción, Av. Colón 2766, Talcahuano 4270789, Chile
2Facultad de Ecología y Recursos Naturales, Departamento de Ecología y Biodiversidad, Universidad Andrés Bello, Autopista Concepción-Talcahuano 7100, Chile
3Department of Biology and Nordic Center for Earth Evolution (NordCEE), University of Southern Denmark, Odense M, Denmark
4College of Earth, Ocean, and Atmospheric Sciences, Oregon State University, Corvallis, USA 5Centro FONDAP de Investigación en Dinámica de Ecosistemas Marinos de Altas Latitudes (IDEAL), Universidad Austral de Chile, Valdivia, Chile
6Departamento de Oceanografía, Universidad de Concepción, Concepción, Chile
7Laboratorio de Procesos Oceanográficos y Clima (PROFC), Universidad de Concepción, Concepción, Chile 8Centro de Ciencia del Clima y la Resiliencia (CR2), Santiago, Chile
aformerly at: Departamento de Oceanografía, Universidad de Concepción, Concepción, Chile
Correspondence to:Laura Farías ([email protected])
Received: 13 December 2016 – Discussion started: 7 March 2017
Revised: 30 August 2017 – Accepted: 7 September 2017 – Published: 26 October 2017
Abstract. The upwelling system off central Chile (36.5◦S)
is seasonally subjected to oxygen (O2)-deficient waters, with a strong vertical gradient in O2 (from oxic to anoxic con-ditions) that spans a few metres (30–50 m interval) over the shelf. This condition inhibits and/or stimulates processes involved in nitrogen (N) removal (e.g. anammox, denitri-fication, and nitrification). During austral spring (Septem-ber 2013) and summer (January 2014), the main pathways involved in N loss and its speciation, in the form of N2and/or N2O, were studied using15N-tracer incubations, inhibitor as-says, and the natural abundance of nitrate isotopes along with hydrographic information. Incubations were developed us-ing water retrieved from the oxycline (25 m depth) and bot-tom waters (85 m depth) over the continental shelf off Con-cepción, Chile. Results of15N-labelled incubations revealed higher N removal activity during the austral summer, with denitrification as the dominant N2-producing pathway, which occurred together with anammox at all times. Interestingly, in both spring and summer maximum potential N removal rates were observed in the oxycline, where a greater
are responsible for substantial accumulation of N2O, which are frequently observed as hotspots in the oxycline and bot-tom waters. Considering the extreme variation in oxygen ob-served in several coastal upwelling systems, these findings could help to understand the ecological and biogeochemi-cal implications due to global warming where intensification and/or expansion of the oceanic OMZs is projected.
1 Introduction
It is widely accepted that fixed nitrogen (N) availability influ-ences marine primary productivity (Falkowski et al., 1998). Therefore, fixed-N loss from the ocean has an important in-fluence on ecosystem functioning and global biogeochemical cycles. A significant fraction of the global fixed-N removal (30–50 %) occurs in oxygen minimum zones (OMZs), where dissolved oxygen (DO) levels as low as 2–4 µmol L−1 or lower activate nitrate-based anaerobic metabolisms (Devol, 1978; Dalsgaard et al., 2014). Fixed-N removal occurs pre-dominantly in the form of N2, generated by canonical den-itrification and anammox processes (Gruber and Sarmiento, 1997; Codispoti et al., 2001; Devol, 2003). The steep oxy-gen (O2)gradients observed at the OMZ’s boundaries further trigger a substantial production and accumulation of nitrous oxide – N2O (Naqvi et al., 2010; Dalsgaard et al., 2012), which may eventually be emitted to the atmosphere, thus contributing to the overall N loss. OMZs are notable features of eastern boundary ecosystems (i.e. South and North Pacific, South Atlantic) and the Arabian Sea, where seasonal or per-manent wind-driven upwelling sustains remarkably high lev-els of biological production, and subsequently a high respi-ration rate from subsurface organic matter (Helly and Levin, 2004).
The eastern South Pacific (ESP) is influenced by the shallow poleward Peru–Chile undercurrent (e.g. Blanco et al., 2001), which transports nutrient-rich, high-saline, and O2-depleted Equatorial Subsurface Waters – ESSWs (Strub et al., 1998). During austral spring–summer (September– April), a marked upwelling-favourable period driven by per-sistent southwesterly winds, ESSWs arrive at the coastal area off central Chile, impinging on one of the widest continen-tal shelves in Chile (Sobarzo and Djurfeldt, 2004; Sobarzo et al., 2007). Throughout the upwelling season high primary production rates (Daneri et al., 2000) occur along with a large downward flux of organic matter, leading to an in-crease in respiration rates at depth (Montero et al., 2007). These conditions, coupled with the presence of already O2 -deficient waters, and greater availability of electron donors and acceptors (as a result of the advection of inorganic sub-strates, local organic matter respiration, and autotrophic re-dox reactions), create steep gradients for O2and other chem-icals, with the establishment of hypoxic–anoxic conditions at middle–bottom depths. This leads to an active removal of
fixed N and greenhouse gas production (Farías et al., 2009; Galán et al., 2014). Likewise, the dense upwelled waters cause increased stratification in the water column, deceler-ating the downward flux of organic particles formed at the surface (Charpentier et al., 2007), facilitating their accumu-lation, and thus creating anoxic microbial hotspots within the oxycline that favour the N-based anaerobic microbial metabolisms (Klawonn et al., 2015; Stief et al., 2016).
from NH2OH and NO (Stieglmeier et al., 2014; Kozlowski et al., 2016).
Although the atmospheric N2O concentration is increas-ing by∼0.25 % annually (IPCC, 2014), estimates of the ma-rine contribution to N2O budget are highly uncertain. This is mainly due to the lack of coastal upwelling areas included in the global estimates of oceanic N2O emissions, although the contribution from these regions is potentially significant (Bange et al., 1996; Nevison et al., 2004). While several decades of research have focused on measuring (or estimat-ing) the products of N loss (as N2 and N2O), few studies have tracked the sources to determine the dominant process or to establish whether loss products are formed as the re-sult of coupling among multiple N-cycling pathways. De-spite both denitrification and anammox being considered as major loss terms for available N (as either N2and/or N2O), canonical nitrification or nitrifier denitrification may also contribute to removal in systems with high O2 variability. Thus, when low O2concentrations prevail, it is possible that multiple microbial N-loss processes operate simultaneously. However, the relative contribution of each metabolic path-way, and direct and indirect processes involved in N loss, remains unsolved. This study investigates variations in the N-based metabolisms of the microbial community, coupled with N loss, in the seasonally stratified and O2-limited wa-ters of the coastal upwelling system off central Chile, dur-ing the sprdur-ing transition and summer, across a gradient from oxic to anoxic conditions. We used a combination of15N la-belled activity measurements, inhibitory assays, and analysis of natural nitrate isotope abundances. The results obtained from this coastal ecosystem, where extreme O2variability is seasonally observed, could help to understand the ecological and biogeochemical implications of global warming, which is expected to cause intensification and expansion of oceanic OMZs (Keeling et al., 2010; Deutsch et al., 2011; Helm et al., 2011).
2 Methods
2.1 Study area and sampling strategy
The study was carried out at the COPAS time series sta-tion 18 (TS Sta. 18–36◦300S; 73◦080W, http://www.copas.cl, see Escribano and Schneider, 2007) located ∼33 km from the coast over the middle continental shelf (∼92 m isobath) off central Chile (Fig. 1a). Sampling was conducted during austral spring transition (12 September 2013) and summer (28 January 2014) on board the RV Kay Kay II. Continu-ous hydrographic profiles (temperature, salinity, O2) were obtained using a conductivity–temperature–depth (CTD) de-vice outfitted with an O2 sensor (Seabird 23B; accuracy at 2 % of saturation: ∼2 µmol O2L−1). Discrete seawater samples (5–10, 25, 40–60, and 80–85 m depths) were col-lected with 10 L Niskin bottles attached to a rosette sampler
for hydrographic measurements (dissolved oxygen, DO; N species – NH+4, NO−3, NO2−, N2O; and PO34−). A laser sensor (LISST-25X; http://www.sequoiasci.com/product/lisst-25x/) device was used to measure the abundance, size (mean diam-eter), and continuous vertical distribution of suspended par-ticles.
2.2 Hydrographic analyses
Seawater samples for discrete hydrographic measurements were taken in triplicate. Filtered (0.7 µm, GF/F glass fibre filter) water was analysed for NO−3, NO−2 and PO34− using standard colorimetric methods (Grasshoff et al., 1983) in an automatic analyser (Seal Analytical). NH+4 was measured fluorometrically from fresh samples (40 mL), using the or-thopthaldialdehyde method (Holmes et al., 1999) on a Turner Designs Trilogy Laboratory Fluorometer (Turner Designs). The relative standard error for NO−3, NO−2, PO34−and NH+4 was lower than±10,±3,±3, and±5 %, respectively. N2O was analysed from the equilibrated headspace (5 mL of pure He) in 20 mL crimp-cap bottles by gas chromatography (Var-ian 3380) using an electron capture detector maintained at 350◦C. The coefficient of variation of the dissolved N2O measurements was<3 % (for more details, see Cornejo and Farías, 2012).
2.3 Satellite-derived chlorophyll-a
High-resolution (1 km) MODIS (Moderate Resolution Imag-ing Spectroradiometer) imagery of Chlorophyll-a (Chl-a) were processed, based on the default Chl-a algorithm for MODIS (OC3), using NASA’s SeaDAS (SeaWIFS Data Analysis System) software for the coastal region off Concep-ción. MODIS level 1 files were obtained from NASA (https: //oceancolor.gsfc.nasa.gov/data/) and processed using an im-proved atmospheric correction method for coastal turbid wa-ters (Wang and Shi, 2007). Further details regarding process-ing options and flags are found in Saldías et al. (2012). Com-posites of 3 days were generated to reduce the cloud cover and increase the number of pixels available during the sam-pling dates.
2.4 Satellite-derived wind stress and in situ data
Satellite-derived, level 2 coastal ocean surface wind vec-tors were retrieved from the Advanced Scatterometer (AS-CAT) on MetOp-A, at 12.5 km sampling resolution. Data files are obtained from the Royal Netherlands Meteorolog-ical Institute (http://projects.knmi.nl/scatterometer/). For the study area, particular swaths presented wind measurement data from∼20–25 km from the coast, with improved wind vectors over the continental shelf around station 18. In situ wind data were obtained from the Carriel Sur Airport mete-orological station.
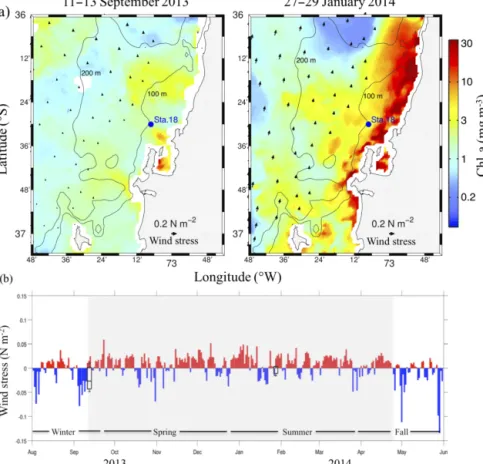
Figure 1. (a)Satellite-derived chlorophyll-aand wind stress during the period around the sampling days (left panel spring transition and right panel summer), for the study area and location of time series station 18 (Sta. 18; blue dot; 36◦300S; 73◦080W) off central Chile, Concepción Bay.(b)Upwelling- (red bars) and downwelling-favourable (blue bars) alongshore wind stress related to the study period (August 2013– May 2014). Box plots represent the statistical values boundaries of wind stress data for the previous week (5 days) to each sampling time. Part of the box closest and farthest to zero are the 25th and 75th percentile, respectively; horizontal lines within the box are the mean; and whiskers (error bars) are the minimum and maximum values. Shaded area represents the upwelling season.
upwelling events, and to obtain the water mass residence time at the sampling station, box plots representing the bound-aries of statistical values, and the error of in situ wind stress were calculated for the 5 days previous to sampling. To cal-culate the onset (i.e. spring transition) and extension of the upwelling season, cumulative alongshore (south–north) wind stress was estimated as described by Barth et al. (2007).
2.5 15N tracer and inhibitor experiments
Experimental assays with15N-labelled tracers and specific-pathway inhibitors were carried out with water from the oxy-cline and the bottom layer (25 and 85 m depth, respectively) in order to evaluate the contribution and coupling of the dif-ferent processes involved in N loss through the water column. The15N-tracer incubations followed the basic procedures as previously described by Thamdrup et al. (2006), with some modifications. Basically, 250 mL glass bottles were filled im-mediately following water sampling with the Niskin bottles, to avoid oxygenation, allowing overflow until the volume
Exe-tainers were incubated at in situ temperatures (10–11◦C) for up to 48 h. Subsamples were sacrificed in triplicate at four instances during the incubation (0, 15, 24, 48 h), and bio-logical activity was halted by injection of 50 µL of a 50 % (w/v) zinc chloride (ZnCl2) solution into each Exetainer. The N-isotopic composition of15N2produced by anammox and/or denitrification was measured by gas chromatography continuous-flow isotope ratio mass spectrometry (GC-CF-IRMS; Finnigan Delta Plus) using N2as standard (Dalsgaard et al., 2012). Subsequently,15N in N2O were analysed from the same samples following the chromatographic separation of N2O on a GC column.
Specific inhibitors were used to block the activity of tar-get pathways/microorganisms and discriminate the contribu-tion of the different processes to N cycling and N2and N2O production. Allylthiourea – ATU (at a final concentration of 86 µmol L−1), a specific bacterial inhibitor of the ammonium monooxygenase (AMO) enzyme (Ginestet et al., 1998), and N1-Guanyl-1, 7 Diaminoheptane – GC7 (at a final concen-tration of 100 µmol L−1), a phylogenetic inhibitor of the ar-chaeal growth (Jansson et al., 2000), were used in 15NH+4 incubations to separate the bacterial and archaeal contribu-tion to ammonium oxidacontribu-tion (AO), and to indicate any pos-sible competition for15NH+4 between ammonium oxidizers and anammox during both sampling periods. Acetylene (final concentration of 10 %v/v), which inhibits the AO and the fi-nal step of denitrification (i.e. N2O to N2; Balderston et al., 1976), was added to the 15NO−2 treatments during January to quantify the gross N2O production from nitrite reduction (NiR). This experimental design is detailed in Table 1.
2.6 15N-labelled dissolved inorganic N species
Pathways indirectly coupled to N-loss processes were mea-sured in the same incubations from dissolved inorganic N compounds formed by redox reactions (i.e. 15NH+4 from 15NO−
3). After analysing 15N
2and15N2O in the headspace of the Exetainers, the dis-solved15N-labelled species (15NH+4 and15NO−2)remaining in the liquid phase from the different treatments were trans-formed into 15N2 and analysed by GC-CF-IRMS as previ-ously described. To determine DNiRA rates,15NH+4 that ac-cumulated in15NO−2 treatments was converted to15N-N2 us-ing an alkaline hypobromite solution (Warembourg, 1993). Furthermore, rates of AO and nitrate reduction (NaR) were calculated as the mole fraction of15NO−2 produced in15NH+4 and15NO−3 treatments, respectively, after conversion of the 15NO−
2 produced by these pathways to 15N-N
2with sulfamic acid (McIlvin and Altabet, 2005).
2.7 Natural abundance of nitrate isotopes
The natural abundance isotopic composition of N in NO−3 was analysed by the denitrifier method (Casciotti et al., 2002; Sigman et al., 2001) after removal of NO−2 present
in the samples by treatment with sulfamic acid (McIlvin and Altabet, 2005). Theδ15N values were measured in the N2O quantitatively produced after nitrate reduction by den-itrifying bacteria that lack N2O-reductase activity. The iso-topic composition was analysed in a GC-CF-IRMS (Finni-gan Delta Plus). Data are reported in delta notation as
δ15N=(R(sample)/R(reference)−1)×1000),R=15N/14N. The standard deviation for nitrate isotope analysis ranged be-tween 0.01 and 0.4 ‰ (Casciotti et al., 2002).
2.8 Calculations
N2produced by anammox and denitrification, and from the chemical conversion of NO−2 and NH+4 to N2, was deter-mined from the excess of15N-labelled N2over the15N mole fraction in the source compounds according to Thamdrup et al. (2006), taking into account the random and hybrid isotope pairing patterns associated with denitrification and anammox, respectively. Rates were derived from the slope of the linear regression of15N-N2 production (14N15N and 15N15N) as a function of incubation time. Only significant (p≤0.05) and linearly developing rates without lag phase were considered. Rates of both NO−2 and NH+4 production were calculated from linear regression of the concentration of the15N-labelled product over time. Rates of N2O produc-tion are reported as separate rates of45N2O (14N15NO) and 46N
2O (15N15NO) accumulation, also from linear regression, as different pathways with different patterns of isotope pair-ing may contribute to N2O formation.
N deficits (N∗) were calculated as stoichiometric anoma-lies from the Redfield ratio using the relation between fixed inorganic N and phosphate concentrations (Gruber and Sarmiento, 1997).
3 Results
3.1 Oceanographic setting
Table 1.Experimental design. Tracked N-loss process and coupled pathways by the use of15N substrate, with detailed of the inhibitors added. Measured15N products and phase are described.
Tracer
4 (5 µM) Anammox and
denitri-fication – gas
CONTROL 15N2 and
15N 2O
Nitrification – liquid∗ 15NO−2 Nitrification – liquid∗ ATU (90 µM) Bacteria –
ammo-nium oxidation
Ammonia monooxygenase
15NO−
2
Nitrification – liquid∗ GC7 (100 µM) Archaea – ammo-nium oxidation
15NO−
2
15NO−
2 (5 µM) Anammox and
denitri-fication – gas
CONTROL 15N2 and
15N 2O
DNiRA – liquid∗ 15NH+4
Denitrification – gas Acetylene (10 %v/v) Bacteria/nitrite reduction
3 (15 µM) Anammox and
denitri-fication – gas
∗Production of dissolved inorganic15N compounds in the liquid phase was measured after chemical conversion of each substrate to15N
2. For details see Sect. 2 Methods.
Chl-a in Fig. 1a). This situation is intensified during sum-mer, with stronger southerly wind pulses (Fig. 1a) and fur-ther shoaling of the ESSW to 20 m (Fig. 2e). During this period the exhaustion of O2 also intensified at the bottom (<5 µmol L−1). Thus, three layers are established in the wa-ter column as a consequence of the influx of ESSW (Farías et al., 2009): a well oxygenated mixed layer, the oxycline char-acterized by a marked reduction of the dissolved O2content over a compressed vertical scale, and the bottom layer, where the oxygen deficiencies led to potentially anoxic conditions (Murillo et al., 2014). Furthermore, an increased availability of NO−3 and NO−2 as electron acceptors, and of organic mat-ter, NO−2, NH+4, and H2S as donors, are also characterized by the intensification of upwelling through the two deeper layers (Galán et al., 2014).
During September, NO−3-rich waters (up to 30 µmol L−1) occupied most of the subsurface, from the bottom to the up-per boundary of the oxycline (up to 25 m depth; Fig. 2c). Nevertheless, although similar high NO−3 values remained in the oxycline during January (Fig. 2g), notable NO−3 deple-tion (values as low as 19.5 µmol L−1) was observed close to the bottom and associated with extreme O2 exhaustion (∼4 µmol O2L−1), with subsequent NH+4 and NO
−
2 accumu-lation (up to 1.3 and 1.6 µmol L−1, respectively). N deficien-cies (N∗) generally increased with depth (Fig. 2d and h), with the greatest depletion (−24 µmol L−1)observed in bottom waters during January, which seems to be associated with the
NO−3 consumption, while similar N∗ values were observed
in the oxycline during both periods (∼ −10 µmol L−1). The vertical distribution of N2O was bimodal with similar peak values at the oxycline and in bottom waters, with concentra-tions slightly increasing from September to January (∼25 to 27 nmol L−1, respectively; Fig. 2d and h).
During September, the maximum concentration and mean particle diameter were observed in the surface layer (120 µL L−1and up to 77 µm, respectively), possibly due to the build up of phytoplanktonic biomass, with a secondary peak occurring close to the base of the oxycline (36 µL L−1 and 47 µm, respectively;∼25 m depth). During January, the particle concentration decreased relative to September, but showed a noteworthy increase in size (an entire order of magnitude greater). During this period, particles exhibited a broad distribution along the oxycline with a maximum size and concentration at the upper boundary (up to 650 µm and 20 µL L−1, respectively; ∼10 m depth), and a subsur-face secondary peak (∼500 µm and 11 µL L−1, respectively;
∼25 m depth) around the base of this layer (Fig. 2b and f).
3.2 Natural abundance of nitrate isotopes
Figure 2.Water column profiles of hydrographic parameters during sampling periods (a–d, 12 September 2013 ande–h, 28 January 2014) at station 18 over the continental shelf off central Chile.
column to a minimum at the bottom (11.2±0.2 ‰). In Jan-uary, theδ15N values increased from surface to depth, rang-ing from 9.5±0.3 to 14.5±0.1 ‰, respectively. The oxy-cline showed relatively similarδ15N values for both periods, being slightly higher during September (around 12 and 11 ‰, respectively).
3.3 15N experiments
The production of labelled N-gaseous species (measured as N2and N2O) revealed the coexistence of nitrification, anam-mox, and denitrification in both the oxycline and bottom layer during the study period (Table 2 and Figs. 3 and 4), with a remarkable increase in the N removal between spring and
summer. Interestingly, during both sampling times a higher activity in N loss was observed in the oxycline relative to the suboxic bottom waters, where activity was<40 % of the oxycline values.
3.3.1 15N2production
Figure 3.Anammox(a, c)and denitrification(b, d)activities ex-pressed as N2 production rates measured in the oxycline (25 m
depth) and bottom layer (85 m depth) at Sta. 18 over the continental shelf off central Chile during 12 September 2013(a, b)and 28 Jan-uary 2014 (c, d). Conventions show the amended tracer (15NH+4,
15NO−
2, and15NO
−
3), isotopic pairing in the gas produced, and
in-hibitor when used (ATU and GC7). Inset in(c)represents details of lower values at depth.
(4.5±0.9 nmol L−1d−1). During January (Fig. 3c, d), a similar vertical segregation in N2production processes was observed; however the magnitude of the rates changed. While at the oxycline, denitrification registered the highest N2 production rate during this study (50.3±10.3 nmol L−1d−1 – 73 % of total N2 production at this layer), anammox’ contribution to N2 production in the oxycline increased substantially (18.7±4.6 nmol L−1d−1 – 27 % of total N2 production at this layer) relative to that observed during September. At depth, N2 was only formed from anammox
but at a very low rate (0.4±0.02 nmol N2L−1d−1), which represents a substantial reduction of this process there in comparison to September.
During January, anammox activity increased follow-ing the addition of the AO inhibitor ATU (Fig. 3c). During this period, anammox rates from 15NH+4 treat-ments at the oxycline increased from 17.6±1.7 to 26.1±4.6 nmol L−1d−1, in incubations amended with ATU. Similar trends were observed at depth, but with a relatively lower increase (from 0.4±0.02 nmol L−1d−1 from15NH+4 to 0.5±0.04 nmol L−1d−1 from 15NH+4 +ATU). By con-trast, no significant increase was observed after addition of GC7. At depth, anammox activity was not detected after the addition of this archaeal inhibitor.
3.3.2 15N2O production
N2O production from 15N labelled substrates showed ver-tical and temporal changes with respect to substrate source (Table 2 and Fig. 4a, d). In both sampling periods in the oxy-cline, N2O was produced exclusively from AO, with slightly higher rates during September (3.8±0.7 nmol L−1d−1), relative to January (2.2±0.01 nmol L−1d−1). At depth, there was a change in the N2O source pathway over time; however it should be noted that during Septem-ber acetylene (C2H2) was not tested in the incubations. In September, N2O was only produced from ammonium (5.8±0.6 nmol L−1d−1), whereas production from ammo-nium was lower (0.02±0.002 nmol L−1d−1)relative to the N2O produced from nitrite (0.05±0.005 nmol L−1d−1) dur-ing January. Nevertheless, the addition of C2H2, which in-hibits N2O reduction to N2, resulted in a higher production of N2O (up to 22.6±3.5 nmol L−1d−1from15NO−2 +C2H2). This N2O accumulation was not observed in the oxycline during January, despite C2H2also being added to the NO−2 incubations.
3.3.3 Dissolved inorganic15N-compounds cycling
Table 2.Experimental dates, oxygen conditions during the incubations, tested depths, tracers and inhibitors amendments, measured N-gaseous specie (N2or N2O), summary of the Student’sttest used to evaluate the significance of the activity obtained, and anammox (Amx)
and denitrification (Dntf) rates.
Sampling O2 Depth Tracer Inhibitor Product F- p- Significance Degrees of Amx rate Dntf rate N2O
date conditions [m] measured statistic value freedom [nmol L−1d−1] [nmol L−1d−1] production [nmol L−1d−1]
12 September Anoxic 25 15NH+
4 WI N2 64.71 0.00400 * 4 2.214±0.302
2013 N2O 29.24 0.00567 ** 5 3.800±0.700a
15NO−
2 WI N2 94.48 0.00063 *** 5 2.801±0.300
N2 52.41 0.00544 ** 4 1.311±0.201
15NO−
3 WI N2 21.37 0.00986 ** 5 1.523±0.326
N2 18.46 0.01268 * 5 18.891±4.339
85 15NH+
4 WI N2 42.89 0.00281 ** 5 2.603±0.400
N2O 108.83 0.00005 *** 7 5.800±0.600a
15NO−
2 WI N2 23.97 0.00272 ** 7 4.524±0.905
28 January in situ 25 15NH+4 WI N2 100.09 0.00006 *** 7 17.622±1.722
2014 (91 µM) ATU N2 32.19 0.01084 * 4 26.129±4.557
GC7 N2 56.46 0.00029 *** 7 19.952±2.633
WI N2O 6.8×1031 1.4×10⁻³² *** 3 2.200±0.000a 15NO−
2 WI N2 36.83 0.00175 ** 6 16.748±2.774
N2 11.54 0.02736 * 5 5.547±1.618
15NO−
3 WI N2 16.76 0.01492 * 5 18.726±4.575
N2 24.31 0.00787 ** 5 50.370±10.269
Anoxic 85 15NH+
4 WI N2 172.25 0.00576 ** 3 0.369±0.025
ATU N2 12.31 0.02470 * 5 0.523±0.036
WI N2O 40.33 0.00315 ** 5 0.020±0.002a
15NO−
2 WI N2O 20.67 0.00613 ** 6 0.054±0.005
N2O 86.36 0.00024 *** 6 0.007±0.000
C2H2 N2O 40.43 0.00314 ** 5 22.630±3.502
N2O 12.92 0.01144 * 7 3.872±1.055
15NO−
3 WI N2O 56.25 0.00029 *** 7 0.023±0.004
N2O 56.25 0.00029 *** 7 0.009±0.001
Significance codes: 0.001 –∗∗∗, 0.01 –∗∗, 0.05 –∗, not significant – ns. Without inhibitor – WI. Degrees of freedom – DF.a– Number represent “partial rates” because it is not clear which pathway forms the N 2O from AO.
16±4 nmol NO−2 L−1d−1from AO and NaR – 70 and 30 %, respectively). It is important to remark that the assays de-veloped during January with water from the oxycline were incubated at the in situ oxygen level.
During January, the addition of ATU into the in-cubations resulted in a significant reduction (>70 %) in nitrite production from AO, both in the oxy-cline (14.4±4.9 nmol NO−2 L−1d−1) and at depth (9.6±0.7 nmol NO−2 L−1d−1), while GC7 caused only a slight but non-significant reduction in nitrite production rates from AO at both depths. By contrast, during September, no nitrite production activity was observed from AO for treatments with either ATU or GC7 addition, indicating that AO could be completely inhibited by these compounds (data not included in Table 3).
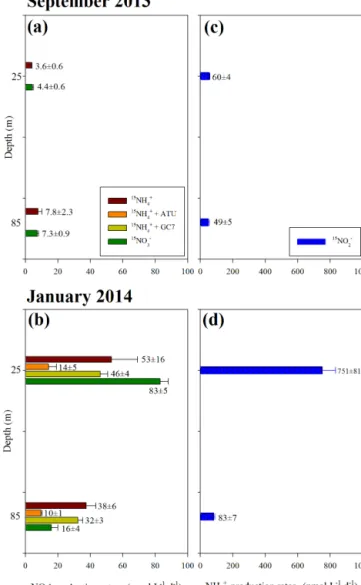
Similarly to the nitrite production scenario, over both depths the labelled NH+4 formed by dissimilative reduc-tion of NO−2 (i.e. DNiRA) was higher during January (Fig. 5d) relative to September (Fig. 5c), with marked vari-ations in the yield of this reaction between depths
through-out the upwelling season. In September, DNiRA was simi-larly active in the oxycline (59.9±3.9 nmol NH+4 L−1d−1)
and in the bottom layer (49.3±5.3 nmol NH+4 L−1d−1). On the contrary, during January a notable produc-tion of NH+4 was observed in the oxycline (up to 751±81 nmol NH+4 L−1d−1)in comparison to the produc-tion at depth (82.8±7.3 nmol NH+4 L−1d−1).
4 Discussion
4.1 Environmental variability
Table 3.Experimental dates, oxygen conditions during the incubations, tested depths, tracers and inhibitors amendments, summary of the Student’s t test used to evaluate the significance of the activity obtained, and nitrite production rates measured as29N2 after chemical
conversion.
Sampling O2 Depth Tracer Inhibitor F- p- Significance Degrees of NO−2 Production rate±SE date conditions [m] statistic value freedom [nmol L−1d−1]
12 September Anoxic 25 15NH+4 WI 42.51 0.00062 *** 7 3.649±0.560
2013 15NO−3 WI 46.07 0.00106 ** 6 4.433±0.653
85 15NH+4 WI 11.34 0.02809 * 5 7.830±2.325 15NO−
3 WI 54.22 0.00181 ** 5 7.300±0.991
28 January in situ 25 15NH+4 WI 10.81 0.03025 * 5 53.036±16.127
2014 (91 µM) ATU 8.50 0.03314 * 6 14.360±4.927
GC7 9,50 0.03516 * 6 46.141±4.537
15NO−
3 WI 293,74 7×10
−5 *** 5 82.918±4.838
Anoxic 85 15NH+4 WI 40.19 0.00072 *** 7 37.537±5.921
ATU 92.53 4×10⁻⁵ *** 7 9.621±0.749
GC7 112.52 4×10⁻⁵ *** 7 32.321±3.049 15NO−
3 WI 21.42 0.00982 ** 5 16.440±3.552
Significance codes: 0.001 –∗∗∗, 0.01 –∗∗, 0.05 –∗, not significant – ns. Without inhibitor – WI.
Table 4.Experimental dates, oxygen conditions during the incubations, tested depths, tracers amendments, pairing labelled N2product
measured, summary of the Student’sttest used to evaluate the significance of the activity obtained, and ammonium production rates (DNiRA) measured as29/30N2after chemical conversion.
Sampling O2 Depth Tracer Product F- p- Significance Degrees of NH+4 Production Rate±SE date conditions [m] measured statistic value freedom [nmol L−1d−1]
12 September Anoxic 25 15NO−2 29N2 154.26 0.00024 *** 5 55.979±3.998
2013 30N2 43.51 0.00120 ** 6
85 15NO−2 29N2 12.74 0.02337 * 5 49.261±5.278 30N
2 1095.96 0.00091 *** 3
28 January in situ 25 15NO−2 29N2 84.75 0.00077 *** 5 751.232±81.459
2014 (91 µM) 30N2 9.97 0.03423 * 5
Anoxic 85 15NO−2 29N2 120.56 0.00039 *** 5 82.848±7.310 30N
2 19.67 0.01137 * 5
Significance codes: 0.001 –∗∗∗, 0.01 –∗∗, 0.05 –∗, not significant – ns.
NO−3 (>25 µmol L−1)onto the shelf from the southernmost extension of the permanent ESP OMZ (Galán et al., 2014). As the upwelling season progresses, heterotrophic processes in subsurface waters are stimulated by the large amount of organic matter produced at the surface that settles on the sed-iments. The increase in respiration rates creates extreme O2 depletion at depth during the summer (∼4 µmol L−1; Fig. 2e) and occasionally anoxic conditions occur in the bottom wa-ters of this system (Murillo et al., 2014). The O2limitation switches on anaerobic microbial metabolisms, which initially use NO−3 as the terminal electron acceptor, generating other inorganic species of N (i.e. NH+4, NO−2, N2O; Fig. 2g, h),
Figure 4.N2O production rates through AO(a, c), and through NaR
and NiR(b, d)measured in the oxycline (25 m depth) and bottom layer (85 m depth) at Sta. 18 over the continental shelf off central Chile during 12 September 2013 (a, b)and 28 January 2014(c, d). Conventions show the amended tracer (15NH+4, 15NO−2, and
15NO−
3), isotopic pairing in the gas produced, and inhibitor when
used (acetylene – “C2H2”). Note that N2O produced in the incu-bations with C2H2represents gross production rates. Insets in(c)
and(d)represent details of lower values at depth.
the microbial community composition and the biomass ac-cumulation (Rutllant and Montecino, 2002; Wilkerson et al., 2006; Du and Peterson, 2009), and could even explain the hot N2O moments (short periods of disproportionately high rates) observed in this system (Farías et al., 2015). In this regard, clear variations in the alongshore wind stress (inten-sity and direction) were observed between sampling times, considering the 5 days preceding the sampling and the sam-pling day itself. Thus, the system was coming from a pulse
Figure 5. Nitrite (a, b) and ammonium (c, d) production rates measured as15N2after chemical conversion of the dissolved15
N-inorganic compound produced (formed by redox reactions) mea-sured in the oxycline (25 m depth) and bottom layer (85 m depth) at Sta. 18 over the continental shelf off central Chile during 12 September 2013(a, c)and 28 January 2014(b, d). Conventions denote amended tracer/source (15NH+4,15NO−3, and15NO−2)and inhibitor (ATU and GC7) that showed activities.
advec-tion of ESSW supported an increase in surface Chl-a, with a wider distribution of larger particles around both oxycline limits.
4.2 15N-loss activity
4.2.1 15N2production
An intense N cycling leading to N loss over the continental shelf off central Chile was demonstrated by the15N labelling results (Figs. 3, 4, and 5), with higher levels of activity ob-served not only as the upwelling season progressed but also in the oxycline (relative to the bottom waters) during both periods. This is the first time that anammox, denitrification, and nitrification – through N2O production – were found co-contributing to the removal of fixed N in this coastal system and at relatively high O2conditions as measured in the oxy-cline (∼95 µmol O2L−1). A plausible explanation for the observation of oxygen-sensitive processes (i.e. anammox and denitrification) operating under ambient oxic conditions is that the oxycline incubations for both sampling periods were carried out with water retrieved from the secondary peak of particles (∼25 m depth), which accumulate at this level due to high stratification (Fig. 2b, f), causing a deceleration in their downward flux. These organic particles may create anoxic microenvironments (Ploug et al., 1997) as well as generate chemical hotspots that provide substrates (organic and inorganic) to sustain the anaerobic metabolisms of the pelagic microbiota. The influence of anaerobic microniches on N2 production has been previously proposed in scenar-ios where strong covariation between anammox rates and the abundance of particle-associated anammox cells have been found in incubations with water from the Namibian con-tinental shelf, with in situ O2 levels reaching 25 µmol L−1 (Kuypers et al., 2005; Woebken et al., 2007). Recently, sev-eral anaerobic N processes (e.g. nitrate reduction, denitrifica-tion, anammox, dissimilatory nitrate reduction to ammonium – DNRA, and N2O production) have been detected in sus-pended cyanobacterial and diatom anoxic-aggregates (traced with O2 microsensors) incubated in oxic waters (Klawonn et al., 2015, and Stief et al., 2016, respectively), supporting the idea that particles are able to operate as anoxic N-removal hotspots. Particles in this study were smaller (≤0.6 mm) than the cyanobacterial/algal aggregates (diameters≥3 mm; Kla-wonn et al., 2015, and Stief et al., 2016, respectively), but the static incubation may have facilitated the development of anoxic niches in our incubations by allowing the parti-cles to settle. Activity of anoxic metabolism in these O2 -depleted microenvironments is related to the size of the par-ticles/aggregates and the ambient oxygen conditions due to the availability of substrate and the diffusion velocity, re-spectively. Larger particles in situations of low ambient O2 levels offer more organic substrates that favour internal O2 consumption through respiratory activity, facilitating the de-velopment of anoxia within the particles core (Ploug et al.,
1997, 2008; Klawonn et al., 2015). Thus, differences in par-ticle size could explain differences in the N-loss activity ob-served at the oxycline between sampling periods.
Phylogenetic analyses of functional genes indicate that this coastal system maintains a great diversity of pelagic N cycling microorganisms, with heterotrophic denitrifying bac-teria, aerobic ammonia oxidizers (either from bacteria and archaea domains), and anammox bacteria related to the Can-didatus Scalindua clade, present not only in the oxygen-depleted bottom waters but also around the oxycline (O. Ul-loa, unpublished data). Furthermore, previous evidence of the presence of anammox cells in the study area, identified by CARD-FISH, showed that this bacterial population could be distributed throughout the water column at similarly higher numbers, when the maximal development of upwelling is reached (Galán et al., 2012).
The presence of O2 (in situ) in particle-associated incu-bations from the oxycline during January favours coupling between aerobic mechanisms (e.g. AO and organic matter remineralization) with anaerobic N removal processes (i.e. anammox and denitrification), as illustrated by the high pro-duction rates of NO−2 and NH+4 (Fig. 5). Assuming that these aerobic processes also occur in association with the parti-cles, it is proposed that aerobic metabolisms occurring at the periphery of the oxygenated particle fuel the internal anaero-bic pathways by the diffusion of their products (e.g. nitrite produced by AO) to the respiration-mediated anoxic core, similarly to the scenarios described for various other micro-bial aggregates in wastewater treatment plants (Nielsen et al., 2005), man-made model systems (Stief et al., 2016) and nat-ural environments (Klawonn et al., 2015). On the other hand, the detection of nitrification during anoxic incubations has been attributed to the persistence of traces of O2in the sam-ples (e.g. Bristow et al., 2016; Ganesh et al., 2015), although those studies exhibited caution to O2contamination that was similar to this study (see Sect. 2.5 in Methods).
15NO−
2 and15NO
−
3 amended treatments (Fig. 3b, d). Sim-ilarly to denitrification, anammox rates in the oxycline also increased from September to January. This temporal variabil-ity in anammox activvariabil-ity could be related to the availabilvariabil-ity of NO−2 and NH+4, which is implied by the observation of a vast increase in the production of these substrates during January (Fig. 5b, d). The intense cycling of NO−2 and NH+4 via nitrifi-cation, anammox, and denitrifinitrifi-cation, among other processes (e.g. nitrite and ammonium assimilation; processes not de-termined in this study), should prevent a substantial in situ accumulation of these substrates (Fig. 2g).
At depth, N2production rates by anammox and denitrifi-cation were either reduced or non-existent in comparison to the rate of activity observed in the oxycline. Furthermore, rates were lower that those previously observed in the same area (Galán et al., 2014). This reduction in N2 production throughout the water column, and over time (intra- and inter-seasonally) is likely to be related to variations in the avail-ability of O2and substrates that fuel both processes (i.e. or-ganic matter, NO−2, and NH+4). A greater depletion of am-bient O2 could explain the major N removal activity that was previously observed in the area (Galán et al., 2014), a scenario that has been widely observed elsewhere (Jensen et al., 2008; Kalvelage et al., 2011; Dalsgaard et al., 2012). On the other hand, vertical variations in the quality of the or-ganic matter that sinks to the depths could affect microbial organoheterotrophic activity, including denitrification rates (Chang et al., 2014). In turn, this affects the delivery of remineralized compounds required for lithoautotrophic pro-cesses, such as anammox and nitrification, among others. Likewise, reduced anammox and organotrophic denitrifica-tion activity has been previously registered during the sum-mer period at depth and was related to the presence of re-duced sulfur compounds in the water column that inhibited the activity of the anammox cells (Jensen et al., 2009) and triggered a lithoautotrophic, H2S-based metabolism of the denitrifier community (Galán et al., 2014).
4.2.2 15N2O production
It can be concluded that in this coastal system during Jan-uary the main substrate source for N2O production changes along chemical gradients through the water column. Thus, N2O was produced from NH+4 within the oxycline, while at depth it was produced from NO−2. However, it must be considered that during September, C2H2, a N2O reduction inhibitor after NiR, was not added to the incubations. Con-versely, while the NiR pathway is associated with the pro-duction of N2O, based on the experimental design used here, it is not clear which pathway formed N2O coupled to the oxidation of NH+4. It is possible that N2O was produced by bacteria during the oxidation of NH+4 to NO−2 as a side prod-uct of the reaction (e.g. Goreau et al., 1980) or through the less understood nitrifier-denitrification reaction (e.g. Wrage et al., 2001). The latter pathway combines two labelled N
atoms from NO or NO−2 and should therefore produce mostly 46N
2O in our experiment if these substrates originate from AO, whereas45N2O dominated (Table 2 and Fig. 4). Am-monium oxidizing archaea may also participate in N2O pro-duction (Martens-Habbena et al., 2009; Santoro et al., 2010, 2011; Jung et al., 2014). In this sense, the large dominance of45N2O over46N2O observed could be explained by the re-cently described “hybrid” pathway (Kozlowski et al., 2016), in which labelled hydroxylamine (15NH2OH) produced from AO might be combined with NO reduced from the NO−2 present in the native pool of the incubations. The coupling between AO and NiR after the formation of NO−2 is less plau-sible, because any labelled NO−2 that is produced would be diluted by the existing pool of NO−2 in the environment. Fur-thermore, experiments carried out with15NO−2 in the oxy-cline during summer did not produce labelled N2O via NiR, despite the use of C2H2 as was observed at depth, reject-ing the idea that the couplreject-ing between AO and NiR is the pathway through which N2O is generated. Increases in N2O production within the oxycline have also previously been as-sociated with AO (Codispoti, 2010).
It appears more likely that differences in N2O produced in the oxycline between seasons are related to O2 concen-tration, rather than to NH+4 availability, as the production of this substrate was consistently at least 1 order of magni-tude higher than the ammonium-based N2O production rates (Fig. 4c, d). The O2-limited incubations carried out during September, relative to in situ O2conditions during the Jan-uary experiments, could, together with a greater availabil-ity of particles occurring at the sampling depth, generate an O2-depleted environment, in which the yield of N2O formed through nitrifier denitrification (Elkins et al., 1978; Goreau et al., 1980; Lipschultz et al., 1981; de Wilde and de Bie, 2000) or through the “hybrid” pathway (Kozlowski et al., 2016) will increase. There is ample evidence that N2O production via nitrification in aquatic systems is increased under condi-tions of reduced oxygen and abundant ammonium availabil-ity (Elkins et al., 1978; McElroy et al., 1978; de Wilde and de Bie, 2000; Löscher et al., 2012).
4.2.3 Cycling of dissolved inorganic15N compounds
does not correspond to recent molecular and biogeochem-ical observations from the study area, particularly during the upwelling season, when a high abundance of Thaumar-chaeota (previously Crenarchaeota; an archaeon that sus-tains itself chemolithoautotrophically through aerobic oxi-dization of NH+4) account for a significant fraction of the microbial assemblage, while ammonium-oxidizing bacteria are scarce or undetectable (Levipan et al., 2007; Quiñones et al., 2009; Bristow et al., 2016). Likewise, the relative contri-bution to ammonium oxidation, quantified by the ammonia monooxygenase subunit A gene (Molina et al., 2010), and dark carbon assimilation rates (Farías et al., 2009), showed that archaea had a greater potential activity relative to the ho-mologous bacteria in the system. Also, theThaumarchaeota
are mainly associated with the oxycline (Belmar et al., 2017), where N2O hotspots are frequently observed (Cornejo and Farías, 2012; Farías et al., 2015), further suggesting their possible participation in N2O production in this layer, par-ticularly as the isotopic signature suggests ammonium oxi-dation by archaea is a major precursor of N2O in the ocean (Santoro et al., 2011). To reconcile the inhibitor results with all other evidence, we speculate that GC7, as a growth in-hibitor of archaea, might not affect archaeal metabolism in short-term incubations, thus masking the relative importance of this domain for AO during this study.
During the sampling period, NH+4 was produced at a high rate by dissimilative nitrite reduction (i.e. DNiRA), a pro-cess measured for the first time in this system. Rates were especially high during January in the oxycline. It should be noted, however, that the hypobromite method used to analyse 15NH+
4 also oxidizes organic15N, which may have formed through assimilation of labelled NO−2. Nonetheless, it is re-markable that all the NH+4 required for the lithoautotrophic community, i.e. anammox and nitrification (measured here as AO), and even for previous rates of light assimilation measured at the same station (spring–summer season aver-age<100 and<50 nmol L−1d−1for 30 and 80 m, respec-tively; Fernández and Farías, 2012), could be supported by DNiRA at the two depths evaluated. Furthermore, the ex-pected ammonium production from organic matter reminer-alization by canonical denitrification and nitrate and nitrite reduction, at the rates measured here and assuming that these are heterotrophic processes, should be an important addi-tional source of this substrate. The DNRA process was sug-gested to be important in some previous surveys in the OMZ off Peru and in the Arabian Sea (Lam et al., 2009; Jensen et al., 2011; but see also Kalvelage et al., 2013) and was suggested to supply anammox with ammonium in previous OMZ studies in which heterotrophic denitrification was not detected (Thamdrup et al., 2006; Hamersley et al., 2007; Galán et al., 2009; Lam et al., 2009). Nevertheless, the NO−2 required just to support the DNiRA, disregarding the NO−2 demand from other processes (e.g. anammox and denitri-fiers, or for nitrite assimilation and nitrite oxidation – not evaluated in this investigation), was not fully supported by
the measured nitrite production through nitrate reduction and ammonium oxidation. This uncoupling between microbial sources and sinks for this substrate indicates that NO−2 should be a limiting factor and hence a pivotal compound in this system. Thus, allochthonous NO−2 is needed to cope with this imbalance. Considering this, upwelled NO−2 from the oceanic OMZ is the most probable source (e.g. Galán et al., 2009), with an extensive vertical distribution starting close to the upper OMZ boundary and reaching concentrations up to 10 µmol L−1. Alternatively, fluxes from sediments are a less probable source due to the increased consumption of nitrite in this environment (Devol, 2015).
4.3 Natural abundance of nitrate isotopes
The enrichedδ15N-NO−3 values observed (exceeding the av-erage in the deep Pacific of 5 ‰; Sigman et al., 2000) indicate that nitrate-based biological mechanisms are the main modu-lators of the isotopic N composition in the subsurface waters over the shelf off central Chile during September and Jan-uary. The general negative trend between NO−3 concentration andδ15N provides evidence that light isotopes are preferen-tially used by biologically mediated NO−3 consuming pro-cesses, leaving the residual NO−3 pool enriched. Likewise, concurrence between theδ15N values and the N deficit (ex-cept for the surface sample) confirms previous reports (Voss et al., 2001; Sigman et al., 2000). Theδ15N value (11.2 ‰) at depth during the spring transition is used as an estimate of the background source signal during the onset of the up-welling season. Thus, the progressiveδ15N enrichment ob-served throughout the oxycline to the surface may result from locally occurring NO−3 fractionation processes, includ-ing dissimilatory nitrate reduction processes and nitrate as-similation. During January, the association between the max-imumδ15N-NO−3 value (up to 14.5 ‰) at depth, the max-imum N deficit (Fig. 2h), and a pronounced O2 deficiency (<5 µmol L−1)is likely to be the result of diverse dissimila-tive nitrate consumption processes (i.e. nitrate reduction to nitrite, DNRA, and denitrification through N2O production). The isotope N ratio was reduced in the oxycline (11.7 ‰; Fig. 2f), possibly due to the addition of isotopically light NO−3 by the oxidation of recently fixed N, with an isotopic composition of∼ −2 to 0 ‰ (Liu et al., 1996). Nitrogen fixa-tion in this system occurs mainly during summer and autumn (Fernández et al., 2011), and the process may produce up to 20 % of the new N in surface waters associated with OMZs (Brandes et al., 1998). Based on the natural abundance of 15N-NO−
addi-tion of just 0.7 µmol L−1of fixed N. In general, our observa-tions are consistent with those reported previously for the Pe-ruvian OMZ (Ryabenko et al., 2012), where highδ15N-NO−3 values (>10 ‰) were associated with denitrification (and in this case together with nitrate reduction processes), occur-ring at lower O2 concentrations (<5 µmol L−1)and higher N deficits. Furthermore, this is consistent with fractionation during nitrate assimilation by phytoplankton in surface wa-ters (O2>200 µmol L−1).
5 Conclusions
Considering that N removal processes are initially fuelled by organic matter and the concomitant production of elec-tron donors (e.g. NH+4)and acceptors (e.g. NO−2)after its remineralization, the vertical and temporal differences in N-loss processes during this study and previous studies in the area (Galán et al., 2014) highlight the influence of the de-velopment of the upwelling season on the availability and vertical distribution of particulate organic matter. Further-more, the accumulation of sinking organic particles around the oxycline considerably increases the volume for remov-ing N processes in this coastal system. The great amount of regenerated ammonium produced after the oxidation of this organic load has a central role in regulating the generation of N2O at the oxycline. Nonetheless the main substrate that supports the N removal as either producing N2and N2O is the overabundance of preformed N, mostly in the form of ni-trate, which fertilizes the system through the upwelling sea-son. Thus, during this productive period, pulses of accumula-tion and consumpaccumula-tion of different N substrates modulated the structure and activity of the microbial N-based assemblage of this coastal upwelling system.
Data availability. Data from hydrographic profiles and from field experiments are available upon request by emailing Alexan-der Galán ([email protected]).
Competing interests. The authors declare that they have no conflict of interest.
Acknowledgements. This research was funded by Fondo Nacional de Desarrollo Científico y Tecnológico (FONDECYT) project 3130473 and by Center of Excellence FONDAP-CONYCIT No. 15110009. The crew of R/VKay Kay(II) and Dichato Marine Station of University of Concepción provided significant help during fieldwork. We acknowledge the invaluable collaboration of Laura Bristow and Karen Casciotti, who helped with the N labelling and natural abundance of nitrate isotopes analysis, respectively. Bo Thamdrup acknowledges funding from the Danish National Research Foundation, grant DNRF53. Gonzalo S. Saldías has been partially funded by a Fulbright Scholarship and Comisión Nacional
de Investigación Científica y Tecnológica (CONICYT – Becas Chile) during the early stages of this manuscript.
Edited by: Tina Treude
Reviewed by: two anonymous referees
References
Arp, D. J. and Stein, L. Y.: Metabolism of inorganic N compounds by ammonia-oxidizing bacteria, Crit. Rev. Biochem. Mol. Biol., 38, 471–495, https://doi.org/10.1080/10409230390267446, 2003.
Balderston, W. L., Sherr, B., and Payne, W. J.: Blockage by acety-lene of nitrous oxide reduction inPseudomonas perfectomarinus, Appl. Environ. Microb., 31, 504–508, 1976.
Bange, H. W., Rapsomanikis, S., and Andreae, M. O.: Nitrous oxide in coastal waters, Global Biogeochem. Cy., 10, 197–201, 1996. Barth, J. A., Menge, B. A., Lubchenco, J., Chan, F., Bane, J. M.,
Kir-incich, A. R., McManus, M. A., Nielsen, K. J., Pierce, S. D., and Washburn, L.: Delayed upwelling alters nearshore coastal ocean ecosystems in the northern California current, P. Natl. Acad. Sci. USA, 104, 3719–3724, 2007.
Belmar, L., Molina, V., Ramírez-Flandez, S., Galán, A., and Ulloa, O.: Contribution of Thaumarchaeota to the picoplankton commu-nity inhabiting a seasonal wind-driven coastal upwelling ecosys-tem, in preparation, 2017.
Blainey, P. C., Mosier, A. C., Potanina, A., Francis, C. A., and Quake, S. R.: Genome of a low-salinity ammonia-oxidizing archaeon determined by single-cell and metagenomic analysis, Plos One, 6, e16626, https://doi.org/10.1371/journal.pone.0016626, 2011.
Blanco, J. L., Thomas, A. C., Carr, M. E., and Strub, P. T.: Sea-sonal climatology of hydrographic conditions in the upwelling region off northern Chile, J. Geophys. Res., 106, 11451–11467, https://doi.org/10.1029/2000JC000540, 2001.
Bonin, P., Gilewicz, M., and Bertrand, J. C.: Effects of oxygen on each step of denitrification onPseudomona nautical, Can. J. Mi-crobiol., 35, 1061–1064, 1989.
Brandes, J. A., Devol, A. H., Yoshinari, T., Jayakumar, D. A., and Naqvi, S. W. A.: Isotopic composition of nitrate in the cen-tral Arabian Sea and eastern tropical North Pacific: A tracer for mixing and nitrogen cycles, Limnol. Oceanogr., 42, 1680–1689, 1998.
Bristow, L. A., Dalsgaard, T., Tiano, L., Mills, D. B., Bertagnolli, A. D., Wright, J. J., Hallam, S. J., Ulloa, O., Canfield, D. E., Revsbech, N. P., and Thamdrup, B.: Ammonium and nitrite ox-idation at nanomolar oxygen concentrations in oxygen mini-mum zone waters, P. Natl. Acad. Sci. USA, 113, 10601–10606, https://doi.org/10.1073/pnas.1600359113, 2016.
Casciotti, K. L., Sigman, D. M., Galanter Hastings, M., Böh-lke, J. K., and Hilkert, A.: Measurement of the oxygen iso-topic composition of nitrate in seawater and freshwater us-ing the denitrifier method, Anal. Chem., 74, 4905–4912, https://doi.org/10.1021/ac020113w, 2002.
and Arabian Sea oxygen deficient zones, Limnol. Ocenogr., 59, 1267–1274, https://doi.org/10.4319/lo.2014.59.4.1267, 2014. Charpentier, J., Farias, L., Yoshida, N., Boontanon, N., and
Raim-bault, P.: Nitrous oxide distribution and its origin in the central and eastern South Pacific Subtropical Gyre, Biogeosciences, 4, 729–741, https://doi.org/10.5194/bg-4-729-2007, 2007. Codispoti, L. A.: Interesting times for marine N2O, Science, 327,
1339–1340, https://doi.org/10.1126/science.1184945, 2010. Codispoti, L. A., Brandes, J. A., Christensen, J. P., Devol, A.
H., Naqvi, S. W. A., Paerl, H. W., and Yoshinari, T.: The oceanic fixed nitrogen and nitrous oxide budgets: Moving tar-gets as we enter the anthropocene?, Sci. Mar., 65, 85–105, https://doi.org/10.3989/scimar.2001.65s285, 2001.
Cornejo, M. and Farías, L.: Meridional variability of the vertical structure and air-sea fluxes of N2O off central Chile (30–40◦S),
Prog. Oceanogr., 92–95, 33–42, 2012.
Dalsgaard, T., Thamdrup, B., Farías, L., and Revsbech, N. P.: Anammox and denitrification in the oxygen minimum zone of the eastern South Pacific, Limnol. Oceanogr., 57, 1331–1346, https://doi.org/10.4319/lo.2012.57.5.1331, 2012.
Dalsgaard T., Stewart, F. J., Thamdrup, B., De Brabandere, L., Revsbech, N. P., Ulloa, O., Canfield, D. E., and DeLong, E. F.: Oxygen at nanomolar levels reversibly suppresses process rates and gene expression in anammox and denitrification in the oxygen minimum zone off Northern Chile, mBio 5, e01966-14, https://doi.org/10.1128/mBio.01966-14, 2014.
Daneri, G., Dellarossa, V., Quiñones, R., Jacob, B., Montero, P., and Ulloa, O.: Primary production and community respiration in the Humboldt Current System off Chile and associated oceanic areas, Mar. Ecol.-Prog. Ser., 197, 41–49, 2000.
Daneri, G., Lizárraga, L., Montero, P., González, H. E., and Tapia, F.: Wind forcing and short-term variability of phytoplankton and heterotrophic bacterioplankton in the coastal zone of the Concep-ción upwelling system (Central Chile), Prog. Oceanogr., 92–95, 92-96, https://doi.org/10.1016/j.pocean.2011.07.013, 2012. De Wilde, H. and De Bie, M. J. M.: Nitrous oxide in the Schelde
es-tuary: production by nitrification and emission to the atmosphere, Mar. Chem., 69, 203–216, https://doi.org/10.1016/S0304-4203(99)00106-1, 2000.
Deutsch, C., Brix, H., Ito, T., Frenzel, H., and Thompson, L.: Climate-forced variability of ocean hypoxia, Science, 333, 336– 339, https://doi.org/10.1126/science.1202422, 2011.
Devol, A. H.: Bacterial oxygen-uptake kinetics as related to bio-logical processes in oxygen deficient zones of oceans, Deep-Sea Res., 25, 137–146, 1978.
Devol, A. H.: Solution to a marine mystery, Nature, 422, 575–576, https://doi.org/10.1038/422575a, 2003.
Devol, A. H.: Denitrification, anammox, and N2 production
in marine sediments, Annu. Rev. Mar. Sci., 7, 403–423, https://doi.org/10.1146/annurev-marine-010213-135040, 2015. Du, X. and Peterson, W.: Seasonal cycle of phytoplankton
com-munity composition in the coastal upwelling system off central oregon in 2009, Estuar. Coast., 37, 299–311 2009.
Elkins, J. E., Wofsy, S. C., McElroy, M. B., Kolb, C. E., and Kaplan, W. A.: Aquatic sources and sinks for nitrous oxide, Nature, 275, 602–606, 1978.
Escribano, R. and Schneider, W.: The structure and functioning of the coastal upwelling system off central/southern Chile, Prog. Oceanogr., 75, 343–347, 2007.
Evans, W., Hales, B., Strutton, P. G., Shearman, R. K., and Barth, J. A.: Failure to bloom: Intense upwelling results in negligi-ble phytoplankton response and prolonged CO2outgassing over the Oregon shelf, J. Geophys. Res.-Oceans, 120, 1446–1461, https://doi.org/10.1002/2014JC010580, 2015.
Falkowski, P., Barber, R., and Smetacek, V.: Biogeochemical con-trols and feedbacks on ocean primary production, Science, 281, 200–206, 1998.
Farías, L., Fernández, C., Faúndez, J., Cornejo, M., and Alcaman, M. E.: Chemolithoautotrophic production mediating the cycling of the greenhouse gases N2O and CH4in an upwelling
ecosys-tem, Biogeosciences, 6, 3053–3069, https://doi.org/10.5194/bg-6-3053-2009, 2009.
Farías, L., Besoain, V., and García-Loyola, S.: Presence of ni-trous oxide hotspots in the coastal upwelling area off central Chile: an analysis of temporal variability based on ten years of a biogeochemical time series, Environ. Res. Lett., 10, 044017, https://doi.org/10.1088/1748-9326/10/4/044017, 2015.
Fernández, C., Farías, L., and Ulloa, O.: Nitrogen Fixa-tion in Denitrified Marine Waters, PLoS ONE, 6, e20539, https://doi.org/10.1371/journal.pone.0020539, 2011.
Fernández, C. and Farías, L.: Assimilation and regeneration of inorganic nitrogen in a coastal upwelling system: Ammo-nium and nitrate utilization, Mar. Ecol.-Prog. Ser., 451, 1–14, https://doi.org/10.3354/meps09683, 2012.
Galán, A., Molina, V., Thamdrup, B., Woebken, D., Lavik, G., Kuypers, M. M. M., and Ulloa, O.: Anammox bacteria and the anaerobic oxidation of ammonium in the oxygen minimum zone off northern Chile, Deep-Sea Res. Pt. II, 56, 1021–1031, https://doi.org/10.1016/j.dsr2.2008.09.016, 2009.
Galán, A., Molina, V., Belmar, L., and Ulloa, O.: Tempo-ral variability and phylogenetic characterization of plank-tonic anammox bacteria in the coastal upwelling ecosys-tem off central Chile, Prog. Oceanogr., 92–95, 110–120, https://doi.org/10.1016/j.pocean.2011.07.007, 2012.
Galán, A., Faúndez, J., Thamdrup, B., Santibañez, J. F., and Farías, L.: Temporal dynamics of nitrogen loss in the coastal upwelling ecosystem off central Chile: Evidence of autotrophic denitrifi-cation through sulfide oxidation, Limnol. Oceanogr., 59, 1865– 1878, https://doi.org/10.4319/lo.2014.59.6.1865, 2014.
Ganesh, S., Bristow, L. A., Larsen, M., Sarode, N., Tham-drup, B., and Stewart, F. J.: Size-fraction partitioning of community gene transcription and nitrogen metabolism in a marine oxygen minimum zone, ISME J., 9, 2682–2696, https://doi.org/10.1038/ismej.2015.44, 2015.
Ginestet, P., Audic, J., Urbain, V., and Block, J.: Estimation of nitri-fying bacterial activities by measuring oxygen uptake in the pres-ence of the metabolic inhibitors allylthiourea and azide, Appl. Environ. Microb., 64, 2266–2268, 1998.
Goreau, T. J., Kaplan, W. A., Wofsy, S. C., Mc Elroy, M. B., Val-ois, F. W., and Watson, S. W.: Production of NO−2 and N2O by nitrifying bacteria at reduced concentration of oxygen, Appl. En-viron. Microb., 40, 526–532, 1980.
Grasshoff, K., Ehrhardt, M., and Kremling, K.: Methods of seawater analysis, 2nd Edn., Verlag Chemie GmbH, Weinheim, Germany, 1983.
Gruber, N. and Sarmiento, J.: Global pattern of marine nitrogen fix-ation and denitrificfix-ation, Global Biogeochem. Cy., 11, 235–266, 1997.
Hamersley, M. R., Lavik, G., Woebken, D., Rattray, J. E., Lam, P., Hopmans, E. C., Damsté, J. S. S., Krüger, S., Graco, M., Gutiér-rez, D., and Kuypers, M. M. M.: Anaerobic ammonium oxidation in the Peruvian oxygen minimum zone, Limnol. Oceanogr., 52, 923–933, 2007.
Helly, J. J. and Levin, L. A.: Global distribution of naturally oc-curring marine hypoxia on continental margins, Deep-Sea Res. Pt. II, 51, 1159–1168, https://doi.org/10.1016/j.dsr.2004.03.009, 2004.
Helm, K. P., Bindoff, N. L., and Church, J. A.: Observed decreases in oxygen content of the global ocean, Geophys. Res., Lett., 38, L23602, https://doi.org/10.1029/2011GL049513, 2011. Holmes, R. H., Aminot, A., Kéouel, R., Hooker, B. A., and
Peter-son, B. J.: A simple and precise method for measuring ammo-nium in marine and freshwater ecosystems, Can. J. Fish. Aquat. Sci., 56, 1801–1808, https://doi.org/10.1139/f99-128, 1999. IPCC: Synthesis Report. Contribution of Working Groups I, II and
III to the Fifth Assessment Report of the Intergovernmental Panel on Climate Change, edited by: Pachauri, R. K. and Meyer, L. A., IPCC, Geneva, Switzerland, 151 pp., 2014.
Jansson, B. P., Malandrin, L., and Johansson, H. E.: Cell cycle arrest in archaea by the hypusination inhibitor N1-guanyl-1, 7-diaminoheptane, J. Bacteriol., 182, 1158–1161, 2000.
Jensen, M. M., Kuypers, M. M. M., Lavik, G., and Thamdrup, B.: Rates and regulation of anaerobic ammonium oxidation and denitrification in the Black Sea, Limnol. Oceanogr., 53, 23–36, https://doi.org/10.4319/lo.2008.53.1.0023, 2008.
Jensen, M. M., Petersen, J., Dalsgaard, T., and Thamdrup, B.: Path-ways, rates, and regulation of N2production in the chemocline of an anoxic basin, Mariager Fjord, Denmark, Mar. Chem., 113, 102–113, https://doi.org/10.1016/j.marchem.2009.01.002, 2009. Jensen, M. M., Lam, P., Revsbech, N. P., Nagel, B., Gaye, B., Jet-ten, M. S. M., and Kuypers, M. M. M.: Intensive nitrogen loss over the Omani Shelf due to anammox coupled with dissimila-tory nitrite reduction to ammonium, Int. Soc. Microb. Ecol. J., 5, 1660–1670, https://doi.org/10.1038/ismej.2011.44, 2011. Jung, M. Y., Well, R., Min D., Giesemann, A, Park, S. J., Kim,
J. G., Kim, S. J., and Rhee, S. K.: Isotopic signatures of N2O produced by ammonia-oxidizing archaea from soils, ISME J., 8, 1115–1125, https://doi.org/10.1038/ismej.2013.205, 2014. Kalvelage, T., Jensen, M. M., Contreras, S., Revsbech, N. P.,
Lam, P., Günter, M., LaRoche, J., Lavik, G., and Kuypers, M. M. M.: Oxygen sensitivity of anammox and coupled N-cycle processes in oxygen minimum zones, PLoS ONE, 6, e29299, https://doi.org/10.1371/journal.pone.0029299, 2011.
Kalvelage, T., Lavik, G., Lam, P., Contreras, S., Arteaga, L., Loscher, C. R., Oschiles, A., Paulmier, A., Stramma, L., and Kuypers, M. M. M.: Nitrogen cycling driven by organic matter export in the South Pacific oxygen minimum zone, Nat. Geosci., 6, 228–234, https://doi.org/10.1038/NGEO1739, 2013.
Keeling, R. F., Kortzinger, A., and Gruber, N.: Ocean deoxygena-tion in a warming world, Annu. Rev. Mar. Sci., 2, 199–229, https://doi.org/10.1146/annurev.marine.010908.163855, 2010.
Kester, R., de Boer, W., and Laanbroek, H.: Production of NO and N2O by pure cultures of nitrifying and denitrifying bacteria
dur-ing changes in aeration, Appl. Environ. Microb., 10, 3872–3877, 1977.
Kim, B. K., Jung, M. Y., Yu, D. S., Park, S. J., Oh, T. K., Rhee, S. K., and Kim, J. F.: Genome sequence of an ammonia-oxidizing soil archaeon, “Candidatus Nitrosoarchaeum koreensis” MY1, J. Bacteriol., 193, 5539–5540, https://doi.org/10.1128/JB.05717-11, 2011.
Klawonn, I., Bonaglia, S., Brüchert, V., and Ploug, H.: Aero-bic and anaeroAero-bic nitrogen transformation processes in N2
-fixing cyanobacterial aggregates, ISME J., 9, 1456–1466, https://doi.org/10.1038/ismej.2014.232, 2015.
Könneke, M., Bernhard, A. E., de la Torre, J. R., Walker, C. B., Waterbury, J. B., and Stahl, D. A.: Isolation of an autotrophic ammonia-oxidizing marine archaeon, Nature, 437, 543–546, https://doi.org/10.1038/nature03911, 2005.
Kozlowski, J. A., Stieglmeier, M., Schleper, C., Klotz, M. G., and Stein, L. Y.: Pathways and key intermediates re-quired for obligate aerobic ammonia-dependent chemolithotro-phy in bacteria andThaumarchaeota, ISME J., 10, 1836–1845, https://doi.org/10.1038/ismej.2016.2, 2016.
Kuypers, M. M. M., Lavik, G., Woebken, D., Schmid, M., Fuchs, B. M., Amman, R., Jørgensen, B. B., and Jetten, M. S. M.: Mas-sive nitrogen loss from the Benguela upwelling system through anaerobic ammonium oxidation, P. Natl. Acad. Sci. USA, 102, 6478–6483, https://doi.org/10.1073/pnas.0502088102, 2005. Lam, P., Lavik, G., Jensen, M. M., van de Vossenberg, J., Schmid,
M., Woebken, D., Gutiérrez, D., Amann, R., Jetten, M. S. M., and Kuypers, M. M. M.: Revising the nitrogen cycle in the Peru-vian oxygen minimum zone, P. Natl. Acad. Sci. USA, 106, 4752– 4757, 2009.
Large, W. G. and Pond, S.: Open ocean momentum flux measure-ments in moderate to strong winds, J. Phys. Oceanogr., 11, 324– 336, 1981.
Levipan, H. A., Quiñones, R. A., and Urrutia, H.: A time series of prokaryote secondary production in the oxygen minimum zone of the Humboldt Current system, off central Chile, Prog. Oceanogr., 75, 531–549, 2007.
Lipschultz, F., Zafiriou, O., Wofsy, S. C., Valois, S. C., Watson, S., and McElroy, M. B.: Production of NO and N2O by soil
nitrify-ing bacteria, Nature, 294, 641–643, 1981.
Liu, K. K., Su, M. J., Hsueh, C. R., and Gong, G. C.: The nitrogen isotopic composition of nitrate in the Kuroshio Water northeast of Taiwan: Evidence for nitrogen fixation as a source of isotopi-cally light nitrate, Mar. Chem., 54, 273–292, 1996.
Löscher, C. R., Kock, A., Könneke, M., LaRoche, J., Bange, H. W., and Schmitz, R. A.: Production of oceanic nitrous oxide by ammonia-oxidizing archaea, Biogeosciences, 9, 2419–2429, https://doi.org/10.5194/bg-9-2419-2012, 2012.
Martens-Habbena, W., Berube, P. M., Urakawa, H., de la Torre, J. R., and Stahl, D. A.: Ammonia oxidation kinetics determine niche separation of nitrifying Archaea and Bacteria, Nature, 461, 976–979, https://doi.org/10.1038/nature08465, 2009.
McElroy, M. B. Elkins, J. W., Wofsy, S. C., Kolb, C. E., Durán, A. P., and Kaplan, W. A.: Production and release of N2O from the
Potomac Estuary, Limnol. Oceanogr., 23, 1168–1182, 1978. McIlvin, M. R. and Altabet, M. A.: Chemical conversion of nitrate