TítuloNovel feature selection methods for high dimensional data
372
0
0
Texto completo
(2)
(3) March 12, 2014 UNIVERSITY OF A CORUÑA. FACULTY OF INFORMATICS Campus de Elviña s/n 15071 - A Coruña (Spain). Copyright notice: No part of this publication may be reproduced, stored in a retrieval system, or transmitted in any form or by any means, electronic, mechanical, photocopying, recording and/or otherwise without the prior permission of the authors..
(4)
(5) Stay hungry. Stay foolish..
(6)
(7) Acknowledgements. The path to becoming a doctor has been long. It started back in the kindergarten, when I was curious about everything and the necessity of investigating arose. From primary to high school, I was taught how to read, how to write, how to add and subtract. It was in University when I learned how to fall seven times and stand up eight. After graduating, I started my PhD, without knowing exactly what it meant. Now that I have spent all my life learning, and this stage is about to finish, I know that the term philosophy in PhD has another meaning: love of wisdom. It was this love of wisdom which encouraged me to start this journey and to stay intellectually hungry, and I hope that it will never leave me. As I have said, the path to becoming a doctor is long and hard, but also full of people to acknowledge. First of all, I would like to thank my parents. They raised me, taught me, supported me, encouraged me, loved me and provided me with everything I needed. For all these reasons, to them I dedicate this thesis. Most of all, I would like to thank my thesis advisors, Amparo and Noelia. All these years they have trained me to be a student, a researcher, a doctor. There has always been an answer to my questions, a solution to the troubles I have encountered. Without their patient guidance I would not have been made it to this point. I would like to express my gratitude to my lab mates. Not only did they help me with everything I needed, but they also became good friends. The coffee break was the best moment of the working day. Not only for the coffee –nor for the break–, but for the nice company. Thanks for that. In this journey, I had also the opportunity to travel. I would like to acknowledge Dr. Principe for welcoming me to sunny Florida. A special thanks goes to all the friends I made in the CNEL Lab. They were my little family during those warm months, filling me with experiences I will never forget. See you later, alligators. i.
(8) I also wish to thank José Manuel Benı́tez and Paco Herrera for receiving me with so much warmth during my short visit to Granada. They have taught me so much and are still doing so. Fortunately, the path is full of distractions, and I also want to acknowledge them. I am truly thankful to all my friends and family for always helping me to occupy my free time and bringing nothing but good moments to my life. A special mention goes to my sister. There is no better friend than a sister. And there is no better sister than you. Last but not least, I want to thank my husband Gabriel for supporting me in this journey. I cannot think of a better person to share my life with.. Verónica Bolón Canedo. ii.
(9) Resumo. A selección de caracterı́sticas defı́nese como o proceso de detectar as caracterı́sticas relevantes e descartar as irrelevantes, co obxectivo de obter un subconxunto de caracterı́sticas máis pequeno que describa axeitadamente o problema dado cunha degradación mı́nima ou incluso cunha mellora do rendemento. Coa chegada dos conxuntos de alta dimensión –tanto en mostras como en caracterı́sticas–, volveuse indispensable a identificación axeitada das caracterı́sticas relevantes en escenarios do mundo real. Neste contexto, os diferentes métodos dispoñibles atópanse cun novo reto en canto a aplicabilidade e escalabilidade. Ademais, é necesario desenvolver novos métodos que teñan en conta estas particularidades da alta dimensión. Esta tese está adicada á investigación en selección de caracterı́sticas e á súa aplicación a datos reais de alta dimensión. A primeira parte deste traballo trata da análise dos métodos de selección de caracterı́sticas existentes, para comprobar a súa idoneidade fronte a diferentes retos e para poder proporcionar novos resultados aos investigadores de selección de caracterı́sticas. Para isto, aplicáronse as técnicas máis populares a problemas reais, co obxectivo de obter non só melloras no rendemento senón tamén para permitir a súa aplicación en tempo real. Ademais da eficiencia, a escalabilidade tamén é un aspecto crı́tico nas aplicacións de grande escala. A eficacia dos métodos de selección de caracterı́sticas pode verse significativamente degradada, se non totalmente inaplicable, cando o tamaño dos datos medra continuamente. Por este motivo, a escalabilidade dos métodos de selección de caracterı́sticas tamén debe ser analizada. Despois de levar a cabo unha análise en profundidade dos métodos de selección de caracterı́sticas existentes, a segunda parte desta tese céntrase no desenvolvemento de novas técnicas. Debido a que a maoorı́a dos métodos de selección existentes precisan que os datos sexan discretos, a primeira aproximación proposta consiste na combinación dun discretizador, un filtro e un clasificador, obtendo resultados prometedores en escenarios diferentes. Nun intento de introducir diversidade, a segunda proposta trata de empregar un conxunto de filtros en lugar dun só, co obxectivo de liberar ao usuario de ter que decidir que técnica é a máis axeitada para un problema dado. A terceira técnica proposta nesta tese non só considera a relevancia das caracterı́sticas senón tamén o iii.
(10) seu custo asociado –económico ou canto a tempo de execución–, polo que se presenta unha metodoloxa xeral para selección de caracterı́sticas baseada en custo. Por último, propóñense varias estratexias para distribuir e paralelizar a selección de caracterı́sticas, xa que transformar un problema de grande escala en varios problemas de pequena escala pode levar a melloras no tempo de procesado e, nalgunhas ocasións, na precisión de clasificación.. iv.
(11) Resumen. La selección de caracterı́sticas se define como el proceso de detectar las caracterı́sticas relevantes y descartar las irrelevantes, con el objetivo de obtener un subconjunto de caracterı́sticas más pequeño que describa adecuadamente el problema dado con una degradación mı́nima o incluso con una mejora del rendimiento. Con la llegada de los conjuntos de alta dimensión –tanto en muestras como en caracterı́sticas–, se ha vuelto indispensable la identificación adecuada de las caracterı́sticas relevantes en escenarios del mundo real. En este contexto, los diferentes métodos disponibles se encuentran con un nuevo reto en cuanto a aplicabilidad y escalabilidad. Además, es necesario desarrollar nuevos métodos que tengan en cuenta estas particularidades de la alta dimensión. Esta tesis está dedicada a la investigación en selección de caracterı́sticas y a su aplicación a datos reales de alta dimensión. La primera parte de este trabajo trata del análisis de los métodos de selección de caracterı́sticas existentes, para comprobar su idoneidad frente a diferentes retos y para poder proporcionar nuevos resultados a los investigadores de selección de caracterı́sticas. Para esto, se han aplicado las técnicas más populares a problemas reales, con el objetivo de obtener no sólo mejoras en rendimiento sino también para permitir su aplicación en tiempo real. Además de la eficiencia, la escalabilidad también es un aspecto crı́tico en aplicaciones de gran escala. La eficacia de los métodos de selección de caracterı́sticas puede verse significativamente degradada, si no totalmente inaplicable, cuando el tamaño de los datos se incrementa continuamente. Por este motivo, la escalabilidad de los métodos de selección de caracterı́sticas también debe ser analizada. Tras llevar a cabo un análisis en profundidad de los métodos de selección de caracterı́sticas existentes, la segunda parte de esta tesis se centra en el desarrollo de nuevas técnicas. Debido a que la mayorı́a de métodos de selección existentes necesitan que los datos sean discretos, la primera aproximación propuesta consiste en la combinación de un discretizador, un filtro y un clasificador, obteniendo resultados prometedores en escenarios diferentes. En un intento de introducir diversidad, la segunda propuesta trata de usar un conjunto de filtros en lugar de uno sólo, con el objetivo de liberar al usuario de tener que decidir qué técnica es la más adecuada para un problema dado. La tercera v.
(12) técnica propuesta en esta tesis no sólo considera la relevancia de las caracterı́sticas sino también su coste asociado –económico o en cuanto a tiempo de ejecución–, por lo que se presenta una metodologa general para selección de caracterı́sticas basada en coste. Por último, se proponen varias estrategias para distribuir y paralelizar la selección de caracterı́sticas, ya que transformar un problema de gran escala en varios problemas de pequeña escala puede llevar a mejoras en el tiempo de procesado y, en algunas ocasiones, en precisión de clasificación.. vi.
(13) Abstract. Feature selection can be defined as the process of detecting the relevant features and discarding the irrelevant ones, with the goal of obtaining a small subset of features that describes properly a given problem with a minimum degradation or even improvement in performance. With the advent of high dimensionality –both in samples and features–, the adequate identification of the relevant features of the data has become indispensable in real world scenarios. In this context, the different methods available encounter a new challenge regarding application and scalability. Also, new methods that take into account the peculiarities of high dimension need to be developed. This thesis is devoted to feature selection research and its application to real high dimensional data. The first part of this work deals with the analysis of existing feature selection methods, to check their adequacy toward different challenges and to be able to provide new findings for feature selection researchers. To this end, the most popular techniques are applied to real-life problems, in an attempt to obtain not only improvements in performance but also to allow a real-time application of the techniques. Apart from efficiency, scalability is also a critical issue in large-scale applications. The effectiveness of feature selection methods may be significantly downgraded, if not totally inapplicable, when the data size increases steadily. For this reason, scalability in feature selection is analyzed as well. After carrying out an in-depth analysis of existing feature selection methods, the second part of this thesis is focused on proposing novel techniques aimed at solving some of the problems detected in the field. Since most of the existing feature selection methods need data to be discrete, the first proposed approach consists of a combination of a discretizer, a filter method and a classifier, obtaining promising results in different scenarios. In an attempt to introduce diversity, the second proposal lies on employing an ensemble of filters instead of a single one, with the aim of releasing the user from the decision of which technique is the most appropriate for a given problem. The third technique proposed in this thesis considers not only the relevance of the features but also their related cost –economic or in terms of processing time–, so that a framework for cost-based feature selection is described. Finally, several approaches for distributed and vii.
(14) parallel feature selection are also proposed, since transforming the large-scale problem into several small-scale problems can lead to improvements in processing time and, sometimes, in classification accuracy.. viii.
(15) Contents. 1 Introduction 1.1 Analysis of feature selection . . . . . . . . . . . . . . . . . . . . . . . . . 1.2 Novel feature selection methods . . . . . . . . . . . . . . . . . . . . . . . 1.3 Overview of this thesis . . . . . . . . . . . . . . . . . . . . . . . . . . . .. 1 2 4 5. I. 7. Analysis of feature selection. 2 Foundations of feature selection 2.1 Feature selection . . . . . . . . . . . . . . . . . . . . . . . . . . . . . . . 2.1.1 Feature relevance . . . . . . . . . . . . . . . . . . . . . . . . . . . 2.1.2 Feature redundancy . . . . . . . . . . . . . . . . . . . . . . . . . 2.2 Feature selection methods . . . . . . . . . . . . . . . . . . . . . . . . . . 2.2.1 Filter methods . . . . . . . . . . . . . . . . . . . . . . . . . . . . 2.2.1.1 Chi-squared . . . . . . . . . . . . . . . . . . . . . . . . 2.2.1.2 Information Gain . . . . . . . . . . . . . . . . . . . . . 2.2.1.3 Correlation-based Feature Selection, CFS . . . . . . . . 2.2.1.4 Consistency-based Filter . . . . . . . . . . . . . . . . . 2.2.1.5 Fast Correlation-Based Filter, FCBF . . . . . . . . . . 2.2.1.6 INTERACT . . . . . . . . . . . . . . . . . . . . . . . . 2.2.1.7 ReliefF . . . . . . . . . . . . . . . . . . . . . . . . . . . 2.2.1.8 minimum Redundancy Maximum Relevance, mRMR . 2.2.1.9 Md . . . . . . . . . . . . . . . . . . . . . . . . . . . . . 2.2.2 Embedded methods . . . . . . . . . . . . . . . . . . . . . . . . . 2.2.2.1 Recursive Feature Elimination for Support Vector Machines, SVM-RFE . . . . . . . . . . . . . . . . . . . . . 2.2.2.2 Feature Selection - Perceptron, FS-P . . . . . . . . . . . 2.2.3 Wrapper methods . . . . . . . . . . . . . . . . . . . . . . . . . . 2.2.4 Other approaches . . . . . . . . . . . . . . . . . . . . . . . . . . . 2.3 Summary . . . . . . . . . . . . . . . . . . . . . . . . . . . . . . . . . . .. 9 9 10 10 11 13 14 14 14 14 15 15 15 16 16 17 17 18 18 18 19. 3 A critical review of feature selection methods 21 3.1 Existing reviews of feature selection methods . . . . . . . . . . . . . . . 22 ix.
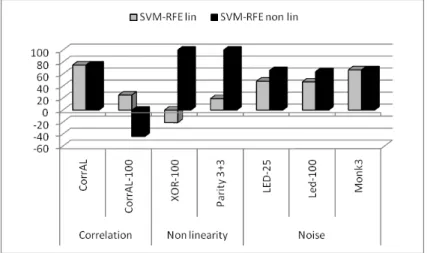
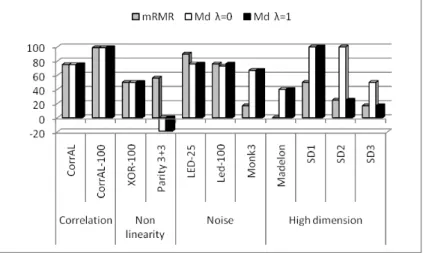
(16) 3.2. Experimental settings . . . . . . . . . . . . . . . . . . . . . . . . . . . .. 24. 3.3. Experimental results . . . . . . . . . . . . . . . . . . . . . . . . . . . . .. 26. 3.3.1. Dealing with correlation and redundancy: CorrAL . . . . . . . .. 27. 3.3.2. Dealing with non-linearity: XOR and Parity . . . . . . . . . . . .. 28. 3.3.3. Dealing with noise in the inputs: Led . . . . . . . . . . . . . . .. 30. 3.3.4. Dealing with noise in the target: Monk3 . . . . . . . . . . . . . .. 35. 3.3.4.1. Dealing with a small ratio samples/features: SD1, SD2 and SD3 . . . . . . . . . . . . . . . . . . . . . . . . . .. 36. Dealing with a complex dataset: Madelon . . . . . . . . . . . . .. 39. Cases of study . . . . . . . . . . . . . . . . . . . . . . . . . . . . . . . .. 40. 3.4.1. Case of study I: different kernels for SVM-RFE . . . . . . . . . .. 40. 3.4.2. Case of study II: mRMR vs Md . . . . . . . . . . . . . . . . . .. 41. 3.4.3. Case of study III: subset filters . . . . . . . . . . . . . . . . . . .. 42. 3.4.4. Case of study IV: different levels of noise in the input . . . . . .. 43. Analysis and Discussion . . . . . . . . . . . . . . . . . . . . . . . . . . .. 45. 3.5.1. Analysis of index of success . . . . . . . . . . . . . . . . . . . . .. 45. 3.5.2. Analysis of classification accuracy. . . . . . . . . . . . . . . . . .. 48. Summary . . . . . . . . . . . . . . . . . . . . . . . . . . . . . . . . . . .. 53. 3.3.5 3.4. 3.5. 3.6. 4 Feature selection in DNA microarray classification. 55. 4.1. Background: the problem and first attempts . . . . . . . . . . . . . . . .. 57. 4.2. Intrinsic characteristics of microarray data . . . . . . . . . . . . . . . . .. 58. 4.2.1. Small sample size . . . . . . . . . . . . . . . . . . . . . . . . . . .. 58. 4.2.2. Class imbalance . . . . . . . . . . . . . . . . . . . . . . . . . . . .. 58. 4.2.3. Data complexity . . . . . . . . . . . . . . . . . . . . . . . . . . .. 60. 4.2.4. Dataset shift . . . . . . . . . . . . . . . . . . . . . . . . . . . . .. 60. 4.2.5. Outliers . . . . . . . . . . . . . . . . . . . . . . . . . . . . . . . .. 61. Algorithms for feature selection on microarray data: a review . . . . . .. 62. 4.3.1. Filters . . . . . . . . . . . . . . . . . . . . . . . . . . . . . . . . .. 62. 4.3.1.1. Information Theory . . . . . . . . . . . . . . . . . . . .. 63. 4.3.1.2. Discretization . . . . . . . . . . . . . . . . . . . . . . .. 64. 4.3.1.3. Multiple binary problems . . . . . . . . . . . . . . . . .. 65. 4.3.1.4. Other approaches . . . . . . . . . . . . . . . . . . . . .. 65. 4.3.2. Wrappers . . . . . . . . . . . . . . . . . . . . . . . . . . . . . . .. 66. 4.3.3. Embedded . . . . . . . . . . . . . . . . . . . . . . . . . . . . . . .. 67. 4.3.4. Other algorithms . . . . . . . . . . . . . . . . . . . . . . . . . . .. 69. A framework for feature selection evaluation in microarray datasets . . .. 73. 4.4.1. 74. 4.3. 4.4. Validation techniques . . . . . . . . . . . . . . . . . . . . . . . . x.
(17) 4.5. 4.6. 4.4.2. On the datasets characteristics . . . . . . . . . . . . . . . . . . .. 75. 4.4.3. Feature selection methods . . . . . . . . . . . . . . . . . . . . . .. 76. 4.4.4. Evaluation measures . . . . . . . . . . . . . . . . . . . . . . . . .. 77. A practical evaluation: Analysis of results . . . . . . . . . . . . . . . . .. 77. 4.5.1. Holdout validation study . . . . . . . . . . . . . . . . . . . . . .. 78. 4.5.2. Cross-validation study . . . . . . . . . . . . . . . . . . . . . . . .. 80. 4.5.2.1. Analysis of algorithms . . . . . . . . . . . . . . . . . . .. 87. 4.5.2.2. Cross-validation Vs. DOB-SCV . . . . . . . . . . . . .. 87. 4.5.2.3. Analysis of datasets characteristics . . . . . . . . . . . .. 88. Summary . . . . . . . . . . . . . . . . . . . . . . . . . . . . . . . . . . .. 89. 5 Feature selection in other real applications 5.1. 5.2. 5.3. Tear film lipid layer classification . . . . . . . . . . . . . . . . . . . . . .. 91. 5.1.1. Classification accuracy . . . . . . . . . . . . . . . . . . . . . . . .. 96. 5.1.2. Robustness to noise . . . . . . . . . . . . . . . . . . . . . . . . .. 97. 5.1.3. Feature extraction time . . . . . . . . . . . . . . . . . . . . . . .. 98. 5.1.4. Overall analysis . . . . . . . . . . . . . . . . . . . . . . . . . . . .. 99. 5.1.5. The concatenation of all methods with CFS: a case of study . . . 101. K-complex classification . . . . . . . . . . . . . . . . . . . . . . . . . . . 104 5.2.1. Results without feature selection . . . . . . . . . . . . . . . . . . 108. 5.2.2. Results with feature selection . . . . . . . . . . . . . . . . . . . . 109. 5.2.3. Overall analysis . . . . . . . . . . . . . . . . . . . . . . . . . . . . 111. 5.2.4. Comparative study with previous results . . . . . . . . . . . . . . 112. Summary . . . . . . . . . . . . . . . . . . . . . . . . . . . . . . . . . . . 112. 6 Scalability in feature selection 6.1. 115. Scalability of neural networks through feature selection . . . . . . . . . . 116 6.1.1. 6.1.2. 6.1.3. 6.2. 91. Experimental study . . . . . . . . . . . . . . . . . . . . . . . . . 117 6.1.1.1. Performance measures . . . . . . . . . . . . . . . . . . . 118. 6.1.1.2. Experimental procedure . . . . . . . . . . . . . . . . . . 119. Experimental results . . . . . . . . . . . . . . . . . . . . . . . . . 120 6.1.2.1. Classification . . . . . . . . . . . . . . . . . . . . . . . . 120. 6.1.2.2. Regression . . . . . . . . . . . . . . . . . . . . . . . . . 124. Discussion . . . . . . . . . . . . . . . . . . . . . . . . . . . . . . . 127 6.1.3.1. Classification . . . . . . . . . . . . . . . . . . . . . . . . 127. 6.1.3.2. Regression . . . . . . . . . . . . . . . . . . . . . . . . . 128. Scalability of feature selection methods . . . . . . . . . . . . . . . . . . . 130 6.2.1. Experimental study . . . . . . . . . . . . . . . . . . . . . . . . . 131 xi.
(18) 6.2.2. 6.2.3. 6.3. II. Evaluation metrics . . . . . . . . . . . . . . . . . . . . . . . . . . 132 6.2.2.1. Measures for ranker methods . . . . . . . . . . . . . . . 134. 6.2.2.2. Measures for subset methods . . . . . . . . . . . . . . . 135. 6.2.2.3. Summary of measures . . . . . . . . . . . . . . . . . . . 136. Experimental results . . . . . . . . . . . . . . . . . . . . . . . . . 137 6.2.3.1. Scalability of filters . . . . . . . . . . . . . . . . . . . . 137. 6.2.3.2. Case of study: SD datasets . . . . . . . . . . . . . . . . 144. 6.2.3.3. Scalability of wrappers . . . . . . . . . . . . . . . . . . 147. 6.2.3.4. Scalability of embedded methods . . . . . . . . . . . . . 150. 6.2.3.5. Comparative among filters, wrappers and embedded . . 152. Summary . . . . . . . . . . . . . . . . . . . . . . . . . . . . . . . . . . . 153. Novel feature selection methods. 7 Combination of discretization and feature selection methods 7.1. Discretization . . . . . . . . . . . . . . . . . . . . . . . . . . . . . 160 7.1.1.1. Entropy Minimization Discretization, EMD . . . . . . . 161. 7.1.1.2. Proportional k-Interval Discretization, PKID . . . . . . 161. 7.1.1.3. Equal Width Discretization, EWD . . . . . . . . . . . . 162. 7.1.1.4. Equal Frequency Discretization, EFD . . . . . . . . . . 162. 7.1.2. Feature selection . . . . . . . . . . . . . . . . . . . . . . . . . . . 162. 7.1.3. Classification . . . . . . . . . . . . . . . . . . . . . . . . . . . . . 162. The KDD Cup 99 Dataset . . . . . . . . . . . . . . . . . . . . . . . . . . 163 7.2.1. 7.2.2. Results on the binary case . . . . . . . . . . . . . . . . . . . . . . 165 7.2.1.1. Classifiers without symbolic conversion . . . . . . . . . 166. 7.2.1.2. Classifiers with symbolic conversion . . . . . . . . . . . 167. Results on the multiple class case . . . . . . . . . . . . . . . . . . 168 7.2.2.1. 7.3. Comparison with other authors . . . . . . . . . . . . . . 173. DNA microarray data . . . . . . . . . . . . . . . . . . . . . . . . . . . . 174 7.3.1. 7.4. 157. The proposed methodology . . . . . . . . . . . . . . . . . . . . . . . . . 160 7.1.1. 7.2. 155. Experimental results . . . . . . . . . . . . . . . . . . . . . . . . . 176 7.3.1.1. Comparison with other authors . . . . . . . . . . . . . . 180. 7.3.1.2. Results obtained by a classifier based on information theoretic learning . . . . . . . . . . . . . . . . . . . . . 183. Multiple class datasets . . . . . . . . . . . . . . . . . . . . . . . . . . . . 188 7.4.1. Experimental results . . . . . . . . . . . . . . . . . . . . . . . . . 189 7.4.1.1. Analysis of multiclass versus multiple binary approaches 191 xii.
(19) 7.5. 7.4.1.2 Best discretizer, filter and classifier combination . . . . 195 Summary . . . . . . . . . . . . . . . . . . . . . . . . . . . . . . . . . . . 196. 8 An 8.1 8.2 8.3. ensemble of filters and classifiers The rationale of the approach . . . . . . . . The process of selecting the methods for the The proposed filter ensemble approaches . . 8.3.1 Ensemble 1 . . . . . . . . . . . . . . 8.3.2 Ensemble 2 . . . . . . . . . . . . . . 8.4 Experimental setup . . . . . . . . . . . . . . 8.4.1 The stability of the selected filters . 8.5 Experimental results . . . . . . . . . . . . . 8.5.1 Results on synthetic data . . . . . . 8.5.2 Results on classical datasets . . . . . 8.5.3 Results on microarray data . . . . . 8.5.4 The imbalance problem . . . . . . . 8.6 Summary . . . . . . . . . . . . . . . . . . .. 9 Cost-based feature selection 9.1 Background . . . . . . . . . . . . . . . . . 9.2 Description of the method . . . . . . . . . 9.2.1 minimum cost CFS, mC-CFS . . . 9.2.2 minimum cost mRMR, mC-mRMR 9.2.3 minimum cost ReliefF, mC-ReliefF 9.2.4 Generalization . . . . . . . . . . . 9.3 Experimental study . . . . . . . . . . . . . 9.4 Experimental results . . . . . . . . . . . . 9.5 Case of study: a real life problem . . . . . 9.6 Summary . . . . . . . . . . . . . . . . . .. . . . . . . . . . .. . . . . . . ensemble . . . . . . . . . . . . . . . . . . . . . . . . . . . . . . . . . . . . . . . . . . . . . . . . . . . . . . . . . . . . . . . . . .. . . . . . . . . . .. . . . . . . . . . .. 10 Distributed and parallel feature selection 10.1 General methodology . . . . . . . . . . . . . . . 10.2 Horizontal partitioning . . . . . . . . . . . . . . 10.2.1 Experimental setup . . . . . . . . . . . . 10.2.2 Experimental results . . . . . . . . . . . 10.2.2.1 Number of features selected . . 10.2.2.2 Classification accuracy results 10.2.2.3 Runtime . . . . . . . . . . . . 10.3 Vertical partitioning . . . . . . . . . . . . . . . xiii. . . . . . . . . . .. . . . . . . . .. . . . . . . . . . .. . . . . . . . .. . . . . . . . . . .. . . . . . . . .. . . . . . . . . . .. . . . . . . . .. . . . . . . . . . . . . .. . . . . . . . . . .. . . . . . . . .. . . . . . . . . . . . . .. . . . . . . . . . .. . . . . . . . .. . . . . . . . . . . . . .. . . . . . . . . . .. . . . . . . . .. . . . . . . . . . . . . .. . . . . . . . . . .. . . . . . . . .. . . . . . . . . . . . . .. . . . . . . . . . .. . . . . . . . .. . . . . . . . . . . . . .. . . . . . . . . . .. . . . . . . . .. . . . . . . . . . . . . .. . . . . . . . . . .. . . . . . . . .. . . . . . . . . . . . . .. . . . . . . . . . .. . . . . . . . .. . . . . . . . . . . . . .. . . . . . . . . . .. . . . . . . . .. . . . . . . . . . . . . .. 199 200 201 203 203 204 206 207 208 208 209 213 215 216. . . . . . . . . . .. 219 220 222 222 223 225 226 227 228 235 238. . . . . . . . .. 239 240 241 244 245 245 247 247 250.
(20) 10.3.1 Experimental results . . . . . . . . . . . . . . . . . . . . . . . . . 252 10.3.1.1 Number of features selected . . . . . . . . . . . . . . . . 252 10.3.1.2 Classification accuracy results . . . . . . . . . . . . . . 254 10.3.1.3 Runtime . . . . . . . . . . . . . . . . . . . . . . . . . . 254 10.4 Case of study: vertical partitioning applied to DNA microarray data . . 257 10.4.1 Experimental setup . . . . . . . . . . . . . . . . . . . . . . . . . . 260 10.4.2 Election of the ranker method . . . . . . . . . . . . . . . . . . . . 261 10.4.3 Experimental results . . . . . . . . . . . . . . . . . . . . . . . . . 262 10.4.3.1 Number of features selected . . . . . . . . . . . . . . . . 262 10.4.3.2 Classification accuracy results . . . . . . . . . . . . . . 266 10.4.3.3 Runtime . . . . . . . . . . . . . . . . . . . . . . . . . . 271 10.5 Incremental vertical partitioning . . . . . . . . . . . . . . . . . . . . . . 272 10.5.1 The proposed method . . . . . . . . . . . . . . . . . . . . . . . . 273 10.5.1.1 Partition of the Dataset . . . . . . . . . . . . . . . . . . 274 10.5.1.2 Learning Methods . . . . . . . . . . . . . . . . . . . . . 275 10.5.1.3 Combination of the results . . . . . . . . . . . . . . . . 278 10.5.2 Experimental setup . . . . . . . . . . . . . . . . . . . . . . . . . . 278 10.5.3 Experimental results . . . . . . . . . . . . . . . . . . . . . . . . . 279 10.6 Summary . . . . . . . . . . . . . . . . . . . . . . . . . . . . . . . . . . . 281 11 Conclusions and future work. 283. I. 289. Materials and methods I.1. Software tools . . . . . . . . . . . . . . . . . . . . . . . . . . . . . . . . . 289. I.2. Datasets . . . . . . . . . . . . . . . . . . . . . . . . . . . . . . . . . . . . 290 I.2.1. I.3. Synthetic datasets . . . . . . . . . . . . . . . . . . . . . . . . . . 290 I.2.1.1. CorrAL . . . . . . . . . . . . . . . . . . . . . . . . . . . 291. I.2.1.2. XOR-100 . . . . . . . . . . . . . . . . . . . . . . . . . . 292. I.2.1.3. Parity3+3 . . . . . . . . . . . . . . . . . . . . . . . . . 292. I.2.1.4. The Led problem. I.2.1.5. The Monk problems . . . . . . . . . . . . . . . . . . . . 293. I.2.1.6. SD1, SD2 and SD3. I.2.1.7. Madelon . . . . . . . . . . . . . . . . . . . . . . . . . . 295. . . . . . . . . . . . . . . . . . . . . . 292 . . . . . . . . . . . . . . . . . . . . 293. I.2.2. Classical datasets . . . . . . . . . . . . . . . . . . . . . . . . . . . 295. I.2.3. Datasets for regression . . . . . . . . . . . . . . . . . . . . . . . . 297. I.2.4. DNA microarray datasets . . . . . . . . . . . . . . . . . . . . . . 298. Validation techniques . . . . . . . . . . . . . . . . . . . . . . . . . . . . . 299 I.3.1. k -fold cross validation . . . . . . . . . . . . . . . . . . . . . . . . 300 xiv.
(21) I.4 I.5. I.6. I.3.2 Leave-one-out cross validation . . . . . . . . . . . I.3.3 Bootstrap . . . . . . . . . . . . . . . . . . . . . . I.3.4 Holdout validation . . . . . . . . . . . . . . . . . Statistical tests . . . . . . . . . . . . . . . . . . . . . . . Classification algorithms . . . . . . . . . . . . . . . . . . I.5.1 Support Vector Machine, SVM . . . . . . . . . . I.5.2 Proximal Support Vector Machine, PSVM . . . . I.5.3 C4.5 . . . . . . . . . . . . . . . . . . . . . . . . . I.5.4 naive Bayes, NB . . . . . . . . . . . . . . . . . . I.5.5 k-nearest neighbors, k-NN . . . . . . . . . . . . . I.5.6 Multi-Layer Perceptron, MLP . . . . . . . . . . . I.5.7 One-layer Feedfoward Neural Network, One-layer I.5.8 AdaBoost, AB . . . . . . . . . . . . . . . . . . . Evaluation measures . . . . . . . . . . . . . . . . . . . . I.6.1 Multiple-criteria decision-making . . . . . . . . .. . . . . . . . . . . . . . . . . . . . . . . . . . . . . . . . . . NN . . . . . . . . .. . . . . . . . . . . . . . . .. . . . . . . . . . . . . . . .. . . . . . . . . . . . . . . .. . . . . . . . . . . . . . . .. . . . . . . . . . . . . . . .. . . . . . . . . . . . . . . .. 300 300 300 301 301 302 302 302 303 303 303 304 304 304 305. II Author’s key publications and mentions. 307. III Resumen del trabajo. 313. Bibliography. 321. xv.
(22) xvi.
(23) List of figures. 1.1. Organization of the thesis . . . . . . . . . . . . . . . . . . . . . . . . . .. 6. 2.1. Overview of feature relevance and redundancy . . . . . . . . . . . . . . .. 11. 3.2 3.3 3.4 3.5 3.6. SVM-RFE:Linear vs Gaussian kernel . . . mRMR vs Md . . . . . . . . . . . . . . . Subset filters . . . . . . . . . . . . . . . . Results for Led-25 and Led-100 . . . . . . Time in seconds for the datasets XOR-100. 40 41 42 44 47. 4.1. General process of acquiring the gene expression data from DNA microarray . . . . . . . . . . . . . . . . . . . . . . . . . . . . . . . . . . . . Feature #1136 in Lung dataset . . . . . . . . . . . . . . . . . . . . . . . DNA microarray classification pipeline. . . . . . . . . . . . . . . . . . . Two first features selected by mRMR in the first fold for both 5-fold cross-validation and 5DOB-SCV . . . . . . . . . . . . . . . . . . . . . .. 4.2 4.3 4.4. 5.1 5.2 5.3 6.1 6.2 6.3 6.4. . . . . . . . . . . . . . . . . . . . . . . . . . . . . . . . . and Led-100.. . . . . .. . . . . .. . . . . .. . . . . .. . . . . .. . . . . .. . . . . .. . . . . .. . . . . .. 57 61 73 89. Steps of the research methodology. . . . . . . . . . . . . . . . . . . . . . 92 Pareto front of a multi-objective optimization problem based on accuracy and robustness to noise. . . . . . . . . . . . . . . . . . . . . . . . . . . . 101 The K-complex classification methodology. . . . . . . . . . . . . . . . . . 106. 6.6 6.7 6.8. Performance measures . . . . . . . . . . . . . . . . . . . . . . . . . . . . Measures of scalability of ranker selection methods in the Corral dataset Measures of scalability of subset methods in the Corral dataset . . . . . Comparison of scalability measures for ranker filters (ChiSquared, InfoGain, ReliefF and mRMR) . . . . . . . . . . . . . . . . . . . . . . . . . Comparison of scalability measures for subset filters (FCBF, CFS, Cons and INTERACT) . . . . . . . . . . . . . . . . . . . . . . . . . . . . . . . Measures of scalability of wrappers in the Corral dataset . . . . . . . . . Comparison of scalability measures for wrappers . . . . . . . . . . . . . Measures of scalability of embedded methods in the Corral dataset . . .. 7.1. The proposed methodology. . . . . . . . . . . . . . . . . . . . . . . . . . 160. 6.5. xvii. 118 138 139 142 143 148 149 150.
(24) 7.2 7.3 7.4 7.5 7.6 7.7 7.8 7.9. Preprocessing for the classifiers with symbolic conversion. Code matrix for a four-class problem . . . . . . . . . . . . An unbalanced gene of GCM dataset . . . . . . . . . . . . An unbalanced gene of CNS dataset . . . . . . . . . . . . An unbalanced gene of Prostate dataset . . . . . . . . . . Best results obtained for the Thyroid data set . . . . . . . Multiple comparison results for the Thyroid data set . . . Best results obtained for the Leukemia data set . . . . . .. 8.1 8.2. Implementations of the ensemble . . . . . . . . . . . . . . . . . . . . . . 201 Configurations of Ensemble1: E1-nk and E1-ns . . . . . . . . . . . . . . 204. 9.1. Error / cost plots of first block of datasets for cost feature selection with CFS and mRMR. . . . . . . . . . . . . . . . . . . . . . . . . . . . . . . . Kruskal-Wallis statistical test results of Pima dataset. . . . . . . . . . . Error / cost plots of second block of datasets for cost feature selection with CFS and mRMR. . . . . . . . . . . . . . . . . . . . . . . . . . . . . Kruskal-Wallis error statistical test of Sat dataset with mC-CFS. . . . . Kruskal-Wallis cost statistical test results of Sat dataset with mC-CFS. Error / cost plots on third block of datasets for cost feature selection with CFS and mRMR. . . . . . . . . . . . . . . . . . . . . . . . . . . . . Kruskal-Wallis error statistical test of DLBCL dataset with mC-mRMR. Kruskal-Wallis cost statistical test of DLBCL dataset with mC-mRMR. Error / cost plots (top) and Pareto front (bottom) of VOPTICAL I1 dataset . . . . . . . . . . . . . . . . . . . . . . . . . . . . . . . . . . . . .. 9.2 9.3 9.4 9.5 9.6 9.7 9.8 9.9. . . . . . . . .. . . . . . . . .. . . . . . . . .. . . . . . . . .. . . . . . . . .. . . . . . . . .. . . . . . . . .. . . . . . . . .. 168 169 175 175 175 189 190 191. 229 230 231 232 232 233 233 234 236. 10.1 Flow chart of proposed algorithm . . . . . . . . . . . . . . . . . . . . . . 258 10.2 Flow chart of proposed methodology . . . . . . . . . . . . . . . . . . . . 274 10.3 Plots regarding time performance of the algorithm. . . . . . . . . . . . . 280 I.1. LED Scheme . . . . . . . . . . . . . . . . . . . . . . . . . . . . . . . . . 292. xviii.
(25) List of tables. 2.1 2.2. Feature selection techniques. . . . . . . . . . . . . . . . . . . . . . . . . . Summary of filters . . . . . . . . . . . . . . . . . . . . . . . . . . . . . .. 13 17. 3.1 3.2 3.3 3.4 3.5 3.6 3.7 3.8 3.9 3.10 3.11 3.12 3.13 3.14. Results for CorrAL . . . . . . . . . . . . . . . . . . . . . . . . . . . . . Results for CorrAL-100 . . . . . . . . . . . . . . . . . . . . . . . . . . Results for XOR-100. . . . . . . . . . . . . . . . . . . . . . . . . . . . . Results for Parity3+3 . . . . . . . . . . . . . . . . . . . . . . . . . . . Results for Led-25 dataset with different levels of noise (N) in inputs. Results for Led-100 dataset with different levels of noise (N) in inputs. Results for Monk3 . . . . . . . . . . . . . . . . . . . . . . . . . . . . . Features selected by each algorithm on synthetic dataset SD1 . . . . . Features selected by each algorithm on synthetic dataset SD2 . . . . . Features selected by each algorithm on synthetic dataset SD3 . . . . . Results for Madelon . . . . . . . . . . . . . . . . . . . . . . . . . . . . Average of success for every feature selection method tested . . . . . . Summary of results grouped by classifier . . . . . . . . . . . . . . . . . General guidelines for specific problems . . . . . . . . . . . . . . . . .. . . . . . . . . . . . . . .. 27 28 29 29 30 33 35 36 37 38 39 46 50 53. 4.1 4.2 4.3 4.4 4.5. Filter methods used on microarray data . . . . . . . . . . . . . . . . . . Wrapper methods used on microarray data . . . . . . . . . . . . . . . . Embedded methods used on microarray data . . . . . . . . . . . . . . . Other feature selection methods used on microarray data . . . . . . . . Imbalance ratio and F1 of the binary datasets used in the holdout experimental study . . . . . . . . . . . . . . . . . . . . . . . . . . . . . . . Imbalance ratio and F1 of the binary datasets used in the k -fold crossvalidation experimental study . . . . . . . . . . . . . . . . . . . . . . . . Number of features selected by subset methods on binary datasets . . . Results for C4.5 and holdout validation . . . . . . . . . . . . . . . . . . Results for naive Bayes and holdout validation . . . . . . . . . . . . . . Results for SVM and holdout validation . . . . . . . . . . . . . . . . . . Results for C4.5 and 5-fold cross-validation . . . . . . . . . . . . . . . . Results fo C4.5 and DOB-SCV with 5 folds . . . . . . . . . . . . . . . . Results for naive Bayes and 5-fold cross-validation . . . . . . . . . . . .. 66 67 69 72. 4.6 4.7 4.8 4.9 4.10 4.11 4.12 4.13. xix. 76 76 78 79 79 80 81 82 83.
(26) 4.14 Results for naive Bayes and DOB-SCV with 5 folds . . . . . . . . . . . .. 84. 4.15 Results for SVM and 5-fold cross-validation . . . . . . . . . . . . . . . .. 85. 4.16 Results for SVM and DOB-SCV with 5 folds . . . . . . . . . . . . . . .. 86. 5.1. Arrangements for texture analysis methods and number of features. . .. 94. 5.2. Number of features. . . . . . . . . . . . . . . . . . . . . . . . . . . . . .. 96. 5.3. Mean test classification accuracy (%), VOPTICAL I1 dataset. . . . . . .. 97. 5.4. Robustness: mean test accuracy (%), VOPTICAL IS dataset. . . . . . .. 97. 5.5. Feature extraction time (s). . . . . . . . . . . . . . . . . . . . . . . . . .. 98. 5.6. TOPSIS values obtained for every method when w = [1/3, 1/3, 1/3] . . . 100. 5.7. TOPSIS values obtained for every method when w = [1/2, 1/2, 0] . . . . 102. 5.8. Co-occurrence features selected by CFS . . . . . . . . . . . . . . . . . . 102. 5.9. Performance measures for the concatenation of all methods with CFS . 103. 5.10 K-complex classification results without feature selection . . . . . . . . . 108 5.11 K-complex classification accuracy results with feature selection . . . . . 109 5.12 K-complex classification false positive results with feature selection . . . 109 5.13 K-complex classification sensitivity results with feature selection . . . . 110 5.14 Ten best results obtained from TOPSIS method. . . . . . . . . . . . . . 111 5.15 False positive rate (%) for different sensitivity levels in the test set. . . . 112 6.1. Features selected by each feature selection method along with the required time for classification datasets. . . . . . . . . . . . . . . . . . . . 121. 6.2. Performance measures for classification datasets Connect-4 and Forest. . 122. 6.3. Performance measures for classification datasets KDD Cup 99 and MNIST.123. 6.4. Features selected by each feature selection method along with the required time for regression datasets . . . . . . . . . . . . . . . . . . . . . 124. 6.5. Performance measures for regression datasets Forest and Friedman.. 6.6. Performance measures for regression tasks Lorenz and MNIST. . . . . . 126. 6.7. Average of Score for each filter on each dataset for classification tasks along with the average time required by the filters. . . . . . . . . . . . . 128. 6.8. Average of Score for each filter on each dataset for regression tasks along with the average time required by the filters. . . . . . . . . . . . . . . . 130. 6.9. Summary of the synthetic datasets used . . . . . . . . . . . . . . . . . . 133. . . 125. 6.10 Precision, stability and time measures for ranker filters on classical datasets140 6.11 Precision, stability and time measures for subset filters on classical datasets141 6.12 Overview of the behavior regarding scalability of filter methods. . . . . . 144 6.13 Precision, stability and time measures for ranker filters on SD datasets . 145 6.14 Precision, stability and time measures for subset filters on SD datasets . 146 xx.
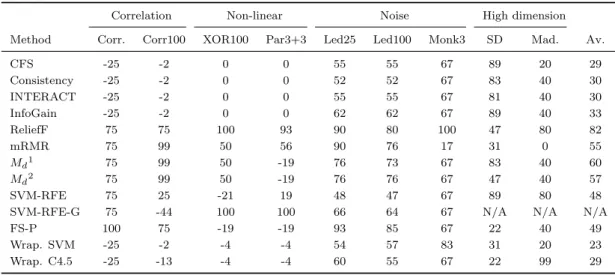
(27) 6.15 Overview of the behavior regarding scalability of filters on SD datasets.. 146. 6.16 Precision, stability and time measures for wrappers on classical datasets 147 6.17 Overview of the behavior regarding scalability of wrappers. . . . . . . . 149 6.18 Precision, stability and time measures for embedded methods on Corral dataset . . . . . . . . . . . . . . . . . . . . . . . . . . . . . . . . . . . . . 150 6.19 Precision, stability and time measures for FS-P on classical datasets . . 151 6.20 Precision, stability and time measures for FS-P on SD datasets . . . . . 151 6.21 Overview of the behavior regarding scalability of embedded methods . . 152 6.22 Comparative of the scalability properties of filters, embedded and wrappers152 7.1. Percentages of distribution of normal activities and different kinds of attacks in the KDD Cup 99 . . . . . . . . . . . . . . . . . . . . . . . . . 164. 7.2. Unbalanced continuous attributes of KDD Cup 99 dataset . . . . . . . . 164. 7.3. Percentages of distribution of normal activities and attacks in the KDD Cup 99 training and test datasets for the binary case . . . . . . . . . . . 165. 7.4. Results obtained in the binary case over the test set by other authors (in %). . . . . . . . . . . . . . . . . . . . . . . . . . . . . . . . . . . . . . 166. 7.5. Results obtained in the binary case over the test set (in %). . . . . . . . 167. 7.6. Comparison of the results (in %) obtained in the binary case with several classifiers over the test set. . . . . . . . . . . . . . . . . . . . . . . . . . . 168. 7.7. Cost matrix used in KDD Cup 99 competition . . . . . . . . . . . . . . 172. 7.8. Best test results obtained with the multiple class algorithms . . . . . . . 172. 7.9. Best results obtained over the test dataset. Comparison with other authors.174. 7.10 Unbalanced attributes of GMC, CNS and Prostate datasets . . . . . . . 176 7.11 Best results for each binary data set. . . . . . . . . . . . . . . . . . . . . 177 7.12 Best results for each multiclass data set. . . . . . . . . . . . . . . . . . . 178 7.13 Summary of Table 7.11 . . . . . . . . . . . . . . . . . . . . . . . . . . . . 179 7.14 Comparison with Ruiz et al. . . . . . . . . . . . . . . . . . . . . . . . . . 181 7.15 Comparison with Alonso-González et al. . . . . . . . . . . . . . . . . . . 183 7.16 Best results on microarray datasets. . . . . . . . . . . . . . . . . . . . . 185 7.17 Ranking of test errors for each method in the comparative study. . . . . 186 7.18 Ranking of sensitivity rates for each method in the comparative study. . 187 7.19 Ranking of specificity rates for each method in the comparative study. . 187 7.20 Best results for each data set. . . . . . . . . . . . . . . . . . . . . . . . . 193 7.21 Results in accuracy obtained for Factor data set . . . . . . . . . . . . . 194 7.22 Best and average accuracy obtained for multiclass and both multiple binary classes approaches for the Dermatology and Karhounen datasets. 194 7.23 Number of times a combination gets the best results . . . . . . . . . . . 195 xxi.
(28) 8.1. Score for every feature selection method tested . . . . . . . . . . . . . . 202. 8.2. Stability of the filters selected. . . . . . . . . . . . . . . . . . . . . . . . 208. 8.3. Results over the synthetic dataset Led100 . . . . . . . . . . . . . . . . . 209. 8.4. Test classification error after 10 fold cross-validation for classical datasets 211. 8.5. Average of test error for classical datasets focusing on the dataset . . . . 212. 8.6. Average of test error for classical datasets focusing on the classifier.. 8.7. Test classification error for microarray datasets . . . . . . . . . . . . . . 214. 8.8. Average of test error . . . . . . . . . . . . . . . . . . . . . . . . . . . . . 215. 8.9. Average of test error after applying SMOTE for datasets Colon, CNS, Leukemia and Ovarian. . . . . . . . . . . . . . . . . . . . . . . . . . . . 215. 9.1. Random cost for the features of Magic04 dataset. . . . . . . . . . . . . . 228. 9.2. Cost of the features for Pima dataset (normalized to 1). . . . . . . . . . 230. 9.3. Mean classification error(%), time (milliseconds), and number of features in the union of the 10 folds for the Pareto front points . . . . . . . . . . 237. . . 212. 10.1 Number of packets (s) for the datasets used with the horizontal partition 244 10.2 Number of features selected by the centralized approach . . . . . . . . . 246 10.3 Number of features selected by the distributed approach . . . . . . . . . 246 10.4 Test classification accuracy for horizontal partitioning. . . . . . . . . . . 248 10.5 Runtime (hh:mm:ss) for the feature selection methods tested . . . . . . 249 10.6 Runtime (hh:mm:ss) for obtaining the threshold of votes. . . . . . . . . 250 10.7 Number of features selected by the centralized approach . . . . . . . . . 253 10.8 Number of features selected by the distributed approach . . . . . . . . . 253 10.9 Test classification accuracy for the first approach of vertical partitioning. 255 10.10Runtime (hh:mm:ss) for the feature selection methods tested. . . . . . . 256 10.11Runtime (hh:mm:ss) for obtaining the threshold of votes. . . . . . . . . 256 10.12Number of features selected by the centralized approach . . . . . . . . . 263 10.13Number of features selected by the distributed approaches with C4.5 and naive Bayes classifiers . . . . . . . . . . . . . . . . . . . . . . . . . . . . 264 10.14Number of features selected by the distributed approaches with k-NN and SVM classifiers . . . . . . . . . . . . . . . . . . . . . . . . . . . . . . 265 10.15Test classification accuracy of C4.5 . . . . . . . . . . . . . . . . . . . . . 267 10.16Test classification accuracy of naive Bayes . . . . . . . . . . . . . . . . . 268 10.17Test classification accuracy of k-NN . . . . . . . . . . . . . . . . . . . . 269 10.18Test classification accuracy of SVM . . . . . . . . . . . . . . . . . . . . . 270 10.19Runtime (in seconds) for the feature selection methods tested. . . . . . . 271 10.20Training time (s). . . . . . . . . . . . . . . . . . . . . . . . . . . . . . . . 279 xxii.
(29) 10.21Test accuracy (%). . . . . . . . . . . . . . . . . . . . . . . . . . . . . . . 280 I.1 I.2 I.3 I.4 I.5 I.6 I.7 I.8 I.9. Summary of the synthetic datasets used . . . . . . . . . . . . . . . . . . 291 Dataset description for binary classic datasets . . . . . . . . . . . . . . . 295 Dataset description for binary classic datasets with train and test sets . 296 Dataset description for multiclass classic datasets . . . . . . . . . . . . . 296 Dataset description for multiclass classic datasets with train and test sets 297 Dataset description for datasets used in regression tasks . . . . . . . . . 297 Dataset description for binary microarray datasets . . . . . . . . . . . . 298 Dataset description for binary microarray datasets with train and test sets299 Dataset description for multiple class datasets. . . . . . . . . . . . . . . 299. xxiii.
(30) xxiv.
(31) List of algorithms 8.1 8.2. Pseudo-code for Ensemble1 . . . . . . . . . . . . . . . . . . . . . . . . . . 204 Pseudo-code for Ensemble2 . . . . . . . . . . . . . . . . . . . . . . . . . . 205. 9.1. Pseudo-code of ReliefF algorithm. . . . . . . . . . . . . . . . . . . . . . . 225. 10.1 Pseudo-code for horizontal partitioning . . . . . . . . . . . . . . . . . . . 243 10.2 Pseudo-code for vertical partitioning . . . . . . . . . . . . . . . . . . . . . 251 10.3 Pseudo-code for vertical partitioning for DNA microarray data . . . . . . 259. xxv.
(32) xxvi.
(33) CHAPTER. 1. Introduction. The advent of high dimensional data has brought unprecedented challenges to machine learning researchers, making the learning task more complex and computationally demanding. The term high dimensionality is applied to a database that presents one of the following characteristics: (a) the number of samples is very high; (b) the number of features is very high; or (c) both the number of samples and features are very high. There exists in the literature some controversy about the term high-dimensionality, since some authors claim that it only refers to the feature space whereas others use it indistinctly for both features and samples. In this thesis the latter alternative will be adopted and a dataset will be considered of very high dimensionality when having more than 10000 data (where data means features x samples) according to Z. A. Zhao and Liu (2011). When dealing with high-dimensional data, learning algorithms can degenerate their performance due to overfitting, learned models decrease their interpretability as they are more complex, and finally speed and efficiency of the algorithms decline in accordance with size. Machine learning can take advantage of feature selection methods to be able to reduce the dimensionality of a given problem. Feature selection is the process of detecting the relevant features and discarding the irrelevant and redundant ones, with the goal of obtaining a small subset of features that describes properly the given problem with a minimum degradation or even improvement in performance (Guyon, 2006). Feature selection, as it is an important activity in data preprocessing, has been an active research area in the last decade, finding success in many different real world applications, especially those related with classification problems. This thesis is devoted to feature selection research and its application to high dimensional data. The work presented herein flows from general principles to proposing novel methods. First, a critical analysis of existing feature selection methods is performed, to check their adequacy toward different challenges and to be able to provide some recommendations to the users. Bearing this analysis in mind, the most adequate 1.
(34) Chapter 1. Introduction. techniques are applied to several real-life problems, obtaining a notable improvement in performance. Apart from efficiency, another critical issue in large-scale applications is scalability. The effectiveness of feature selection methods may be significantly downgraded, if not totally inapplicable, when the data size increases steadily. For this reason, scalability in feature selection is analyzed. Then, new techniques for large-scale feature selection are proposed. In the first place, as most of the existing feature selection techniques need data to be discrete, a new approach is proposed that consists of a combination of a discretizer, a filter method and a very simple classical classifier, obtaining promising results. Another proposal is to employ a ensemble of filters instead of a single one, releasing the user from the decision of which technique is the most appropriate for a given problem. An interesting topic is also to consider the cost related with the different features (economic, or associated with memory or time requirements), therefore a framework for cost-based feature selection is proposed, demonstrating its adequacy in a real-life scenario. Finally, it is well-known that a manner of handling large-scale data is to transform the largescale problem into several small-scale problems, by distributing the data. With this aim, several approaches for distributed and parallel feature selection are proposed. Before diving into the specific aspects of each topic, in this introduction a summary of the main goals of the present thesis in each part is given.. 1.1. Analysis of feature selection. Feature selection methods usually come in three flavors: filter, wrapper, and embedded methods (Guyon, 2006). The filter model relies on the general characteristics of training data and carries out the feature selection process as a pre-processing step with independence of the induction algorithm. On the contrary, wrappers involve optimizing a predictor as a part of the selection process. Halfway these two models one can find embedded methods, which perform feature selection in the process of training and are usually specific to given learning machines. There exists a vast body of feature selection methods in the literature, including filters based on distinct metrics (e.g. entropy, probability distributions or information theory) and embedded and wrappers methods using different induction algorithms. The proliferation of feature selection algorithms, however, has not brought about a general 2.
(35) 1.2. Novel feature selection methods. methodology that allows for intelligent selection from existing algorithms. In order to make a correct choice, a user not only needs to know the domain well, but also is expected to understand technical details of available algorithms. On top of this, most algorithms were developed when dataset sizes were much smaller, but nowadays distinct compromises are required for the case of small-scale and large-scale (big data) learning problems. Small-scale learning problems are subject to the usual approximationestimation trade-off. In the case of large-scale learning problems, the trade-off is more complex because it involves not only the accuracy of the selection but also other aspects, such as stability (i.e. the sensitivity of the results to training set variations) or scalability. The first part of this thesis is devoted to analyzing the state of the art feature selection methods and demonstrating their adequacy on real applications. The main goals of this block of the thesis are the following:. • Critical review of the most popular feature selection methods in the literature by checking their performance in an artificial controlled experimental scenario. In this manner, the ability of the algorithms to select the relevant features and to discard the irrelevant ones without permitting noise or redundancy to obstruct this process is evaluated. • Analysis of the behavior of feature selection in a very challenging field: DNA microarray classification. DNA microarray data is a hard challenge for machine learning researchers due to the high number of features (around 10 000) but small sample size (typically one hundred or less). For this purpose, it is necessary to review the most up-to-date algorithms developed ad-hoc for this type of data, as well as studying their particularities. • Application of classic feature selection to real problems in order to check their adequacy. Specifically, testing the effectiveness of feature selection in two problems from the medical domain: tear film lipid layer classification and K-complex identification in sleep apnea. • Analysis of the issue of scalability in feature selection. With the advent of high dimensionality, machine learning researchers are not focused only in accuracy, but also in the scalability of the solution. Therefore, this issue must be addressed. First, the influence of feature selection to scaling up machine learning algorithms is tested. Then, a study in detail of the scalability of feature selection methods is also necessary. 3.
(36) Chapter 1. Introduction. 1.2. Novel feature selection methods. The second part of the thesis is devoted to developing novel feature selection capable of being applied to high dimensional datasets. Although the benefits of the feature selection process have been extensively proved, most researchers agree that there is not a so-called “best method” and their efforts are focused on finding a good method for a specific problem setting. For this reason, new feature selection methods are constantly emerging using different strategies. In fact, the current tendency in feature selection is not toward developing new algorithmic measures, but toward favoring the combination or modification of existing algorithms. Therefore, the objective of this part of the thesis is focused in exploring different strategies to deal with the new problematics which have emerged derived from the big data explosion. Our first proposal is related with preprocessing techniques, so a discretization stage was introduced prior to feature selection trying to improve the performance of the induction methods. Another interesting and popular line of research in classification is ensemble learning, based on the assumption that a set of experts is better than a single expert, so inspired on this idea an ensemble of filters and classifiers is proposed. It is also interesting to consider cases in which features have their own risk or cost, since this factor must be taken into account as well as the accuracy. For this reason, feature selection methods which tackle cost are also proposed. Finally, a recent topic of interest has arisen which consists of distributing the feature selection process, trying to improve accuracy whilst reducing the training time. Some proposals are presented in this thesis aiming at covering this issue. To sum up, the main goals of the second part of this thesis are the following:. • Development of a new framework which consists of combining discretization and filter methods. This framework is successfully applied to intrusion detection and microarray data classification. • Development of a novel method for dealing with high-dimensional data: an ensemble of filters and classifiers. The idea of this ensemble is to apply several filters based on different metrics and then joining the results obtained after training a classifier with the selected subset of features. In this manner, the user is released from the task of choosing an adequate filter for each dataset.. 4.
(37) 1.3. Overview of this thesis. • Proposal for a new framework for cost-based feature selection. In this manner, the scope of feature selection is broaden by taking into consideration not only the relevance of the features but also their associated costs. The proposed framework consists of adding a new term to the evaluation function of a filter method so that the cost is taken into account. • Distributed and parallel feature selection. There are two common types of data distribution: (a) horizontal distribution wherein data are distributed in subsets of instances; and (b) vertical distribution wherein data are distributed in subsets of attributes. Both approaches are tested, employing for this sake filter and wrapper methods. Since in some cases the partitioning of the datasets can introduce some redundancy among features, new partitioning schemes are being investigated, for example by dividing the features according to some goodness measure.. 1.3. Overview of this thesis. This chapter has introduced the main topics to be presented in this work. Figure 1.1 depicts the organization of the thesis. Part I is covered by chapters 2 - 6. Chapter 2 presents the foundations of feature selection, as well as a description of the feature selection methods which will be employed in this thesis. Then, Chapter 3 reviews the most popular methods in the literature and checks their performance in an artificial controlled scenario, proposing some guidelines about their appropriateness in different domains. Chapter 4 analyzes the up-to-date contributions of feature selection research applied to the field of DNA microarray classification, whereas Chapter 5 is devoted to proving the benefits of feature selection in other real applications such as classification of the tear film lipid layer and K-complex classification. Chapter 6 closes Part I by studying the scalability of existing feature selection methods. Part II is covered by chapters 7 - 10. Chapter 7 presents a method which consists of a combination of discretizers, filters and classifiers. The proposed method is applied over an intrusion detection benchmark dataset, as well as other challenging scenarios such as DNA microarray data. Chapter 8 introduces an ensemble of filters to be applied to different scenarios. The idea builds on the assumption that an ensemble of filters is better than a single method, since it is possible to take advantage of their individual strengths and overcome their weak points at the same time. Chapter 9 proposes a new framework for cost-based feature selection. The objective is to solve 5.
(38) Chapter 1. Introduction. Figure 1.1: Organization of the thesis. problems in which it is interesting not only to minimize the classification error, but also to reduce costs that may be associated to input features. Chapter 10 presents some approaches for distributed and parallel feature selection, splitting the data both vertically and horizontally. Finally, Chapter 11 summarizes the main conclusions and contributions of this thesis. Notice that Appendix I presents the materials and methods used throughout this thesis and Appendix II reports the author’s key publications and mentions.. 6.
(39) PART. I. Analysis of feature selection. 7.
(40) 8.
(41) CHAPTER. 2. Foundations of feature selection. In the last years, several datasets with high dimensionality have become publicly available on the Internet. This fact has brought an interesting challenge to the research community, since for the machine learning methods it is difficult to deal with a high number of input features. To confront the problem of the high number of input features, dimensionality reduction techniques can be applied to reduce the dimensionality of the original data and improve learning performance. These dimensionality reduction techniques usually come in two flavors: feature selection and feature extraction. Feature selection and feature extraction each have their own merits (Z. A. Zhao & Liu, 2011). On the one hand, feature extraction techniques achieve dimensionality reduction by combining the original features. In this manner, they are able to generate a set of new features, which is usually more compact and of stronger discriminating power. It is preferable in applications such as image analysis, signal processing, and information retrieval, where model accuracy is more important than model interpretability. On the other hand, feature selection achieves dimensionality reduction by removing the irrelevant and redundant features. It is widely used in data mining applications, such as text mining, genetics analysis, and sensor data processing. Due to the fact that feature selection maintains the original features, it is especially useful for applications where the original features are important for model interpreting and knowledge extraction. This chapter will present the foundations of feature selection, as well as a description of the feature selection methods which will be employed in this thesis.. 2.1. Feature selection. Feature selection can be defined as the process of detecting the relevant features and discarding the irrelevant and redundant ones with the goal of obtaining a subset of 9.
(42) Chapter 2. Foundations of feature selection. features that describes properly the given problem with a minimum degradation of performance. It has several advantages (Guyon, 2006), such as:. • Improving the performance of the machine learning algorithms. • Data understanding, gaining knowledge about the process and perhaps helping to visualize it. • General data reduction, limiting storage requirements and perhaps helping in reducing costs. • Feature set reduction, saving resources in the next round of data collection or during utilization. • Simplicity, possibility of using simpler models and gaining speed.. 2.1.1. Feature relevance. Intuitively, it can be determined that a feature is relevant if it contains some information about the target. More formally, Kohavi & John classified features into three disjoint categories, namely, strongly relevant, weakly relevant, and irrelevant features (Kohavi & John, 1997). In their approach, the relevance of a feature X is defined in terms of an ideal Bayes classifier. A feature X is considered to be strongly relevant when the removal of X results in a deterioration of the prediction accuracy of the ideal Bayes classifier. A feature X is said to be weakly relevant if it is not strongly relevant and there exists a subset of features S, such that the performance of the ideal Bayes classifier on S is worse than the performance on S ∪ {X}. A feature is defined as irrelevant if it is neither strongly nor weakly relevant.. 2.1.2. Feature redundancy. A feature is usually considered as redundant in terms of feature correlation (Yu & Liu, 2004a). It is widely accepted that two features are redundant to each other if their values are completely correlated, but it might not be so easy to determine feature redundancy when a feature is correlated with a set of features. According to Yu and Liu (2004a), a feature is redundant and hence should be removed if it is weakly relevant and 10.
(43) 2.2. Feature selection methods. has a Markov blanket (Koller & Sahami, 1995) within the current set of features. Since irrelevant features should be removed anyway, they are excluded from this definition of redundant features.. Figure 2.1: Overview of feature relevance and redundancy Figure 2.1 visualizes an overview of the relationship between feature relevance and redundancy. The entire feature set can be conceptually divided into four basic disjoint parts: irrelevant features (I), weakly relevant and redundant features (II), weakly relevant but non-redundant features (III) and strongly relevant features (IV) (Yu & Liu, 2004a). Notice that the optimal subset would cointain all the features in parts III and IV.. 2.2. Feature selection methods. Feature selection methods can be divided according to two approaches: individual evaluation and subset evaluation (Yu & Liu, 2004a). Individual evaluation is also known as feature ranking and assesses individual features by assigning them weights according to their degrees of relevance. On the other hand, subset evaluation produces candidate feature subsets based on a certain search strategy. Each candidate subset is evaluated by a certain evaluation measure and compared with the previous best one with respect to this measure. While the individual evaluation is incapable of removing redundant features because redundant features are likely to have similar rankings, the subset evaluation approach can handle feature redundancy with feature relevance. However, methods in this framework can suffer from an inevitable problem caused by searching through all feature subsets required in the subset generation step, and thus, both approaches are worth it to be studied. 11.
(44) Chapter 2. Foundations of feature selection. Aside from this classification, three major approaches can be distinguished based upon the relationship between a feature selection algorithm and the inductive learning method used to infer a model (Guyon, 2006):. • Filters, which rely on the general characteristics of training data and carry out the feature selection process as a pre-processing step with independence of the induction algorithm. This model is advantageous for its low computational cost and good generalization ability. • Wrappers, which involve a learning algorithm as a black box and consists of using its prediction performance to assess the relative usefulness of subsets of variables. In other words, the feature selection algorithm uses the learning method as a subroutine with the computational burden that comes from calling the learning algorithm to evaluate each subset of features. However, this iteration with the classifier tends to give better performance results than filters. • Embedded methods, which perform feature selection in the process of training and are usually specific to given learning machines. Therefore, the search for an optimal subset of features is built into the classifier construction and can be seen as a search in the combined space of feature subsets and hypotheses. This approach is able to capture dependencies at a lower computational cost than wrappers.. Table 2.1 provides a summary of the characteristics of the three feature selection methods, indicating the most prominent advantages and disadvantages. Considering that there exist several algorithms for each one of the previously commented approaches, there is a vast body of feature selection methods. Most researchers agree that “the best method” simply does not exist and their efforts are focused on finding an good method for a specific problem setting. In that sense, different methods have been developed to deal with large scale datasets where the importance of feature selection is beyond doubt, since it is essential to minimize training time and allocated memory while maintaining accuracy. Nevertheless, it is important to bear in mind that most feature selection methods use the performance of the learned model as part of the selection process. In fact, from the three categories shown above (filters, wrappers and embedded), only filters are algorithm-independent. This property makes filters computationally simple and fast, being able to handle extremely large-scale datasets. However, most filters are univariate, i.e. they consider each feature independently of 12.
(45) 2.2. Feature selection methods. Table 2.1: Feature selection techniques.. Method. Advantages. Disadvantages. Independence of the classifier Lower computational cost than wrappers Fast Good generalization ability. No interaction with the classifier. Interaction with the classifier Lower computational cost than wrappers Captures feature dependencies. Classifier-dependent selection. Interaction with the classifier Captures feature dependencies. Computationally expensive Risk of overfitting Classifier-dependent selection. Filter. Embedded. Wrapper. other features, a drawback that can be overcome by multivariate techniques which usually demand more computational resources.. 2.2.1. Filter methods. Filter methods are based on performance evaluation metric calculated directly from the data, without direct feedback from predictors that will finally be used on data with reduced number of features (Guyon, 2006). As mentioned above, these algorithms are usually computationally less expensive than wrappers or embedded methods. In this subsection, the most popular filters are described, which will be used throughout this thesis. 13.
(46) Chapter 2. Foundations of feature selection. 2.2.1.1. Chi-squared. This is an univariate filter based on the χ2 statistic (Liu & Setiono, 1995) and which evaluates each feature independently with respect to the classes. The higher the value of chi-squared, the more relevant is the feature with respect to the class.. 2.2.1.2. Information Gain. The Information Gain filter (Quinlan, 1986) is one of the most common univariate methods of evaluation attributes. This filter evaluates the features according to their information gain and considers a single feature at a time. It provides an orderly classification of all the features, and then a threshold is required to select a certain number of them according to the order obtained.. 2.2.1.3. Correlation-based Feature Selection, CFS. This is a simple multivariate filter algorithm that ranks feature subsets according to a correlation based heuristic evaluation function (M. A. Hall, 1999).The bias of the evaluation function is toward subsets that contain features that are highly correlated with the class and uncorrelated with each other. Irrelevant features should be ignored because they will have low correlation with the class. Redundant features should be screened out as they will be highly correlated with one or more of the remaining features. The acceptance of a feature will depend on the extent to which it predicts classes in areas of the instance space not already predicted by other features.. 2.2.1.4. Consistency-based Filter. The filter based on consistency (Dash & Liu, 2003) evaluates the worth of a subset of features by the level of consistency in the class values when the training instances are projected onto the subset of attributes. From the space of features, the algorithm generates a random subset S in each iteration. If S contains fewer features than the current best subset, the inconsistency index of the data described by S is compared with the index of inconsistency in the best subset. If S is as consistent or more than 14.
(47) 2.2. Feature selection methods. the best subset, S becomes the best subset. The criterion of inconsistency, which is the key to success of this algorithm, specify how large can be the reduction of dimension in the data. If the rate of consistency of the data described by selected characteristics is smaller than a set threshold, it means that the reduction in size is acceptable. Notice that this method is multivariate.. 2.2.1.5. Fast Correlation-Based Filter, FCBF. The fast correlated-based filter method (Yu & Liu, 2003) is a multivariate algorithm that measures feature-class and feature-feature correlation. FCBF starts by selecting a set of features that is highly correlated with the class based on symmetrical uncertainty (SU), which is defined as the ratio between the information gain and the entropy of two features. Then, it applies three heuristics that remove the redundant features and keep the features that are more relevant to the class. FCBF was designed for highdimensionality data and has been shown to be effective in removing both irrelevant and redundant features. However, it fails to take into consideration the interaction between features.. 2.2.1.6. INTERACT. The INTERACT algorithm (Z. Zhao & Liu, 2007) uses the same goodness measure as FCBF filter, i.e. SU, but it also includes the consistency contribution, which is an indicator about how significantly the elimination of a feature will affect consistency. The algorithm consists of two major parts. In the first part, the features are ranked in descending order based on their SU values. In the second part, features are evaluated one by one starting from the end of the ranked feature list. If the consistency contribution of a feature is less than an established threshold, the feature is removed, otherwise it is selected. The authors stated that this method can handle feature interaction, and efficiently selects relevant features.. 2.2.1.7. ReliefF. The filter ReliefF (Kononenko, 1994) is an extension of the original Relief algorithm (Kira & Rendell, 1992). The original Relief works by randomly sampling an instance 15.
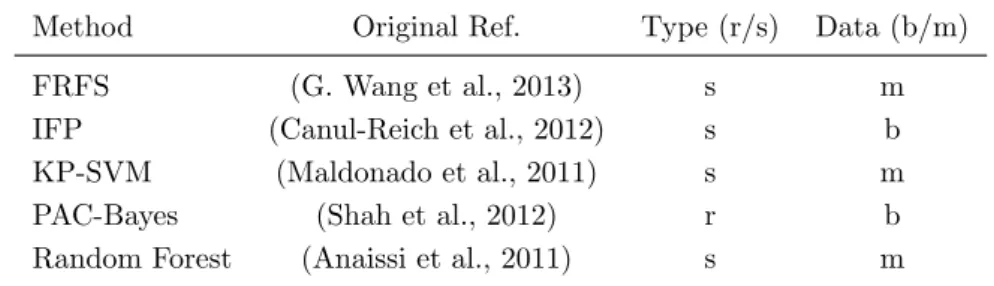
(48) Chapter 2. Foundations of feature selection. from the data and then locating its nearest neighbor from the same and opposite class. The values of the attributes of the nearest neighbors are compared to the sampled instance and used to update relevance scores for each attribute. The rationale is that a useful attribute should differentiate between instances from different classes and have the same value for instances from the same class. ReliefF adds the ability of dealing with multiclass problems and is also more robust and capable of dealing with incomplete and noisy data. This method may be applied in all situations, has low bias, includes interaction among features and may capture local dependencies which other methods miss.. 2.2.1.8. minimum Redundancy Maximum Relevance, mRMR. The mRMR method (H. Peng, Long, & Ding, 2005) selects features that have the highest relevance with the target class and are also minimally redundant, i.e., selects features that are maximally dissimilar to each other. Both optimization criteria (MaximumRelevance and Minimum-Redundancy) are based on mutual information.. 2.2.1.9. Md. The Md filter (Seth & Principe, 2010) is an extension of mRMR which uses a measure of monotone dependence (instead of mutual information) to assess relevance and irrelevance. One of its contributions is the inclusion of a free parameter (λ) that controls the relative emphasis given on relevance and redundancy. In this thesis, two values of lambda will be tested: 0 and 1. When λ is equal to zero, the effect of the redundancy disappears and the measure is based only on maximizing the relevance. On the other hand, when λ is equal to one, it is more important to minimize the redundancy among variables. These two values of λ were chosen in this thesis because we are interested in checking the performance of the method when the effect of the redundancy disappears. Also, Seth and Principe (2010) stated that λ = 1 performs better than other λ values. Table 2.2 reports the main characteristics of the filters employed in this thesis. With regard to the computational cost, it can be noticed that some of the proposed filter techniques are univariate. This means that each feature is considered separately, thereby ignoring feature dependencies, which may lead to worse classification performance when compared to other types of feature selection techniques. However, they 16.
Figure
+7

Documento similar
- Distributed multi-label selection methods for continuous features: Proposing the implementation of two distributed feature selection methods on continuous features for
In chapter 4 we will justify that Recursive Maxima Hunting finds the points that appear in the Bayes rule when the mean of the second class is piecewise linear and the noise
Due to the the low amount of avail- able training data in a signature real case, Sequential For- ward Feature Selection (SFFS) algorithm [13] is performed in order to obtain a subset
El acceso a la versión del editor puede requerir la suscripción del recurso Access to the published version may
Probability for a track of certain genre to be selected as suited for a POI We can thus confirm that for certain genres, in addition to the semantic matching between
No obstante, como esta enfermedad afecta a cada persona de manera diferente, no todas las opciones de cuidado y tratamiento pueden ser apropiadas para cada individuo.. La forma
Figure 1: Steps of TTrees (using multiple ML techniques): beginning with data preparation, proportional discretization, training of knowledge tree, selection of the most
This conception forces the design process on the fundamental problem of the identity of each architecture: what a character/architecture is, what is its role in the whole scene/city
