TítuloChondrogenic potential of subpopulations of cells expressing mesenchymal stem cell markers derived from human synovial membranes
16
0
0
Texto completo
(2) and CD271. We have also found that the CD105 subpopulation of MSCs from both normal and OA human synovial membranes was capable of differentiation toward chondrocyte-like cells [Arufe et al., 2009]. The presence of these markers in MSCs from human synovial membranes has led to speculation about their role in the chondrogenic potential of the MSC population. From the described MSC markers, we selected CD73, CD106, and CD271 for examination because previous studies have already been performed on their role in differentiation of various cell types [Jo et al., 2007; Zannettino et al., 2008; Alexander et al., 2009], although no previous study has focused on their chondrogenesis potential. CD73 is expressed on subsets of T and B lymphocytes, follicular dendritic, epithelial and endothelial cells. This protein has enzymatic activity and catalyzes the dephosphorylation of adenosine monophosphate (AMP) to adenosine, suggesting that CD73 mediates co-stimulatory signals in T cell activation and adhesion of lymphocytes to the endothelium [Majore et al., 2009a]. The vascular cell adhesion molecule (VCAM), also called CD106, is expressed on activated endothelial cells and some tissue macrophages, bone marrow fibroblasts and myoblasts. This protein is involved in the transmigration and invasion mechanisms of MSCs [Koga et al., 2008; Steingen et al., 2008; Liu et al., 2008]. CD271 is also known as nerve growth factor receptor (NGF) and is a neutrophin believed to bind to its cognate receptor on the terminal of sympathetic neurons. It regulates their level of target innervation through two mechanisms. First, CD271 stimulates the terminal growth of sympathetic neurons, thereby regulating the level of target innervation. Second, CD271, in conjugation with other neutrophins, serves as a discriminator allowing elimination of neurons that have failed to sequester adequate target space [Jarocha et al., 2008]. Based on these data, our aim was to characterize the CD73+, CD106+, and CD271+ subpopulations of MSCs derived from human synovial membranes and to assess their chondrogenic capability. Materials and Methods Tissue Collection Normal synovial membranes were obtained from patients undergoing knee amputation who had no history of joint disease. All tissues were collected after fully informed consent and ethical approval from the supervisor of the CEIC of Galicia (Ethical Committee of Galicia). Twelve patients contributed samples to this study. Isolation and Culture of MSCs Synovial membranes from intact areas of clinically normal joints were harvested and subjected to sequential digestion using 1.2 U/ml dispase and 112 U/ml type I collagenase to isolate MSCs, as previously described [Kawaguchi et al., 2005; Arufe et al., 2009]. Briefly, monolayer cultures of MSCs from synovial membranes were cultured in Dulbecco's Modified Eagles Medium (DMEM) with 15% fetal bovine serum (FBS), 1% penicillin, and 1% streptomycin (all from Sigma–Aldrich, St. Louis, MO). When the cells achieved 90% confluency, they were separated into CD73+, CD106+, and CD271+ subpopulations using a FACS Aria cytometry sorter (BD Bioscience, Madrid, Spain) and anti-human CD73 (BD Bioscience), CD106 (Serotec, BioNova Centífica, S.L., Madrid, Spain), and CD271 (Sigma– Aldrich) antibodies at 10 µl of antibody per 1 × 10⁶ cells in 200 µl of phosphate-buffered saline (PBS). After sorting, some cells were seeded into chamber slices and cultured for 24 h in the DMEM, 15% FBS, 1% penicillin, and 1% streptomycin medium for use in performing immunofluorescence (IF) analysis for the MSC markers, CD44, CD69, CD73, CD90, and CD105, using the same protocol described for fluorescence-activated cell sorting (FACS) analysis. Fluorescence-Activated Cell Sorting (FACS) Analysis Cells were fixed in 4% paraformaldehyde in PBS. Following fixation, the cells were washed twice with PBS, permeabilized with PBS containing 0.1% Triton X-100 for 10 min and rinse twice with PBS. The primary antibodies used were phycoerythrin (PE)-labeled mouse anti-human CD34 (1:20; DakoCytomation, S.A., Barcelone, Spain); fluorescein (FITC)-labeled mouse anti-rat CD45 (1:20, Serotec, BioNova Centífica, S.L.); FITC-labeled mouse anti-human CD105 (1:100, Serotec); PE-Cy5 mouse anti-human CD106 (1:20, Serotec); PE-Cy5-conjugated mouse anti-human CD90 (1:20, BD Pharmigen); mouse anti-human Ki67 (1:20, Santa Cruz Biotechnology, Inc., Lorenzo e Hijos, A Coruña, Spain); mouse anti-CD271 (1:20, Sigma–Aldrich); mouse anti-human CD117 (1:20, Serotec); PEconjugated anti-human CD73 (1:20, BD Bioscience); and PE-conjugated mouse anti-human CD166 (1:20, BD Bioscience). For detection of primary antibodies not directly labeled, cells were washed with.
(3) PBS, then incubated with 1:1,000 polyclonal rabbit anti-mouse IgD/PE Rabbit F(ab')2 (DakoCytomation) for 30 min at room temperature. The stained cells were washed twice with PBS and 10 × 105 cells were analyzed on a FACS Aria flow cytometer (BD Bioscience, Mountain View, CA). FACS data were generated using DIVA software (BD Bioscience). Negative control staining was performed using FITCconjugated mouse IgG1k isotype, PE-conjugated mouse IgG1k isotype, and PE-Cy5-conjugated mouse IgG1k isotype (all from BD Bioscience). Chondrogenic Differentiation CD73+, CD106+, and CD271+ subpopulations were cultured in DMEM, 15% FBS, 1% penicillin, 1% streptomycin, and 1.5 × 10⁻⁴ M monothioglycerol (MTG) until 90% confluent. Cells were then seeded in 96-well plates (Sarstedt, Inc., Barcelone, Spain) at 2 × 10⁴ cells per well in a different culture medium (DMEM, 15% FBS, 1% penicillin, 1% streptomycin, 1.5 × 10⁻⁴ M of MTG, 5 mg/ml ascorbic acid (AA), 6 µg/ml transferrin (TRANS) (all from Sigma–Aldrich)). The cells were cultured for 2 days to allow spontaneous spheroid formation; the medium was again changed to differentiate the cells. The cells were cultured for 14, 28, or 46 days in a chondrogenic medium [DMEM, with 15% knockout serum (Gibco, Invitrogen, Barcelone, Spain), 5 mg/ml AA, 6 µg/ml TRANS, 10 µM dexamethasone (DEX), 1 × 10⁻⁷ M retinoic acid, and 1 ng/ml recombinant human transforming growth factor-β3 (rhTGF-β3) (ProSpec-Tany TechnoGene, City, IL)]. The medium was changed every 3 days. Adipogenic and Osteogenic Differentiation CD73+, CD106+, and CD271+ MSC subpopulations from normal synovial membranes were cultured in adipogenic and osteogenic commercial media (Cambrex, Lonza, A Coruña, Spain), following the manufacturer's instructions, to assess the potential of these subpopulations to differentiate toward these mesodermal cell lineages. After 21 days in culture, adipogenic culture plates were fixed in 10 mM sodium periodate, 2% paraformaldehyde, 75 mM L-lysine dihydrochloride, and 37.5 mM sodium phosphate (dibasic), at pH 7.4 (all from Sigma–Aldrich), for 15 min at room temperature. They were then air-dried and stained in a filtered solution of 0.3% oil red O to reveal lipid droplets in the cultures. The osteogenic cultures were stained with alizarin red to reveal calcium deposits after 21 days in culture. After fixation, the cells were covered with alizarin red S solution (2% aqueous solution [pH 4.2]; Sigma–Aldrich) for 3 min. The cultures were then washed thoroughly with distilled water. RNA Extraction and cDNA Synthesis Total RNA was extracted from cultured cells using the Trizol L.S. reagent method (Invitrogen). Reverse transcription (RT) was carried out using the Superscript II system (Invitrogen). Total RNA (2 µg) was reverse transcribed in a 20 µl reaction volume containing Superscript II (200 U), random primers (25 µM), and dNTP (0.5 mM each) at 42°C for 50 min. Real-Time Polymerase Chain Reaction (PCR) Analysis Genes for human SOX9, Nanog, Runx2, and β-actin were used. Details of the primers and specific annealing temperatures used are shown in Table I. The amplification program consisted of an initial denaturation step at 92°C for 2 min followed by 40 cycles at 92°C for 15 s, an annealing step at 55–62°C depending on the gene used, for 30 s, and an extension step at 72°C for 15 s. Each PCR analysis was done in duplicate, with each set of assays repeated three times. To minimize the effects of unequal quantities of starting RNA and to eliminate potential sources of inconsistency, the expression level of each gene was normalized to that of β-actin using the method [Livak and Schmittgen, 2001]. The controls contained no reverse transcriptase..
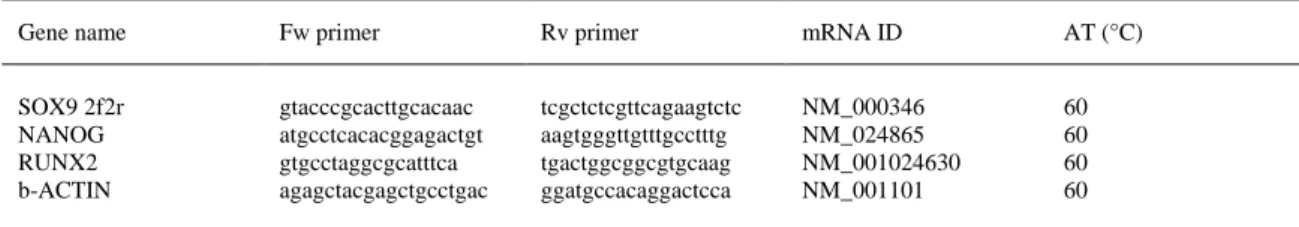
(4) Table I. Specific Primers for Real-Time Reverse Transcriptase-Polymerase Chain Reaction (RT-PCR) Amplification Are Listed With Specific Annealing Temperatures Gene name. Fw primer. Rv primer. mRNA ID. AT (°C). SOX9 2f2r NANOG RUNX2 b-ACTIN. gtacccgcacttgcacaac atgcctcacacggagactgt gtgcctaggcgcatttca agagctacgagctgcctgac. tcgctctcgttcagaagtctc aagtgggttgtttgcctttg tgactggcggcgtgcaag ggatgccacaggactcca. NM_000346 NM_024865 NM_001024630 NM_001101. 60 60 60 60. Fw, forward; Rv, reverse; AT, annealing temperature.. Histological and Immunohistochemical Analysis of Spheroids Following differentiation into chondrocyte-like cells, spheroids containing CD73+, CD106+, or CD271+ MSCs were frozen in OCT embedding matrix (BDH Chemicals, Poole, UK). Full-depth 4 µm sections were cut using a cryostat and fixed in 4% (w/v) paraformaldehyde (Sigma–Aldrich) in PBS at pH 7.6. Some sections were stained with hematoxylin and eosin to evaluate the distribution of matrix or Safranin O (all from Sigma–Aldrich) for proteoglycan. Other sections were immunostained using monoclonal antibodies directed against COL1 (1:1,000), COL2 (1:50), aggrecan C-20 (1:100), COLX (1:2,000), and MMP-13 (1:1,000) (all from Southern Biotechnologies, Birmingham, AL). Biotinylated secondary antibodies were detected using peroxidase-labeled biotin–streptavidin complex (Vectastain Elite kit; Vector Laboratories, Peterborough, UK) with diaminobenzidine substrate (Vector Laboratories) (1:1,000). Native cartilage and skin were used as positive controls for detection of COL2, aggrecan, COL1, COLX, and MMP13 (data not shown). Normal mouse serum was used as the negative control; these sections were not counterstained. Densitometry Analysis AnalySIS Image Processing (Soft Imaging System GmbH V. 5.0, Olympus, Münster, Germany) was used to quantify the amount of antibodies obtained by immunohistochemical analysis. The data represent the analysis of sections of spheroids containing chondrocyte-like cells engineered in vitro from the CD73+, CD106+, and CD271+ subpopulations at 14, 28, and 46 days of chondrogenic differentiation compared to the negative control. To summarize, three fields of 200 µm2 for each antibody at each time point studied were quantified using arbitrary units assigned by the computer program for immunohistochemistry values. The plotted values for IF, osteogenic, and adipogenic analyses are the percentage of positive cells for each marker studied. For chondrogenesis analysis using AnalySIS Image Processing, the values are expressed in arbitrary units reflecting the staining intensity of sections examined using the same magnification and light microscopy conditions. The stain intensity was normalized to the intensity signal observed in the negative control tissue, which was incubated only with secondary antibody. Using AnalySIS Image Processing, the ratios of COL2/aggrecan, COL2/COL1, and aggrecan/COL1 were used as indicators of chondrogenesis. Similarly, the ratios of COLX/COL2, MMP13/COL2, and COL1/COL2 were used as indicators of hypertrophy. Statistics All experiments were performed in triplicate and one representative data set is shown in the figures. The statistical analysis performed between subpopulations and times studied used analysis of variance (ANOVA) and the Students' t-test using SPSS 16.0 software. A P-value <0.05 was considered statistically significant. SEM was shown in error bars..
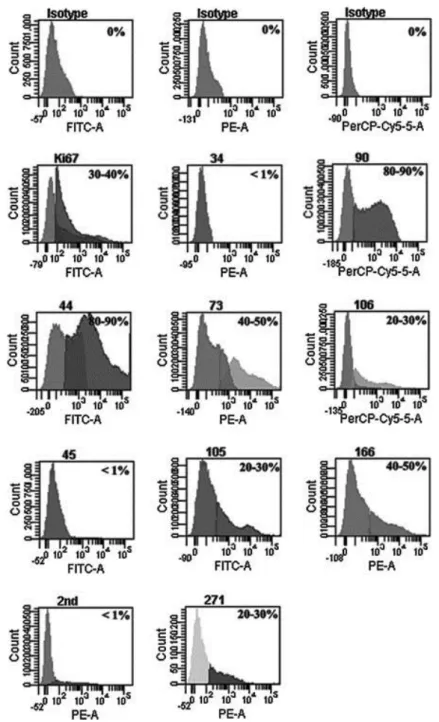
(5) Results Characterization of Cells Flow cytometry analysis of cells isolated from the synovial membrane before sorting the subpopulations showed that the percentage of cells positive for CD44 and CD90 markers was 70–90%, the percentage of cells positive for Ki67, CD73, CD166 was 40–50% and the percentage of cells positive for CD106, CD105, CD271, CD117 was 20–30% (Fig. 1). In contrast, the cells positive for hematopoietic markers were not detectable, the percentage of cells positive for both the CD45 and CD34 markers was <1%. These results indicate that cells from synovial tissue obtained through this process are cells expressing specific MSC markers.. Figure 1. Expression of typical mesenchymal stem cell (MSC) markers in the total population of mesenchymal stem cells isolated from synovial membranes. Flow cytometry analysis of Ki67, CD34, CD90, CD44, CD73, CD106, CD45, CD105, CD166, CD271, and CD117 markers from synovial membrane MSCs before sorting the subpopulations of interest. For each analysis, the antibody used for each marker is given at the top of the plot and the fluorochrome measured is given at the bottom the plot. The percentage of positive cells is indicated in each plot. FITC, fluorescein isothiocyanate; PE, phycoerythrin; PerCP-Cy5, phycoerythrin CP-Cy5..
(6) Characterization of the CD73+, CD106+, and CD271+ synovial membrane MSC subpopulations was made by flow cytometry analysis before and after sorting to evaluate the selective enrichment of CD73+, CD106+, and CD271+. The purity grades achieved by the separation were between 95% and 99%, indicating high purity of the subpopulations for each membrane protein (Fig. 2). IF analysis of the sorted subpopulations were performed to detect differences in the expression of characteristic MSC markers (Fig. 3). CD44, CD69, CD73, CD90, and CD105 were tested in each subpopulation. We found that the CD73+ subpopulation of MSCs had a high percentage of CD44, CD69, and CD90, with more that 50% of cells positive for all these markers and a lower percentage, <40%, of cells positive for the CD105 marker. The CD106+ subpopulation had more than 60% of cells positive for all the markers tested. Conversely, we observed that the CD271+ subset of MSCs derived from synovial membranes had more that 80% of cells positive for of CD69, CD90, and CD105 and <40% of positive cells for the CD44 and CD73 markers. These results may indicate that the subpopulation enriched for CD106 was less differentiated because of the high positive percentage of the other markers, while the CD73+ and CD271+ subpopulations were appreciably more differentiated. To test the differentiation stage of each subpopulation after sorting, real-time reverse transcriptasepolymerase chain reaction (RT-PCR) was performed for the expression of Sox9, Nanog, and Runx2 genes (Fig. 4). All measurements were normalized to the gene expression of the pooled MSCs before sorting. The CD73+ subpopulation had a significantly higher expression of Sox9 than the CD106+ and CD271+ subpopulations (P < 0.05). The CD106+ subpopulation had significantly higher expression of Nanog than did the CD73+ and CD271+ subpopulations (P < 0.05). No differences in the expression of Sox9 and Nanog genes were found between CD73+ and CD271+ subpopulations. However, Runx2 gene expression in the CD271+ subpopulation was significantly higher than in the other two subpopulations (P < 0.05)..
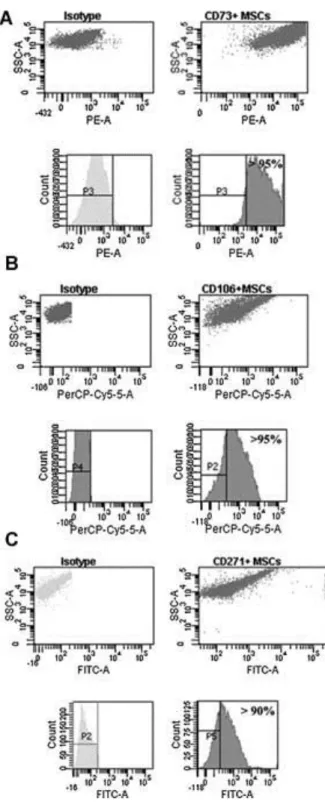
(7) Figure 2. Characterization of CD73+, CD106+, and CD271+ mesenchymal stem cell (MSC) subpopulations isolated from synovial membranes. Flow cytometry analysis of these subpopulations showing selective enrichment of MSC cells expressing. A: Selective enrichment of CD73+-expressing cells. Fluorescence-activated cell sorting (FACS) analysis of the subpopulation of CD73 + before (left) and after (right) sorting from MSCs of synovial membranes. B: Selective enrichment of CD106 +-expressing cells. Fluorescence-activated cell sorting (FACS) analysis of the subpopulation of CD106 + before (left) and after (right) sorting from MSCs of synovial membranes. C: Selective enrichment of CD271+-expressing cells. Fluorescence-activated cell sorting (FACS) analysis of the subpopulation of CD106+ before (left) and after (right) sorting from MSCs of synovial membranes. For each analysis, the antibody used for each marker is given at the top of the plot and the fluorochrome measured is given at the bottom the plot. The percentage of positive cells is indicated in each plot. FITC, fluorescein isothiocyanate; PE, phycoerythrin; PerCP-Cy5, phycoerythrin CP-Cy5..
(8) Figure 3. Immunofluorescence (IF) analysis of the synovial membrane-derived subpopulations of mesenchymal stem cells (MSCs) for characteristic MSC markers. Characteristic markers of MSCs, including CD44, CD69, CD73, CD90, and CD105, were tested in each subpopulation after sorting. A: CD73+ subpopulation; (B) CD106+ subpopulation; (C) CD271+ subpopulation; (D) a plot quantifying the expression of the antibodies obtained by immunohistochemical analysis. The AnalySIS Image Processing computer program was used. The names of the markers are on the right of each panel. For each subpopulation, the left panel shows 4′,6diamidino-2-phenylindole (DAPI) staining of the cell nucleus, the middle panel shows staining by the antibodies linked to fluorescein (FITC) or phycoerythrin (PE) fluorocrome as indicated, and the right panel shows the merged images (magnification 10×). *P < 0.05 by ANOVA was considered significant.. Figure 4. Genes involved in the pluripotency expressed by CD73+, CD106+, and CD271+ mesenchymal stem cell (MSC) subpopulations. The expression of Sox9, Nanog, and Runx2 genes was studied by real-time RT-PCR analysis. Each experiment was done in duplicate, with each set of assays repeated three times. Values are arbitrary units (AU) assigned to the cycles from a computer program as described in the Materials and Methods Section. *P < 0.05 by ANOVA was considered significant..
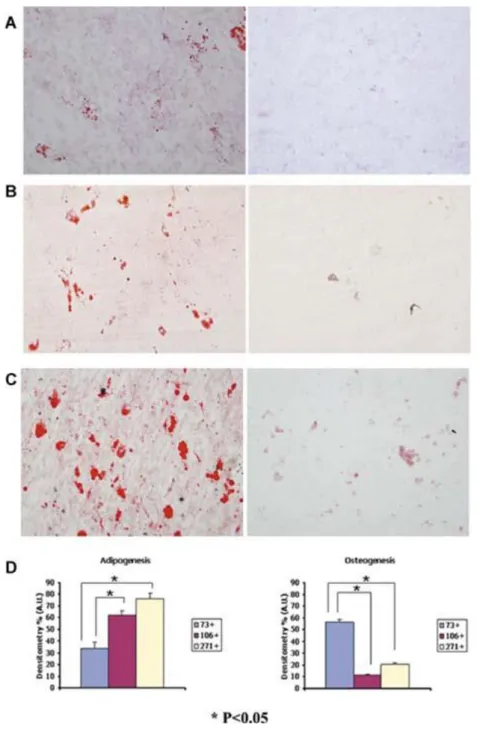
(9) Differentiation Capacity of Cell Subpopulations Adipogenesis and osteogenesis analyses were used as biological markers to insure that the CD73 +, CD106+, and CD271+ MSC subpopulations were adult stem cells capable of differentiation into other mesodermal cell lineages (Fig. 5). Significant differences were found in adipogenesis between the CD73+ MSC subpopulation (34%) and the CD106+ (63%) and CD 271+ (73%) subpopulations (P < 0.05). On the other hand, the CD73+ MSC subpopulation was best at differentiating into osteocytes (56%), while the CD106+ subpopulation produced only 12% and the CD271+ subpopulation produced only 20%.. Figure 5. Differentiation of CD73+, CD106+, CD271+ mesenchymal stem cell (MSC) subpopulations into mesodermal cell lineages. A: CD73+ subpopulation; (B) CD106+ subpopulation; (C) CD271+ subpopulation; the left panels show differentiation towards adipocytes and the right panel shows differentiation towards osteocytes (magnification 10×). The cells were cultured for 21 days in specific differentiation media. Oil red O and Alizarin red were used to stain adipocytes and osteoblasts, respectively. D: Plot showing quantification of the expression of different antibodies obtained by immunohistochemical analyses and analyzed by the AnalySIS Image processing computer program. *P < 0.05 by ANOVA was considered significant. Statistical significance between groups at the same culture times are indicated by an asterisk..
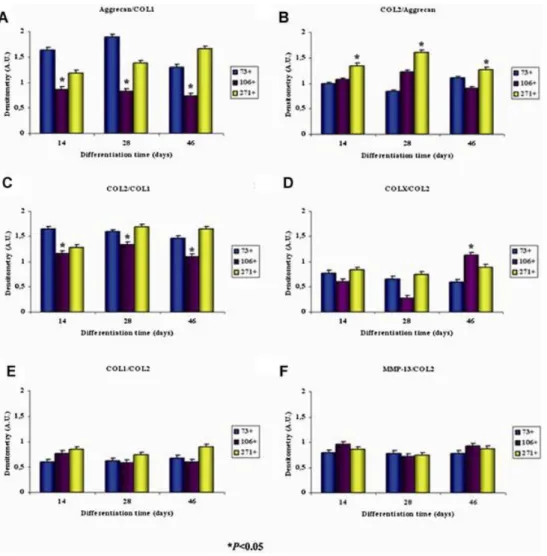
(10) Chondrogenesis and hypertrophy studies are summarized in Table II. These studies focused on the detection by immunohistochemical analysis of the expression of chondrogenic markers, like COL2, aggrecan, COL1, COLX, and MMP13, by the subpopulations at 14, 28, and 46 days in chondrogenic medium during the differentiation process (Fig. 6). The AnalySIS Image computer program was used for measurement (Fig. 7). The CD73+ MSC subpopulation showed significantly higher levels (P < 0.05) of expression of COL2 and aggrecan at all time-points than did the CD106+ MSC subpopulation. The CD271+ subpopulation had a significantly higher intensity of COL2 and aggrecan staining than the other two subpopulations (P < 0.05). The CD106+ MSC subpopulation showed the lowest COL2 and aggrecan staining intensity values overall. All data were normalized to the stain intensity obtained in the same tissue incubated with only the secondary antibody. COL2/aggrecan, COL2/COL1, and aggrecan/COL1 ratios were calculated using immunohistochemistry analysis of sections of spheroids obtained from chondrocyte-like cells engineered from CD73+, CD106+, and CD271+ MSC subpopulations at 14, 28, and 46 days of chondrogenic differentiation in vitro. The results of this chondrogenesis analysis were compared to the negative control using AnalySIS Image Processing (Fig. 7A–C). The chondrogenesis results, reflected by the aggrecan/COL1 and COL2/COL1 ratios, were significantly lower for the CD106+ subpopulation at every time point (0.87 ± 0.05; 0.83 ± 0.03; 0.74 ± 0.02 for aggrecan/COL1 and 1.16 ± 0.05; 1.20 ± 0.05; 1.1 ± 0.05 for COL2/COL1 at 14, 28, and 46 days, respectively) than those of the CD73+ (1.64 ± 0.05; 1.9 ± 0.03; 1.3 ± 0.02 for aggrecan/COL1 and 1.65 ± 0.05; 1.59 ± 0.05; 1.47 ± 0.05 for COL2/COL1 at 14, 28, and 46 days, respectively) and CD271+ (1.19 ± 0.05; 1.38 ± 0.03; 1.67 ± 0.02 for aggrecan/COL1 and 1.28 ± 0.05; 1.69 ± 0.05; 1.65 ± 0.05 for COL2/COL1 at 14, 28, and 46 days, respectively) subpopulations (P < 0.05). The ratios of COLX/COL2, MMP13/COL2, and COL1/COL2 to detect hypertrophy were generated by immunohistochemistry analysis of sections of spheroids obtained from chondrocyte-like cells engineered from CD73+, CD106+, and CD271+ subpopulations of MSCs at 14, 28, and 46 days of chondrogenic differentiation and compared to the negative control using AnalySIS Image Processing (Fig. 7D–F). The COLX/COL2 values were significantly higher (1.12 ± 0.02) at 46 days of chondrogenic differentiation culture of the CD106+ subpopulation of MSCs than in the CD73+ (0.59 ± 0.04) and CD271+ (0.89 ± 0.03) subpopulations at the same time point (P < 0.05)..
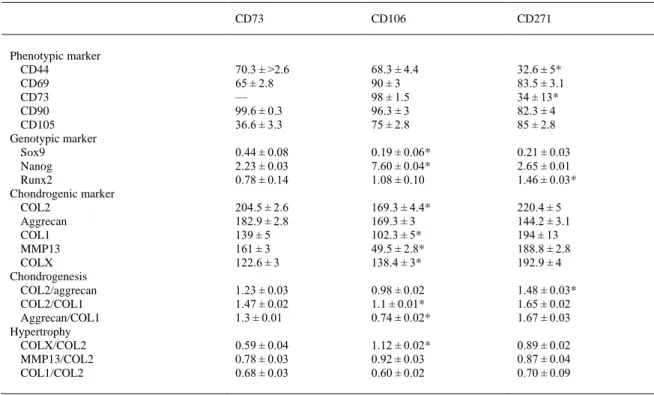
(11) Table II. Summary of Phenotypic, Genotypic, and Chondrogenic Biomarkers in Mesenchymal Stem Cell (MSC) Subpopulations Expressing CD73, CD106, and CD271. Phenotypic marker CD44 CD69 CD73 CD90 CD105 Genotypic marker Sox9 Nanog Runx2 Chondrogenic marker COL2 Aggrecan COL1 MMP13 COLX Chondrogenesis COL2/aggrecan COL2/COL1 Aggrecan/COL1 Hypertrophy COLX/COL2 MMP13/COL2 COL1/COL2. CD73. CD106. CD271. 70.3 ± >2.6 65 ± 2.8 — 99.6 ± 0.3 36.6 ± 3.3. 68.3 ± 4.4 90 ± 3 98 ± 1.5 96.3 ± 3 75 ± 2.8. 32.6 ± 5* 83.5 ± 3.1 34 ± 13* 82.3 ± 4 85 ± 2.8. 0.44 ± 0.08 2.23 ± 0.03 0.78 ± 0.14. 0.19 ± 0.06* 7.60 ± 0.04* 1.08 ± 0.10. 0.21 ± 0.03 2.65 ± 0.01 1.46 ± 0.03*. 204.5 ± 2.6 182.9 ± 2.8 139 ± 5 161 ± 3 122.6 ± 3. 169.3 ± 4.4* 169.3 ± 3 102.3 ± 5* 49.5 ± 2.8* 138.4 ± 3*. 220.4 ± 5 144.2 ± 3.1 194 ± 13 188.8 ± 2.8 192.9 ± 4. 1.23 ± 0.03 1.47 ± 0.02 1.3 ± 0.01. 0.98 ± 0.02 1.1 ± 0.01* 0.74 ± 0.02*. 1.48 ± 0.03* 1.65 ± 0.02 1.67 ± 0.03. 0.59 ± 0.04 0.78 ± 0.03 0.68 ± 0.03. 1.12 ± 0.02* 0.92 ± 0.03 0.60 ± 0.02. 0.89 ± 0.02 0.87 ± 0.04 0.70 ± 0.09. Col1, collagen type I; Col2, collagen type II; COLX, collagen type X; MMP13, metalloproteinase 13. The phenotypic marker results show the percentage of cells positive for the MSC markers, CD44, CD69, CD73, CD90, and CD105 determined by the use of analysis image processing. The immunofluorescent (IF) pictures were obtained using an Olympus microscope to view cultures from CD73+, CD106+, and CD271+ subpopulations. The genotypic marker results show values for the relative expression of the non-differentiation genes Sox9, Nanog, and Runx2 found in the sorted CD73 +, CD106+, and CD271+ subpopulations. The relative expression level of each gene was normalized to that of β-actin using the method [Livak and Schmittgen, 2001]. The control experiments contained no reverse transcriptase. The chondrogenic marker results were also developed using AnalySIS Image Processing. The data represent the analysis of sections of spheroids containing chondrocyte-like cells engineered from CD73+, CD106+, and CD271+ subpopulations at 46 days of chondrogenic differentiation culture, compared to the negative control. The chondrogenesis results show the ratios COL2/aggrecan, COL2/COL1, and Aggrecan/COL1 and the hypertrophy results show the ratios of COLX/COL2, MMP13/COL2, and COL1/COL2, also obtained using AnalySIS Image Processing. These data also represent the analysis of sections of spheroids containing chondrocyte-like cells engineered from CD73+, CD106+, and CD271+ subpopulations at 46 days of chondrogenic differentiation culture, compared to the negative control. * P < 0.05 by ANOVA was considered significant..
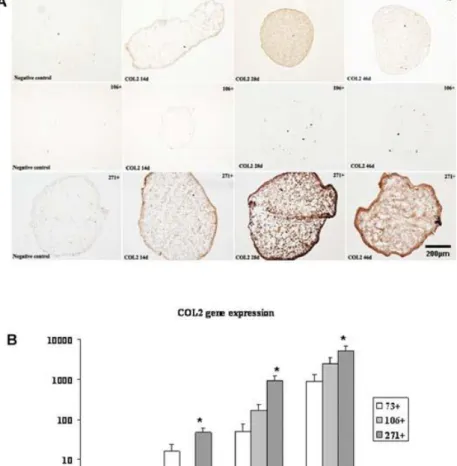
(12) Figure 6. Collagen type II (COL2) immunohistochemistry analysis of spheroids engineered from CD73 +, CD106+, CD271+ mesenchymal stem cell (MSC) subpopulations at 14, 28, and 46 days of culture in a chondrogenic medium. A: Representative images of spheroids at 14, 28, and 46 days of differentiation in chondrogenic medium and the negative control for each subpopulation after 46 days of culture were shown. See the Materials and Methods Section for details. B: Collagen type II (COL2) gene expressed by CD73+, CD106+, and CD271+ mesenchymal stem cell (MSC) subpopulations by real-time RT-PCR analysis. Each experiment was done in duplicate, with each set of assays repeated three times. Values are arbitrary units (AU) assigned to the cycles from a computer program as described in the Materials and Methods Section. *P < 0.05 by ANOVA was considered significant..
(13) Figure 7. Immunohistochemistry analysis of spheroids engineered from CD73 +, CD106+, CD271+, mesenchymal stem cell (MSC) subpopulations after 14, 28, and 46 days of culture in chondrogenic medium. The plot quantifies the expression of the different antibodies obtained by immunohistochemical analysis and the AnalySIS Image processing computer program. *P < 0.05 by ANOVA was considered significant and is indicated by * where the difference between groups at the same time of culture is significant.. Discussion The ability to characterize MSCs remains challenging. Hematopoietic stem cells and MSCs share common morphological and adherence characteristics. In our study, the expression of typical MSC markers in the unsorted population of synovial membrane MSCs, as detected by flow cytometry analysis, revealed high levels of CD44, CD90, and CD105, whereas the expression of the CD proteins typical for hematopoietic cells was undetectable. Similar results have been found by others, indicating that our MSCs isolated from synovial membranes correspond to characteristics typical of MSCs from other sources, such as the umbilical cord [Majore et al., 2009b], bone marrow [Delorme and Charbord, 2007], and placenta [Mariotti et al., 2008]. These findings suggest that the MSC-like cells present in the total population of cells isolated from the synovial membrane meet the criteria for MSCs of the International Society for Cellular Therapy [Dominici et al., 2006]. We observed a high level of enrichment in each of the subpopulations of MSCs after separation from the total pool using the FACS Aria system (Fig. 2). Values achieved were 99% in CD73+ MSC subpopulation, 99% in CD106+, and 95% in CD271+. These data are indicative of a high degree of purity attained by the separation process [Jin et al., 2009]. CD73 is considered to be one of the multiple markers for MSCs [Nesti et al., 2008]. We considered this protein to be a good candidate to use for sorting MSCs and for studying their chondrogenic potential. This decision was facilitated by the work of other authors using different sources of MSCs, including postnatal thymus [Mouiseddine et al., 2008], bone marrow [Peister et al., 2004], and human mesenchymal progenitor cells derived from subchondral cortico-spongious bone [Neumann et al., 2008]. Neumann et al..
(14) 2008 tested the chondrogenic capacity of a subpopulation positive for CD73, CD90, CD105, and STRO1. The analysis of our CD73+ MSC synovial membrane subpopulation by IF indicated a high percentage of cells positive for MSC markers, such as CD44, CD90, and CD69, and few (<40%) cells positive for CD105. Because flow cytometry after sorting showed the CD73+ MSC subpopulation to be 95% positive for CD73 (Table II), we did not test this subpopulation for CD73 antigen by IF. The expression of Sox9, which is a key transcription gene in chondrogenesis, in the CD73 subpopulation was significantly higher than in the other two subpopulations, as shown by real-time RT-PCR (Table II), suggesting that this subpopulation is good suited for chondrocyte differentiation, having less adipogenic potential and the best osteogenic potential of the subpopulations studied. However, the CD73+ MSC subpopulation had a low percentage of cells positive for CD105, compared to the other subpopulations. The CD73+ MSCs expressed high levels of COL2 and aggrecan during direct chondrogenic differentiation, and their levels of COL1, COLX, and MMP13 was stable during the process. Considering all these observations, we believe the CD73+ subpopulation possesses good chondrogenic potential. CD106 is a vascular cell adhesion molecule-1 (VCAM-1) that showed a clear correlation with the differentiation potential; the CD106+ MSC subpopulation was less osteogenic and more adipogenic than the CD73+ MSC subpopulation. Further evaluation of the CD106+ MSC subpopulation revealed a high percentage of cells positive for CD69, CD73, and CD90 (>90%, Table II) with less expression of cells positive for CD44 and CD105 (<70%, Table II). These data are in accordance with the results of Fukiage et al. 2008, who demonstrated that the CD106+ fraction contained less osteogenic and more adipogenic cells than the CD106− fraction. Their evaluation of the CD106 fraction of bone marrow stroma cell strains in early passages clearly predicted the osteogenic and adipogenic potential of this population after the in vitro induction of differentiation [Fukiage et al., 2008]; this indicates the usefulness of CD106 as a differentiation-predictive marker for bone marrow stromal cells. Liu et al. 2009 also reported that Nanog and Oct4 over-expression both improved chondrogenesis. Because Liu et al. used a mouse model and our studies used human cells, the differences might be attributable to differences between species studied. We assessed chondrogenesis by measuring the expression of relevant cartilage tissue proteins in subpopulation cell-containing spheroids using immunohistochemical analyses. Our results indicated that the CD106+ MSC subpopulation had the poorest chondrogenic potential, as reflected by COL2 levels during the differentiation process (Table II). Jarocha et al. 2008 using bone marrow CD271 and CD105 subpopulations, demonstrated that both the osteogenic and adipogenic differentiation potential of expanded cells, as assessed by the microscopic evaluation of calcium–phosphate deposits and appearance of lipid droplets, did not differ between the marker subpopulations. Their gene profile analysis following the osteogenic differentiation process confirmed their microscopic observations. The level of the molecular markers for early and late osteogenic, adipogenic, and chondrogenic progenitors showed only small differences, which probably did not influence the osteogenic differentiation process. The over-expression of Runx2 has been reported to positively affect osteoblastic differentiation, including chondrogenic differentiation [Muruganandan et al., 2009]. Our CD271+ MSC subpopulation had a high (90%) percentage of cells positive for CD69, CD90, and CD105 and a decreased percentage (<40%) of cells positive for CD44 and CD73 (Table II). The data from studies of different grades of expression of the MSCs markers are reported in the literature [Jo et al., 2007; Mageed et al., 2007]. Our data indicate that the CD271+ MSC subpopulation has the most capability for adipogenic and chondrogenic differentiation; it also had a significantly higher expression of Runx2 compared to the other two subpopulations. The CD271+ MSC subpopulation showed the highest expression of COL2 at 28 days of chondrogenesis, although we showed the values at 46 days of chondrogenic differentiation in Table II for easier comprehension. Kim and Im 2010 compared two subpopulations from human bone marrow, CD105+, and CD271+, indicating that the CD271+ subpopulation was slightly more chondrogenic than the CD105+ subpopulation. The chondrogenic differentiation process used to induce differentiation in the subpopulations examined in this study were previously tested to differentiate CD105+ MSCs from synovial membranes by our laboratory [Arufe et al., 2009]; we found that this process did not induce hypertrophy of the cells [Hopper et al., 2009; Jackson et al., 2009]. In the study presented here, we confirmed that no hypertrophy was found in the chondrogenic differentiation of our subpopulations. We found no increase in the expression of COL1, MMP13, or COLX in the subpopulations throughout the culture period in the chondrogenic medium. To our knowledge this is the first study describing an IF approach to delineate phenotypic differences between MSC subpopulations derived from synovial membranes. Our overall results indicate that the CD106 subpopulation was more undifferentiated because it showed the highest positive percentage of the markers CD44, CD69, CD73, CD90, and CD105. The CD73+ and CD271+ subpopulations were more differentiated, as shown by the lower expression of the CD105 marker in the CD73-enriched subpopulation and lower expression of the CD44 and CD73 markers in the CD271-enriched subpopulation. The high level of the CD105 marker in the CD271+ subpopulation could reflect increased.
(15) chondrogenic potential of this subpopulation compared to CD73+, in which expression of CD105 was lower [Arufe et al., 2009; Hoben et al., 2009]. In addition, the genetic analysis yielding a high expression of Runx2 supports the greater chondrogenic potential of the CD271+ subpopulation. This potential could be enabled by the inhibition of chondrogenic differentiated stem cell hypertrophy [Pei et al., 2009]. The CD271+ subpopulation had significantly more intense COL2 staining throughout the chondrogenic differentiation process than did the other subpopulations (Fig. 7B). The levels of staining for COL1, MMP13, and COLX of spheroids of all subpopulations were unchanged through the entire culture period, indicating that no hyperthrophy was present in our model of chondrogenesis. Conclusions We confirmed that the human synovial membrane is a good source of progenitor cells with the capacity to differentiate towards several mesodermal cell lineages (adipocytes, osteocytes, and chondrocytes). We also found that the subpopulations of MSCs derived from synovial membrane demonstrated the potential for differentiation into the osteogenic pathway, as evaluated by increased mineralization, and toward the adipogenesis, shown by the increase in oil droplets. The CD271+ MSC subpopulation retained the most chondrogenic potential, followed by the CD73+ MSC subpopulation, when compared with the CD106+ MSC subpopulation. The MSC markers may provide a new predictive tool for selecting MSC populations for differentiation into different mesenchymal cell types. Acknowledgements We would like to thank M.J. Sánchez and P. Filgueira for technical assistance and Dr. Jesús Mateos for helpful suggestions. This study was supported by grants from the Servizo Galego de Saúde, Xunta de Galicia (PS07/86), Catedra Bioiberica de la Universidade da Coruña and Instituto de Salud Carlos III CIBER BBN CB06-01-0040; Fondo de Investigación Sanitaria PI-08/2028. M.C. Arufe is the beneficiary of an Isidro Parga Pondal contract from Xunta de Galicia, A Coruna, Spain. Alexandre de la Fuente is the beneficiary of a contract from Xunta de Galicia (2008), Spain.. References Alexander D, Schafer F, Munz A, Friedrich B, Klein C, Hoffmann J, Buhring HJ, Reinert S. 2009. LNGFR induction during osteogenesis of human jaw periosteum-derived cells. Cell Physiol Biochem 24: 283–290. Arufe MC, De la Fuente A, Fuentes-Boquete I, De Toro FJ, Blanco FJ. 2009. Differentiation of synovial CD-105(+) human mesenchymal stem cells into chondrocyte-like cells through spheroid formation. J Cell Biochem 108(1): 145–155. Caplan AI. 1991. Mesenchymal stem cells. J Orthop Res 9: 641–650. Delorme B, Charbord P. 2007. Culture and characterization of human bone marrow mesenchymal stem cells. Methods Mol Med 140: 67–81. Dominici M, Le Blanc K, Mueller I, Slaper-Cortenbach I, Marini F, Krause D, Deans R, Keating A, Prockop D, Horwitz E. 2006. Minimal criteria for defining multipotent mesenchymal stromal cells. The International Society for Cellular Therapy position statement. Cytotherapy 8: 315–317. Fukiage K, Aoyama T, Shibata KR, Otsuka S, Furu M, Kohno Y, Ito K, Jin Y, Fujita S, Fujibayashi S, Neo M, Nakayama T, Nakamura T, Toguchida J. 2008. Expression of vascular cell adhesion molecule-1 indicates the differentiation potential of human bone marrow stromal cells. Biochem Biophys Res Commun 365: 406–412. Hoben GM, Willard VP, Athanasiou KA. 2009. Fibrochondrogenesis of hESCs: Growth factor combinations and cocultures. Stem Cells Dev 18: 283–292. Hopper DW, Vera MD, How D, Sabatini J, Xiang JS, Ipek M, Thomason J, Hu Y, Feyfant E, Wang Q, Georgiadis KE, Reifenberg E, Sheldon RT, Keohan CC, Majumdar MK, Morris EA, Skotnicki J, Sum PE. 2009. Synthesis and biological evaluation of ((4-keto)-phenoxy)methyl biphenyl-4-sulfonamides: A class of potent aggrecanase-1 inhibitors. Bioorg Med Chem Lett 19: 2487–2491. Horn P, Bork S, Diehlmann A, Walenda T, Eckstein V, Ho AD, Wagner W. 2008. Isolation of human mesenchymal stromal cells is more efficient by red blood cell lysis. Cytotherapy 10: 676–685. Isakova IA, Baker K, DuTreil M, Dufour J, Gaupp D, Phinney DG. 2007. Age- and dose-related effects on MSC engraftment levels and anatomical distribution in the central nervous systems of nonhuman primates: Identification of novel MSC subpopulations that respond to guidance cues in brain. Stem Cells 25: 3261–3270. Jackson MT, Smith MM, Smith SM, Jackson CJ, Xue M, Little CB. 2009. Activation of cartilage matrix metalloproteinases by activated protein C. Arthritis Rheum 60: 780–791. Jarocha D, Lukasiewicz E, Majka M. 2008. Adventage of mesenchymal stem cells (MSC) expansion directly from purified bone marrow CD105+ and CD271+ cells. Folia Histochem Cytobiol 46: 307–314..
(16) Jin D, Piper JA, Leif RC, Yang S, Ferrari BC, Yuan J, Wang G, Vallarino LM, Williams JW. 2009. Time-gated flow cytometry: An ultra-high selectivity method to recover ultra-rare-event mu-targets in high-background biosamples. J Biomed Opt 14: 024023. Jo CH, Ahn HJ, Kim HJ, Seong SC, Lee MC. 2007. Surface characterization and chondrogenic differentiation of mesenchymal stromal cells derived from synovium. Cytotherapy 9: 316–327. Kawaguchi J, Mee PJ, Smith AG. 2005. Osteogenic and chondrogenic differentiation of embryonic stem cells in response to specific growth factors. Bone 36: 758–769. Kim HJ, Im GI. 2010. Combination of transforming growth factor-beta(2) and bone morphogenetic protein 7 enhances chondrogenesis from adipose tissue-derived mesenchymal stem cells. Tissue Eng Part A 16(3): 851– 860. Koga H, Shimaya M, Muneta T, Nimura A, Morito T, Hayashi M, Suzuki S, Ju YJ, Mochizuki T, Sekiya I. 2008. Local adherent technique for transplanting mesenchymal stem cells as a potential treatment of cartilage defect. Arthritis Res Ther 10: R84. Liu F, Akiyama Y, Tai S, Maruyama K, Kawaguchi Y, Muramatsu K, Yamaguchi K. 2008. Changes in the expression of CD106, osteogenic genes, and transcription factors involved in the osteogenic differentiation of human bone marrow mesenchymal stem cells. J Bone Miner Metab 26: 312–320. Liu TM, Wu YN, Guo XM, James Hoi Po H, Lee EH, Lim B. 2009. Effects of Ectopic Nanog and Oct4 overexpression on mesenchymal stem cells. Stem Cells Dev 18(7): 1013–1022. Livak KJ, Schmittgen TD. 2001. Analysis of relative gene expression data using real-time quantitative PCR and the 2(-Delta Delta C(T)) Method. Methods 25: 402–408. Mageed AS, Pietryga DW, DeHeer DH, West RA. 2007. Isolation of large numbers of mesenchymal stem cells from the washings of bone marrow collection bags: Characterization of fresh mesenchymal stem cells. Transplantation 83: 1019–1026. Majore I, Moretti P, Hass R, Cornelia K. 2009a. Identification of subpopulations in mesenchymal stem cell-like cultures from human umbilical cord. Cell Commun Signal 7: 6. Majore I, Moretti P, Hass R, Kasper C. 2009b. Identification of subpopulations in mesenchymal stem cell-like cultures from human umbilical cord. Cell Commun Signal 7: 6. Mariotti E, Mirabelli P, Abate G, Schiattarella M, Martinelli P, Fortunato G, Di Noto R, Del Vecchio L. 2008. Comparative characteristics of mesenchymal stem cells from human bone marrow and placenta: CD10, CD49d, and CD56 make a difference. Stem Cells Dev 17: 1039–1041. Molloy AP, Martin FT, Dwyer RM, Griffin TP, Murphy M, Barry FP, O'Brien T, Kerin MJ. 2009. Mesenchymal stem cell secretion of chemokines during differentiation into osteoblasts, and their potential role in mediating interactions with breast cancer cells. Int J Cancer 124: 326–332. Mouiseddine M, Mathieu N, Stefani J, Demarquay C, Bertho JM. 2008. Characterization and histological localization of multipotent mesenchymal stromal cells in the human postnatal thymus. Stem Cells Dev 17: 1165–1174. Muruganandan S, Roman AA, Sinal CJ. 2009. Adipocyte differentiation of bone marrow-derived mesenchymal stem cells: Cross talk with the osteoblastogenic program. Cell Mol Life Sci 66: 236–253. Nesti LJ, Jackson WM, Shanti RM, Koehler SM, Aragon AB, Bailey JR, Sracic MK, Freedman BA, Giuliani JR, Tuan RS. 2008. Differentiation potential of multipotent progenitor cells derived from war-traumatized muscle tissue. J Bone Joint Surg Am 90: 2390–2398. Neumann K, Dehne T, Endres M, Erggelet C, Kaps C, Ringe J, Sittinger M. 2008. Chondrogenic differentiation capacity of human mesenchymal progenitor cells derived from subchondral cortico-spongious bone. J Orthop Res 26: 1449–1456. Pei M, Chen D, Li J, Wei L. 2009. Histone deacetylase 4 promotes TGF-beta1-induced synovium-derived stem cell chondrogenesis but inhibits chondrogenically differentiated stem cell hypertrophy. Differentiation 78(5): 260– 268. Peister A, Mellad JA, Larson BL, Hall BM, Gibson LF, Prockop DJ. 2004. Adult stem cells from bone marrow (MSCs) isolated from different strains of inbred mice vary in surface epitopes, rates of proliferation, and differentiation potential. Blood 103: 1662–1668. Prockop DJ. 1997. Marrow stromal cells as stem cells for nonhematopoietic tissues. Science 276: 71–74. Simon TM, Jackson DW. 2006. Articular cartilage: Injury pathways and treatment options. Sports Med Arthrosc 14: 146–154. Steinert AF, Ghivizzani SC, Rethwilm A, Tuan RS, Evans CH, Noth U. 2007. Major biological obstacles for persistent cell-based regeneration of articular cartilage. Arthritis Res Ther 9: 213. Steingen C, Brenig F, Baumgartner L, Schmidt J, Schmidt A, Bloch W. 2008. Characterization of key mechanisms in transmigration and invasion of mesenchymal stem cells. J Mol Cell Cardiol 44: 1072–1084. Zannettino AC, Paton S, Arthur A, Khor F, Itescu S, Gimble JM, Gronthos S. 2008. Multipotential human adiposederived stromal stem cells exhibit a perivascular phenotype in vitro and in vivo. J Cell Physiol 214: 413–421..
(17)
Figure

+5
Documento similar
