Strategy and Communication of
Leading Global Business Schools -
Estrategia y Comunicación en las
Escuelas de negocio líderes a
nivel global
Tesis doctoral – Doctorado en Investigación y Marketing
Andrés Pérez Ruiz 20/10/2015
Directores:
Dra. Francisca Parra Guerrero
Esta obra está bajo una licencia de Creative Commons
Reconocimiento-NoComercial-SinObraDerivada 4.0 Internacional:
http://creativecommons.org/licenses/by-nc-nd/4.0/legalcode
Cualquier parte de esta obra se puede reproducir sin autorización
pero con el reconocimiento y atribución de los autores.
No se puede hacer uso comercial de la obra y no se puede alterar, transformar o hacer
obras derivadas.
3
5
Estrategia y Comunicación en las Escuelas
de Negocio Líderes a Nivel Global
Tesis doctoral
TABLA DE CONTENIDO
INDICE DE TABLAS Y GRAFICOS ... 11
TABLAS ... 11
GRAFICOS ... 20
SUMMARY ... 25
Research aims ... 25
Main conclusions on the literature review ... 27
Scope ... 30
Research questions ... 30
Methodology ... 33
Findings ... 34
6
CAPÍTULO 2: ESTADO DE LA CUESTION. ANÁLISIS DE LA LITERATURA ... 61
2.1. Las Escuelas de Negocio ... 61
2.2. Los criterios de clasificación de las Escuelas de Negocio a nivel mundial. Valor clasificatorio de los rankings ... 113
2.2. Estrategia en el sector de las Escuelas de Negocio ... 126
2.4. El Marketing-mix de las Escuelas de Negocio ... 136
2.5. La comunicación global y la imagen de las principales Escuelas de Negocio ... 142
CAPÍTULO 3: JUSTIFICACIÓN Y OBJETIVOS ... 161
3.1. Propósito de la investigación ... 161
3.2. Alcance ... 163
3.3. Utilidad de la investigación ... 168
3.3.1. Para el ámbito académico ... 169
3.3.2. Para los operadores del sector ... 170
3.3.3. Para el investigador ... 172
CAPÍTULO 4: PREGUNTA DE INVESTIGACION Y METODOLOGÍA ... 175
4.1. Preguntas de investigación ... 177
Pregunta principal ... 177
Subpreguntas ... 178
4.2. Metodología ... 179
7
4.3.1. Análisis crítico y justificación del método elegido ... 181
4.3.2. El análisis cluster y el investigador ... 189
4.3.2. Fuentes de datos y herramientas de tratamiento ... 193
CAPÍTULO 5: RESULTADO DE LA INVESTIGACIÓN I: CLASIFICACIÓN DE LAS ESCUELAS DE NEGOCIO SEGÚN SU DIFERENCIACIÓN COMPETITIVA MOSTRADA EN LOS RANKINGS ... 199
5.1. Preparación de los datos ... 199
Fiabilidad de los valores ... 226
Reducción de variables ... 229
5.2. Tratamiento estadístico. Interpretación de los resultados... 237
El análisis cluster jerarquizado ... 237
Elección del número de clusters (k) ... 248
Resultado del análisis cluster de k-medias ... 257
Interpretación de los datos ... 269
5.3. Descripción del perfil de cada cluster ... 301
CAPÍTULO 6: RESULTADO DE LA INVESTIGACIÓN II: CLASIFICACIÓN DE LAS ESCUELAS DE NEGOCIOS EN FUNCION DE SU ENFOQUE BASICO DE PRODUCTO (POSICION EN EL CONTINUO ACADEMICO-PROFESIONAL) ... 327
6.1. Preparación de los datos ... 331
6.2 Tratamiento estadístico. Interpretación de los resultados ... 354
Elección del número de clusters (k) ... 354
8
Interpretación de los datos ... 366
6.3 Descripción del perfil de cada cluster ... 371
6.4 Un análisis adicional: supervivencia ... 373
CAPÍTULO 7: RESULTADO DE LA INVESTIGACIÓN III: CLASIFICACIÓN DE LAS ESCUELAS DE NEGOCIOS EN FUNCION DE SUDISTRIBUCION ON-LINE ... 377
CAPÍTULO 8: RESULTADO DE LA INVESTIGACIÓN IV: CLASIFICACIÓN DE LAS ESCUELAS DE NEGOCIOS EN FUNCION DE SU PRECIO ... 381
8.1. Preparación de los datos ... 382
8.2. Tratamiento estadístico. Interpretación de los resultados... 388
8.3. Descripción del perfil de cada cluster ... 393
CAPÍTULO 9: RESULTADO DE LA INVESTIGACIÓN V: CLASIFICACION DE LAS ESCUELAS DE NEGOCIO EN FUNCIÓN DE SU COMUNICACIÓN GLOBAL, RELEVANCIA DE LAS PÁGINAS WEB ... 397
9.1. Preparación de los datos ... 398
9.2. Tratamiento estadístico. Interpretación de los resultados... 412
Elección del número de clusters (k) ... 412
Resultado del análisis ... 412
Interpretación de los datos ... 416
9.3. Descripción del perfil de cada cluster ... 418
9
10.1. Preparación de los datos ... 422
10.2. Tratamiento estadístico. Interpretación de los resultados... 428
10.3. Descripción del perfil de cada cluster ... 435
10.4. Un análisis adicional: análisis textual ... 437
CAPÍTULO 11: RESULTADO DE LA INVESTIGACIÓN VII: CONTRUCCION DE UN MODELO GLOBAL DE VARIABLES PARA LA CLASIFICACION DE LAS ESCUELAS DE NEGOCIO LÍDERES ... 443
11.1. Resumen de la inclusión de las diferentes Escuelas en todos los clusters definidos ... 444
11.2 Un modelo conjunto. Preparación de los datos ... 450
11.3 Tratamiento estadístico. Interpretación de los resultados ... 458
11.4 Comportamiento de las variables ... 467
11.5 Descripción del perfil de cada cluster ... 469
CHAPTER 12 CONCLUSIONS ... 477
Recapitulation ... 477
Answers to the research questions ... 480
Future research ... 486
LISTA DE REFERENCIAS... 491
APENDICES ... 507
Apéndice 1 Variables del Financial Times Global MBA Ranking ... 509
Apéndice 2: Financial Times Global MBA 2015 ranking. Tabla inicial... 511
10
Apéndice 4: Datos de partida, análisis del tipo de actividad Escuelas de Negocio
... 520
Apéndice 5: Rankings de MBA on-line, datos de partida ... 529
Apéndice 6: Datos de partida para el análisis del precio y la duración de los
MBA ... 530
Apéndice 7: Datos de partida para el análisis de la relevancia de las páginas
web de las Escuelas de Negocio ... 535
Apéndice 8: Páginas tomadas como base para los datos de comunicación:
relevancia de la web... 537
Apéndice 9: ZScores calculados sobre los datos de partida para analizar la
relevancia web y agrupamiento en variables compuestas ... 541
Apéndice 10: Páginas de usuario tenidas en cuenta como fuente para los datos
sobre redes sociales ... 544
Apéndice 11: Datos recogidos sobre la actividad de las Escuelas de Negocio en
redes sociales ... 549
Apéndice 12: Datos de partida modelo conjunto ... 555
Apéndice 13: matriz de disimilitud, distancia entre las primeras 50 Escuelas de
Negocio (se incluye en el documento electrónico las 100 primeras, que no
podrán visualizarse en papel) ... 559
Apéndice 14: ubicación de las distintas Escuelas en función del número de
11
INDICE DE TABLAS Y GRAFICOS
Salvo otra indicación de fuente, elaboración propia
TABLAS
Table 1. Clusters summary for every Business School ... 37
Table 2. Centroids of the final clusters ... 45
Table 3. Characteristics of the final clusters ... 46
Table 4. Geographical location of the Business Schools in the final clusters ... 46
Table 5. Business Schools in cluster 0.3 ... 49
Table 6. Business Schools in cluster 0.4 ... 50
Table 7. Business Schools in cluster 0.5 ... 51
Tabla 8. Business Schools in cluster 0.6 ... 53
Tabla 9. Business Schools in cluster 0.7 ... 55
Tabla 10. Comportamiento de la demanda de MBAs en 2014. Fuente: GMAC “Application Trends Survey” ... 91
Tabla 11. Países con Escuelas de Negocios que han obtenido la "Triple Corona". Fuente: "MBA Today" ... 117
Tabla 12. Número de Escuelas de Negocio que han iniciado acciones en respuesta a los rankings. Fuente: Wedlin (2006) ... 124
Tabla 13. Estrategias competitivas genéricas de Porter (1980) ... 126
12
Tabla 15. Enfoque del concepto de Marketing Mix frente al nuevo escenario del
comercio electrónico. Fuente: Goi (2009) ... 139
Tabla 16. Comparativa de los dos conceptos de Marketing Mix basados en las 7Ps y las 4 Ps. Fuente: Goi (2009) ... 140
Tabla 17. Resultados numéricos del estudio sobre atributos cognitivos y afectivos asociados a la marca de las Escuelas de Negocios. Fuente: Syed Alwi y Kitchen (2014) ... 146
Tabla 18. Alcance e influencia de los distintos medios de comunicación de las Escuelas de Negocios. Fuente: GMAC “mba.com Prospective Students Survey” 2015 ... 150
Tabla 19. Tipo de uso de redes sociales, por generación del usuario. Fuente: GMAC “mba.com Prospective Students Survey” 2015 ... 155
Tabla 20. Escuelas de Negocios clasificadas en algún momento de esta investigación ... 165
Tabla 21. Valoración de los distintos rankings por parte de los Decanos de Escuelas de Negocio. Fuente: Wedlin, 2006 ... 195
Tabla 22. Características de las variables Weighted salary (US$) y Salary percentage increase. Elaboración propia a partir de los datos del Financial Times ... 203
Tabla 23. Escala y distribución de todas las variables del ranking. Elaboración propia a partir de los datos del Financial Times ... 207
Tabla 24. Escalas de las variables y distribución tras calcular los ZScores ... 208
Tabla 25. Datos análisis de regresión para todas las variables ... 215
13
Tabla 27. Una propuesta para los ZScores de las variables ordinales ... 219
Tabla 28. Diferencias de los ZScores entre la escala ordinal y la distribución promediada ... 221
Tabla 29. Matriz de correlaciones entre variables (Pearson) ... 231
Tabla 30. Agrupación de variables propuesta por el Financial Times ... 235
Tabla 31. Descomposición de la variación para tres clusters ... 242
Tabla 32. Clasificación en 3 clusters. Estadísticos y Escuelas de Negocio componentes ... 243
Tabla 33. Clasificación en tres clusters. Valor de las variables en los centroides245 Tabla 34. Grado de disimilitud por número de clusters ... 249
Tabla 35. Descomposición de la variación por número de clusters ... 250
Tabla 36. Estadísticos para diversos niveles de k (número de clusters) ... 252
Tabla 37. Valor de las variables en los distintos centroides para diversos niveles de k (número de clusters) ... 254
Tabla 38. Resumen de la optimización: ... 259
Tabla 39. Estadísticos para cada iteración ... 259
Tabla 40. Descomposición de la variación para la clasificación óptima: ... 260
Tabla 41. Centroides iniciales de las clases ... 261
Tabla 42. Centroides finales ... 262
Tabla 43. Distancias entre los centroides de las clases ... 263
Tabla 44. Objetos centrales ... 264
14
Tabla 46. Resultados por clase ... 265
Tabla 47. Distancia al centroide ... 266
Tabla 48. Corelación de "Value for money rank" con el resto de variables de valor
... 276
Tabla 49. Sueldo promedio estimado a 20 años. Fuente: PayScale ... 278
Tabla 50. Correlación de "Aims Achieved (%)" con el resto de variables de valor
... 281
Tabla 51. Estadísticos variables "Aims Achieved (%)" ... 282
Tabla 52. Correlación de "Placement success rank" con el resto de variables de
valor ... 284
Tabla 53. Correlación de "Alumni recommend rank" con el resto de variables de
valor ... 287
Tabla 54. Correlación de "Female Faculty (%)" con las variables de valor ... 288
Tabla 55. Correlación de "Female faculty (%)" y “Female Board (%)” con las
variables de valor ... 292
Tabla 56. Correlación de todas las variables que reflejan internacionalidad ... 294
Tabla 57. Journals tenidos en cuenta para el research ranking del Financial Times
... 298
Tabla 58. Correlación de las variables de generación de ideas con las demás
variables del modelo ... 300
Tabla 59. Escuelas de Negocios incluidas en el cluster 1.1... 302
15
Tabla 61. Distancia entre el centroide del cluster 1.1 y el resto de centroides .. 303
Tabla 62. Escuelas de Negocios incluidas en el cluster 1.2... 305
Tabla 63. Cluster 1.2, valor de las variables en el centroide ... 306
Tabla 64. Distancia entre el centroide del cluster 1.2 y el resto de centroides .. 306
Tabla 65. Escuelas de Negocios incluidas en el cluster 1.3... 308
Tabla 66. Distancia entre el centroide del cluster 1.3 y el resto de centroides .. 309
Tabla 67. Cluster 1.3, valor de las variables en el centroide ... 309
Tabla 68. Escuelas de Negocios incluidas en el cluster 1.4... 312
Tabla 69. Distancia entre el centroide del cluster 1.4 y el resto de centroides .. 313
Tabla 70. Cluster 1.4, valor de las variables en el centroide ... 314
Tabla 71. Escuelas de Negocios incluidas en el cluster 1.5... 315
Tabla 72. Distancia entre el centroide del cluster 1.5 y el resto de centroides .. 316
Tabla 73. Escuelas de Negocios incluidas en el cluster 1.6... 318
Tabla 74. Distancia entre el centroide del cluster 1.6 y el resto de centroides,
comparado con las del centroide del cluster 1.4 ... 319
Tabla 75. Cluster 1.6, valor de las variables en el centroide y comparativa con el
del cluster 1.4 ... 320
Tabla 76. Escuelas de Negocios incluidas en el cluster 1.7... 322
Tabla 77. Distancia entre el centroide del cluster 1.7 y el resto de centroides,
comparado con las del centroide del cluster 1.5 ... 323
Tabla 78. Cluster 1.7, valor de las variables en el centroide y comparación con el
16
Tabla 79. Tabla inicial, continuo académico-profesional ... 335
Tabla 80. Datos depurados, continuo académico-profesional ... 342
Tabla 81. Continuo académico-profesional. Datos finales en porcentaje ... 351
Tabla 82. Simulación varios niveles de k, continuo académico-profesional ... 357
Tabla 83. Escuelas de Negocios en cada Cluster. Continuo académico-profesional ... 359
Tabla 84. Distancia promedio a los centroides de las distintas Escuelas de Negocios en cada cluster ... 362
Tabla 85. Distancia de los distintos centroides entre sí ... 363
Tabla 86. Estadisticos ANOVA ... 363
Tabla 87. Puntuación promedio de las Escuelas de Negocio y desviación típica 364 Tabla 88. País de las Escuelas de Negocio en cada cluster ... 365
Tabla 89. Zona geográfica de las Escuelas de Negocio en cada cluster ... 366
Tabla 90. Escuelas de Negocio presentes en las últimas ediciones de todos los rankings considerados ... 368
Tabla 91. Valores de las variables en los centroides de cada cluster, en porcentaje ... 369
Tabla 92. Valores de las variables en los centroides de cada cluster, en puntuación ... 369
Tabla 93. Valores de las variables en los centroides de cada cluster, en puntuación y deducido el mínimo aplicado ... 370
17
Tabla 95. Escuelas con programas Online MBA presentes en los rankings
seleccionados. Promedio de posición ... 379
Tabla 96. Variables iniciales en el modelo precio-duración ... 385
Tabla 97. ZScores modelo precio-duración ... 386
Tabla 98. Valores de las variables en los centroides para el modelo
precio-duración ... 390
Tabla 99. Escuelas en cada cluster, modelo precio-duración ... 390
Tabla 100. Número de Escuela por país, modelo precio-duración ... 392
Tabla 101. Promedios por cluster, posición en ranking y distancia al centroide 392
Tabla 102. Distancias entre centroides... 392
Tabla 103. Información recabada, autoridad y relevancia páginas web de Escuelas
de Negocio ... 402
Tabla 104. ZScores finales. Modelo autoridad y relevancia páginas web de
Escuelas de Negocio ... 408
Tabla 105. Valores de las variables en los centroides. Modelo autoridad y
relevancia páginas web de las Escuelas de Negocio ... 413
Tabla 106. Distancias entre centroides. Modelo autoridad y relevancia páginas
web de las Escuelas de Negocio ... 413
Tabla 107. Escuelas incluidas en cada cluster. Modelo autoridad y relevancia
páginas web de las Escuelas de Negocio ... 413
Tabla 108. Número de Escuelas por zonas geográficas y cluster. Modelo
18
Tabla 109. Datos recopilados, modelo autoridad y relevancia en redes sociales
... 423
Tabla 110. ZScores por Escuela de Negocios. Modelo autoridad y relevancia en redes sociales ... 426
Tabla 111. Promedios por cluster, posición en rankings y distancia al centroide. Modelo autoridad y relevancia en redes sociales ... 430
Tabla 112. Valores de las variables en cada centroide. Modelo autoridad y relevancia en redes sociales ... 431
Tabla 113. Distancia entre los centroides. Modelo autoridad y relevancia en redes sociales ... 431
Tabla 114. Escuelas incluidas en cada cluster. Modelo autoridad y relevancia en redes sociales ... 432
Tabla 115. Número de Escuelas de Negocios en cada cluster por zona geográfica. Modelo autoridad y relevancia en redes sociales ... 434
Tabla 116. Frecuencia de palabras en las descripciones de LinkedIn ... 438
Tabla 117. Clusters de pertenencia para cada Escuela de Negocios ... 445
Tabla 118. ZScores para cada Escuela de Negocios. Modelo conjunto ... 455
Tabla 119. Simulación, número de componentes por cluster. Modelo conjunto ... 461
Tabla 120. Valores en los centroides para cada variable. Modelo conjunto ... 463
Tabla 121. Distancia entre centroides. Modelo conjunto ... 463
19
Tabla 123. Promedios por cluster de posición en rankings y distancia al centroide
... 466
Tabla 124. Número de Escuelas por cluster y zona geográfica. Modelo conjunto ... 466
Tabla 125. Correlación entre variables, modelo conjunto ... 468
Tabla 126. Escuelas de Negocios incluidas en el cluster 0.3 ... 471
Tabla 127. Escuelas de Negocios incluidas en el cluster 0.4 ... 471
Tabla 128. Escuelas de Negocios incluidas en el cluster 0.5 ... 473
Tabla 129. Escuelas de Negocios incluidas en el cluster 0.6 ... 474
20 GRAFICOS
Gráfico 1. Retos de las Escuelas de Negocios según sus directivos. Fuente:
CarringtonCrisp "See the Future” 2014 ... 100
Gráfico 2. Opiniones de los directivos y empleados de Escuelas de Negocios al
respecto de las acciones de innovación de estas instituciones frente a los
cambios en el sector. Fuente: CarringtonCrisp "See the Future" 2014... 105
Gráfico 3. Opinión de los clientes corporativos en relación a la innovación futura
conjuntamente con Escuelas de Negocio. Fuente: CarringtonCrisp "see the
Future" 2014 ... 106
Gráfico 4. Retos en los próximos años para las Escuelas de Negocio según sus
Decanos. Fuente: EFMD "Deans Barometer" 2012 ... 107
Gráfico 5. Opinión de los expertos sobre internacionalización de las Escuelas de
Negocio. Fuente: European Association for International Education (EAIE) “The
EAIE Barometer. Internationalisation in Europe” ... 108
Gráfico 6. Mención de los expertos sobre acciones concretas de
internacionalización implementadas por las Escuelas de Negocio. Fuente:
European Association for International Education (EAIE) “The EAIE Barometer.
Internationalisation in Europe” ... 109
Gráfico 7. Características extremas de las Escuelas de Negocio según su posición
en el continuo Académico-Profesional. Elaboración propia ... 118
Gráfico 8. Cambios en el entorno y medidas a desarrollar por las Escuelas de
Negocio. Fuente: Íñiguez de Onzoño y Carmona (2007) ... 134
Gráfico 9. Mapa estratégico del sector de las Escuelas de Negocio. Fuente:
21
Gráfico 10. Mapa conceptual del modelo de atributos cognitivos y afectivos
asociados a la marca de las Escuelas de Negocios. Fuente: Syed Alwi y Kitchen
(2014) ... 144
Gráfico 11. Resultado del estudio de atributos cognitivos y afectivos asociados a
la marca de las Escuelas de Negocios. Fuente: Syed Alwi y Kitchen (2014) ... 145
Gráfico 12. Factores que contribuyen a desarrollar la imagen de una Escuela de
Negocios. Fuente: CarringtonCrisp, “The Business of Branding” 2012 ... 148
Gráfico 13. Elementos de comunicación que influyen en la decisión de los
estudiantes por una determinada Escuela de Negocios. Fuente: CarringtonCrisp,
“The Business of Branding” 2012 ... 149
Gráfico 14. Comparativa gráfica del alcance e influencia de los distintos medios
de comunicación de las Escuelas de Negocios. Elaboración propia a partir de los
datos de la fuente: GMAC “mba.com Prospective Students Survey” 2015 ... 152
Gráfico 15. Motivos para recomendar una Escuela de Negocios. Fuente:
CarringtonCrisp "The Business of Branding" 2012 ... 153
Gráfico 16. Páginas web visitadas por los estudiantes para tomar una decisión
sobre la Escuela de Negocios. Fuente: CarringtonCrisp “Tomorrow’s MBA 2013.
The New Diversity” ... 154
Gráfico 17. Frecuencia de uso de redes sociales, por generación del usuario.
Fuente: GMAC “mba.com Prospective Students Survey” 2015 ... 155
Gráfico 18. Uso de las redes sociales por generación del usuario. Fuente: GMAC
“mba.com Prospective Students Survey” 2015 ... 156
Gráfico 19. Comparativa de la distribución de dos variables: valor absoluto y
22
Gráfico 20. Comportamiento de las variables en escala continua ... 211
Gráfico 21. Tres líneas de regresión para la variable Weighted Salary (US$) ... 212
Gráfico 22. Perfil de la distribución promedio ... 218
Gráfico 23. Diferencia gráfica de los ZScores entre la escala ordinal y la
distribución continua promediada ... 220
Gráfico 24. Distribución de las Escuelas de Negocios según su posición en ranking
y su score estimado: antes de los ajustes ... 224
Gráfico 25. Distribución de las Escuelas de Negocios según su posición en ranking
y su score estimado: después de los ajustes ... 225
Gráfico 26. Dendograma. Análisis cluster jerarquizado de las variables del ranking
GMBA ... 240
Gráfico 27. Valor de las variables en los distintos centroides para 5 clusters (k=5)
... 256
Gráfico 28. Valor de las variables en los distintos centroides para 7 clusters (k=7)
... 256
Gráfico 29. Determinante por iteración ... 260
Gráfico 30. Perfil de las clases ... 269
Gráfico 31. Posicionamiento en ejes de cada Escuela de Negocios, variables
Weighted Salary (US$) y Salary Percentage Increase ... 275
Gráfico 32. Comparativa escalas: posición ranking - valor ideal ... 346
Gráfico 33. Dendograma. Continuo académico-profesional ... 355
23
Gráfico 35. Dendograma inicial. Modelo autoridad y relevancia páginas web de
Escuelas de Negocio, datos de partida ... 405
Gráfico 36. Dendograma. Modelo autoridad y relevancia páginas web de Escuelas
de Negocio, datos agrupados ... 411
Gráfico 37. Dendograma del análisis cluster jerarquizado. Modelo autoridad y
relevancia en redes sociales ... 429
25
SUMMARY
Research aims
This thesis aimed to establish a classification of the leading Business Schools in the
world according to their strategy, as reflected in their performance profile in the
different criteria of the rankings (as long as it could contribute to forming their
own identity as an educational institution), and the main manifestations of their
marketing mix:
- product – their position in the academic–professional continuum, as
described by Wedlin (2006);
- placement – their online Masters in Business Administration programmes
(MBAs);
- price and duration (effort) – their tuition fees and programme length as
the main expression of the financial and time investment required; and
- a special focus on communication, in terms of
o their website authority and
26
Although this research targeted Business Schools, the MBA programme had been
used as a comparable reference among the different institutions (when
appropriate) as their flagship programme, sharing common features all over the
world. The scope of this research encompassed the leading Business Schools
globally, recognised as such in the most influential industry rankings, mainly the
Financial Times’ latest editions of the rankings of the Global MBA, Executive MBA (EMBA), MSc (Master of Science) in Finance, MSc in Management, Online MBA,
Executive Education Open Programmes and Executive Education Custom
Programmes.
To investigate the profiles and components of the different groups in our
classification, we first conducted partial groupings in each of the above-mentioned
fields. Subsequently, we put together all the gathered information to build two
different combined models for a final classification of the Business Schools. The
first combined model simply recalled the different clusters in which each Business
School had been included in the different chapters of this paper so that a final
profile could easily be visualised for each institution throughout the analysis. The
second model included the raw data from selected variables measured in the
previous analysis within a single model. Thus, we had a comprehensive table with
which we could conduct a joint cluster analysis, from which a final classification of
the Business Schools emerged.
The statistical method used for this research was cluster analysis since it best fit
the research aims, which (as shown) included elaborating on the classification of
27
but as an iterative method, it requires the use of software tools to perform the
multiple calculations needed. The software tools that we used for this purpose
were SPSS and XLStat.
Main conclusions on the literature review
The concept of a Business School is not clearly defined in the academic literature.
Although some approaches may be found, to understand the meaning of a
Business School, we must point to the documents prepared by the associations
operating in the sector and by the accreditation-granting institutions. These
documents provide thorough descriptions of the requisites for a Business School
to obtain the relevant accreditation or to join an association in terms of
programmes offered, duration, awarding of degrees, curricula, faculty,
organisation or financial sustainability.
The description of the concept is so extensive that a single, brief definition cannot
be offered. According to the Association to Advance Collegiate Schools of Business
(AACSB, 2015), it had 1,384 member institutions as of February 2015. The number
of educational institutions worldwide that offered business administration
degrees at that time was estimated at 16,484.
We followed Kaplan’s (2014) explanation about the history of the Business
28
period (1819–1944). During that era, many Business Schools were created according to two models – ‘‘southern’’ (led by France and Belgium) and
‘‘northern’’ (led by Germany). The second period (assimilation period) started after World War II and is now characterised by some trends, such as globalisation
and increasing emphasis on scientific research. According to Sass (1982), Business
Schools in the United States (US), since their establishment, were less focused on
the curricula and the influx of international students than their counterparts in
Europe.
Business Schools normally offer a wide variety of programmes, but not all of them
offer undergraduate programmes. Many deliver various MSc degrees and
virtually, they all offer at least an MBA, mostly in the full-time 1- or 2-year format.
On the executive side, the majority of them offer an EMBA programme, and a
growing number also provide executive education programmes, either open or
custom types. Because the MBA is the most common and universally renowned
programme, in this research, we sometimes used the MBA as the most commonly
shared reference for comparing the activities of the Business Schools when other
information was unavailable. Therefore, in some cases, we compared Business
Schools as a whole; at other times, we compared MBAs as their flagship
programme when no comparable data was available.
Many authors have agreed that the Business School sector is facing a period of
disruptive changes coming from several trends, such as globalisation, new
technologies that make possible innovative forms of delivery (including blended
29
less geographic barriers. Many authors and institutions have stressed different
aspects of this disruptive period, focusing on the challenges for the Business
Schools over the next several years. This thesis identifies different ways in which
Business Schools are positioning themselves in the sector and their responses
towards the foreseeable changes and their new challenges.
For that purpose we have followed Wedlin (2006) when stating that rankings
constitute a crucial factor to both shape and reflect the specific identity of
Business Schools as educational institutions. According to this author, the
authority of the rankings to evaluate and judge organisations depends on their
ability to create templates (rankings define characteristics and criteria for evaluating members of the field which are commonly used and recognised for
identity-formation) and positions (the rankings result in a final list in which fields and boundaries are defined, including and excluding members). A third theme,
authonomy, emerges as an extension of the first two, as consequently rankings constitute a field for the struggle of the hierarchies implicit in the classifications.
We have also discussed different approaches to the strategy of Business Schools
in the academic literature. Finally, we have also examined the various concepts of
marketing-mix developed through the years and concluded that McCarthy´s
(1964) traditional “4 Ps” model (product, price, placement and promotion) could
still be adopted for the aims of this research, as it provided a useful and simple
framework in which the main aspects of the marketing in Business Schools could
30 Scope
The ambit of the research was ambitious. About 225 Business Schools from 45
countries and 5 continents were included in at least one cluster throughout the
analysis. To determine our classification criteria, we focused on the Business
Schools’ performance in the 20 criteria items included in the Financial Times’
Global MBA ranking, following Wedlin (2006). We also concentrated on their
marketing mix variables, which, in their most classical form, included product
(position in the academic–professional continuum), placement (whether or not
they offer online MBAs), price (including not only the financial dimension but also
the investment in terms of time, that is, the duration of the MBA), and promotion
or communication (in terms of website relevance and social network activity).
Research questions
Main question
Q.0. Which groups could be identified as among the leading Business Schools
worldwide with regard to their identity and competitive differentiation in terms of
their performance in rankings and their marketing mix, particularly their global
communication function through their websites and social networks?
Q.0.1. What would be the differential characteristics of each group’s
profile?
31 Subquestions
Q.1. Which groups could be identified as among the leading Business Schools
worldwide in terms of their identity and competitive differentiation, as reflected
in the Financial Times’ latest global MBA ranking?
Q.1.1. What would be the differential characteristics of each group’s
profile?
Q.1.2. Which Business Schools would be included in each group?
Q.2. Which groups could be identified as among the leading Business Schools
worldwide in terms of their position in the academic–professional continuum?
Q.2.1. What would be the differential characteristics of each group’s
profile?
Q.2.2. Which Business Schools would be included in each group?
Q.3. Which groups could be identified as among the leading Business Schools
worldwide in terms of their online MBA offering?
Q.3.1. What would be the differential characteristics of each group’s
profile?
32
Q.4. Which groups could be identified as among the leading Business Schools
worldwide in terms of the cost and time investment required from their MBA
students?
Q.4.1. What would be the differential characteristics of each group’s
profile?
Q.4.2. Which Business Schools would be included in each group?
Q.5. Which groups could be identified as among the leading Business Schools
worldwide in terms of their role in global communication, particularly the
authority and relevance of their websites?
Q.5.1. What would be the differential characteristics of each group’s
profile?
Q.5.2. Which Business Schools would be included in each group?
Q.6. Which groups could be identified as among the leading Business Schools
worldwide in terms of their role in global communication, specifically the authority
and relevance of their social network activities?
Q.6.1. What would be the differential characteristics of each group’s
profile?
33 Methodology
As mentioned, cluster analysis was chosen as the most appropriate statistical
method to classify the different Business Schools and identify and describe the
groups. The specific tools chosen were the hierarchical cluster analysis in the first
step (to have the first assessment of the population structure and the number of
clusters that could be reasonable) and the k-median cluster analysis, the most
classical one, in the second step (to form the groups based on the internal
similarity and external dissimilarity of their components). This statistical method
maximised the principle of classification, which assured that the Business Schools
grouped into a cluster are similar to one another (in terms of Euclidean distance)
and different from those included in other clusters.
The research used a mixed quantitative–qualitative approach. On one hand, the
method chosen (cluster analysis) was purely quantitative, based on comparing the
Euclidean distances among the Business Schools across the different variables
considered. On the other hand, the model’s design and the decisions about how
to build the variables included in it mostly used a qualitative approach. In fact, as
a statistical tool, cluster analysis includes some crucial decisions that must be
made from a qualitative viewpoint, for example, the number of clusters
considered (k) in order to make them significant for the research aims. Moreover,
the concept itself of a classification of Business Schools is a social construct (in fact,
the concept itself of Business Schools as a category is also a social construct).
Consequently, what led us to focus on a social constructivism methodology –
compatible (Crotty, 1988, pp. 4–9) to an interpretivist perspective – as the main
34
be subject to the same investigation methods applied to the physical and natural
world, provided that the social world [would be] interpreted by those involved in
it (Burr, 2003).
Findings
As the research progressed, different clusters were defined for each of the partial
models designed:
Performance profile in rankings
Cluster 1.1: leaders USA
Cluster 1.2: leaders Europe
Cluster 1.3: China (+ 1 India)
Cluster 1.4: followers USA 1 - consistent
Cluster 1.5: global followers 1 - consistent
Cluster 1.6: followers USA 2 - inconsistent
Cluster 1.7: global followers 2 - inconsistent
Position in the academy-professional continuum
Cluster 2.1: Business Schools focused on the Global MBA
Cluster 2.2: Business Schools with strengths in Executive Education
35
Cluster 2.4: Balanced, wide-scoped Business Schools
Cluster 2.5: Business School with strengths in the MSc
Online MBA
Cluster 3.1: Business Schools that offer an online MBA listed in rankings
Cluster 3.2: Business Schools that do not offer an online MBA listed in rankings
Investment: Price and duration
Cluster 4.1: Leading MBAs that require high investment in finance and time
Cluster 4.2: Long duration and moderate price MBAs
Cluster 4.3: "Value for money and time" MBAs
Cluster 4.4: Lower investment MBAs
Global communication I: Web site
Cluster 5.1: Leading web sites
Cluster 5.2: Web sites with limited authority
Cluster 5.3: Web sites with problems of authority
36
Global communication II: Social Networks
Cluster 6.1, 6.3 y 6.5: “outliers”, extreme cases of remarkable authority in social
networks
Cluster 6.2: “outliers” with higher authority in Facebook
Cluster 6.4: Balanced Business Schools in Social Networks
Cluster 6.6: Business Schools with lower authority in social networks
Cluster 6.7: Business Schools with higher authority in LinkedIn and Twitter
In the last chapter of this thesis, we provide an overall outlook about the possible
classification of Business Schools according to all the variables, as previously
mentioned. This was done in two different ways that we will identify as Joint
model I and II:
Joint model I: cluster summary for each Business School
In this case, we simply put together all the clusters described throughout the thesis
in Table 1, which presents in a visual form how each Business School is included or
not in each cluster. This provides a graphic profile of each Business School across
B us ine ss S cho o l R an k C o nt inu um O nl ine P ri ce -D ur at io n W eb So ci al n et wo rk s 1.1: le ad er s US A 1.2: le ad er s Eur o pe 1.3: Chi na ( + 1 Ind ia) 1.4: f o llo we rs US A 1 - co ns ist ent 1.5: g lo ba l f o llo we rs 1 - co ns is te nt 1.6: f o llo we rs US A 2 - inc o ns ist ent 1.7: g lo ba l f o llo we rs 2 inc o ns ist ent 2.1: B us ine ss Sc ho o ls fo cus ed o n the G lo ba l M B A 2.2: B us ine ss Sc ho o ls wi th st re ng ths in Exe cut iv e Educ at io n 2.3: B us ine ss Sc ho o ls wi th st re ng ths a ro un d the EMB A 2.4: B al an ce d, wi de -sc o pe d B us ine ss S cho o ls 2.5: B us ine ss Sc ho o l wi th st re ng ths in t he M Sc 3.1: B us ine ss Sc ho o ls tha t o ff er a n o n line M B A li st ed in ran ki 3.2: B us ine ss Sc ho o ls tha t d o n o t o ff e r a n o nl ine M B A li st ed 4.1: L ead ing M B A s tha t r equ ir e h ig h inv est m ent in fi na nc e a nd 4.2: L o ng d ur at io n an d m o de rat e p ri ce M B A s 4.3: "Val ue f o r m o ne y a nd t im e" M B A s 4.4: L o we r i nv est m ent M B A s 5.1: L ead ing we b si te s 5.2: W eb si te s wi th lim it ed au th o ri ty 5.3: W eb si te s wi th pr o bl em s o f a u th o ri ty 5.4: P ar ti cul ar ly we ll-lin ke d we b si te s 6.1, 6.3 y 6 .5: “o ut lie rs” , e xt re m e c as es o f re m ar kab le a ut ho ne two rk s 6.2: “o ut lie rs” wi th h ig he r a ut ho ri ty in Fac ebo o k 6.4: B al an ce d B us ine ss Sc ho o ls in So ci al N et wo rk s 6.6: B us ine ss Sc ho o ls wi th lo we r a ut h o ri ty in so ci al n et wo rk s 6.7: B us ine ss Sc ho o ls wi th h ig he r a ut ho ri ty in Li nk ed In a nd T
AGSM at UNSW Business School 5 2 2 3 3 6
Arizona State University: Carey 6 3 1 2 2 4
Babson College: Olin 4 1 1 2 2 4
Birmingham Business School 7 1 2 4 2 6
Boston College: Carroll 6 5 2 4 2 6 Boston University School of
Management 4 3 2 2 2 4
Carnegie Mellon: Tepper 6 1 2 1 2 6
38
Columbia Business School 1 3 2 1 2 7
Cornell University: Johnson 6 3 2 3 2 4
Cranfield School of Management 2 4 2 3 2 4
CUHK Business School 3 3 2 3 3 6
Dartmouth College: Tuck 1 1 2 1 1 4
Duke University: Fuqua 1 3 2 1 1 4
Durham University Business School 7 5 1 4 2 6
Emory University: Goizueta 6 3 2 2 2 6
Esade Business School 2 4 2 3 1 7 ESMT - European School of
Management and Technology 5 3 2 4 3 6 Fudan University School of
Management 3 3 2 4 3 6
George Washington University 5 1 1 2 2 6
Georgetown University: McDonough 6 3 2 2 2 4 Georgia Institute of Technology:
Scheller 4 1 2 2 2 6
Harvard Business School 1 2 2 1 1 1
HEC Paris 2 4 2 3 1 7
HKUST Business School 2 3 2 3 2 6
IE Business School 2 3 1 3 2 7
Iese Business School 2 3 2 2 4 7
IMD 2 3 2 2 1 5
Imperial College Business School 5 4 2 3 2 4 Indian Institute of Management,
Ahmedabad 4 4 2 4 2 2 Indian Institute of Management,
39
Indiana University: Kelley 6 1 1 2 1 4
Insead 2 3 2 3 1 5 Lancaster University Management
School 5 1 2 4 2 6
London Business School 2 4 2 2 1 3 Macquarie Graduate School of
Management 7 1 2 4 3 6
Manchester Business School 5 4 1 3 1 4
Mannheim Business School 5 4 2 4 3 6
McGill University: Desautels 5 1 2 3 2 6
Melbourne Business School 5 2 2 3 3 2
Michigan State University: Broad 6 1 2 2 2 6
MIT: Sloan 1 4 2 1 1 7
Nanyang Business School 5 3 2 4 2 4 National University of Singapore
Business School 5 3 2 4 3 6
New York University: Stern 1 3 2 1 4 4
Northwestern University: Kellogg 1 3 2 2 1 7
Ohio State University: Fisher 4 1 2 2 1 4
Pennsylvania State University: Smeal 4 1 2 3 2 6
Purdue University: Krannert 4 1 2 2 3 4
Queen's School of Business 5 3 2 3 1 6
Rice University: Jones 6 3 2 2 2 4 Rotterdam School of Management,
Erasmus University 2 4 2 4 2 4
SDA Bocconi 5 4 2 4 3 7
40
Stanford Graduate School of Business 1 1 2 1 1 3
Sungkyunkwan University GSB 7 1 2 4 3 6
The Lisbon MBA-Centrum Católica 7 3 1 4 3 6 The Lisbon MBA- Nova School of
Business and Economics 7 4 1 4 3 6
Tias Business School 5 4 2 4 3 6
UCLA: Anderson 1 3 2 2 1 4
University College Dublin: Smurfit 7 5 2 4 3 6
University of Alberta 5 3 2 4 2 6 University of Bath School of
Management 5 5 2 4 2 6 University of British Columbia:
Sauder 5 4 2 4 2 4 University of California at Berkeley:
Haas 1 1 2 2 2 7 University of California at Irvine:
Merage 6 1 2 2 2 4 University of California, San Diego:
Rady 4 1 2 2 2 4
University of Cambridge: Judge 2 3 2 3 2 4
University of Cape Town GSB 7 1 2 4 2 4
University of Chicago: Booth 1 3 2 1 1 7
University of Hong Kong 5 5 2 3 3 6 University of Illinois at
Urbana-Champaign 4 3 2 3 2 4
University of Iowa: Tippie 4 1 2 3 2 6
University of Maryland: Smith 6 3 2 2 2 4
University of Michigan: Ross 1 3 2 2 2 4
41
University of Notre Dame: Mendoza 4 1 2 2 3 6
University of Oxford: Saïd 2 4 2 3 2 2
University of Pennsylvania: Wharton 1 3 2 1 1 3
University of Pittsburgh: Katz 4 3 2 3 2 6
University of Rochester: Simon 4 5 2 2 2 6 University of San Diego School of
Business Administration 5 1 2 3 2 6
University of South Carolina: Moore 5 1 2 3 3 6 University of Southern California:
Marshall 6 1 2 1 1 6
University of St Gallen 2 4 2 3 2 4 University of Strathclyde Business
School 5 5 1 4 2 6 University of Texas at Austin:
McCombs 6 1 2 4 2 4
University of Toronto: Rotman 5 3 2 2 4 4
University of Virginia: Darden 6 2 2 1 1 4
University of Washington: Foster 6 3 2 2 3 6
Vanderbilt University: Owen 6 1 2 2 2 6
Vlerick Business School 5 4 2 4 3 4
Warwick Business School 2 3 1 3 3 4
Washington University: Olin 4 4 2 2 2 6
Western University: Ivey 7 2 2 3 1 4
Wisconsin School of Business 6 1 2 3 2 4
As a result of the different analyses performed throughout the research, a group
of variables was defined, and a lot of information was gathered. With all this
information, a final analysis was conducted by placing together all the variables
within a joint model that would examine the different criteria at the same time.
The variables included in this capstone global analysis were:
Rankings: based on the groups made by the Financial Times of the 20 criteria
included in its Global MBA ranking:
- GMBA Value: average of the criteria related to the value delivered by the MBA in terms of the variables Weighted salary, Salary increase, Value for
Money, Career progress, Aims achieved, Placement success, Employed at
three months and Alumni recommend.
- GMBA Diversity: which include the criteria related to curricula and faculty diversity, as well as with students diversity, all of them in terms of
internationality and gender (Female faculty, Female students, Women
board, International faculty, International students, International board,
International mobility, International course experience y Languages)
- GMBA Idea generation: finally, this groups the criteria about doctorates and research capabilities (Faculty with doctorates, FT doctoral Rank, FT
43
Programmes profile (positioning within the academic-professional continuum):
this results from the rankings of the different programmes evaluated by the
Financial Times, in order to assess the higher closeness of every Business School
to the academic edge (represented by the “younger profile” MSc) or to the
professional side (Executive Education):
- MSc
- Global MBA
- EMBA
- EXED Open
- EXED Custom
Placement: position in the most important on-line MBA ranking: Financial Times
and QS Ranking.
- MBA Online
Investment: “effort” required by the Full time MBA programmes in terms of price
(tuition and fees, converted to Euros) and duration (length of the programme).
- MBA price euros
- Years
Web site relevance, with three different measures
- COMBINED WEB AUTHORITY: averaging the root domain, the Business School and the full time MBA web sites, as provided by the on-line
44
- COMBINED WEB LINKS: number of links from the Interned pointing at the Business School and the Full time MBA web site
- COMBINED SOC NET LINKS: how these web site are linked on the social networks
Relevance of the activity in social networks: authority and activity according to
the data gathered and to the on-line statistical tool Followerwonk
- LinkedIn Followers
- Twitter global: which averages the authority according to Followerwonk and an estimation of the impact power of the user (followers and tweets)
- Facebook global: which averages the “likes” and the “talking” as of mid July 2015
Once these variables were combined in a single model, SPSS proposed the
45
Table 2. Centroids of the final clusters
Values for the final centroids
Variables
Cluster
1 2 3 4 5 6 7
GMBA Value 2,2 1,2 0,2 1,6 -0,2 -0,7 0,9 GMBA Diversity 0,4 -1,5 1,2 0,6 -0,8 0,4 0,2 GMBA Idea 1,8 -0,8 0,1 2 -0,3 -0,3 0,9 MSc -0,6 0,5 1,6 0,6 -0,5 0,3 -0,6 GMBA 1,7 0,7 0,6 1,6 -0,4 -0,5 0,9 EMBA -1,1 -1,1 0,7 0,1 -0,4 -0,2 1 EXED Open 1,6 -0,8 0,5 1,4 -0,7 -0,1 1,1 EXED Custom 1,3 -0,4 0,6 0,7 -0,5 -0,1 0,9 Online -0,3 -0,3 0,7 -0,3 0 0 -0,3 MBA price euros -2,2 1,5 0,5 -1,6 -0,5 1 -0,7 Years -0,9 0,1 1,2 -0,6 -0,7 0,7 -0,1 COMBINED WEB AUTHORITY 1,4 -0,4 0 1,3 0,3 -0,9 0,5
COMBINED WEB LINKS 0 -0,2 0,2 1 -0,3 -0,5 1,4 COMBINED SOC NET LINKS 3,2 0,3 0,1 1,7 -0,4 -0,3 0,8 LinkedIn Followers 6,3 0 0,5 1,9 -0,4 -0,4 0,6 Twitter authority 2 -0,2 0,6 2,5 0 -0,9 0,5 Facebook authority 5,6 2 0,1 2,1 -0,4 -0,2 0
In summary, the relevant results for the different clusters in terms of the number
of components, average position in the global MBA ranking, and average distance
from the centroid of their different components (as a measure of the internal
46
Table 3. Characteristics of the final clusters
Averages
Cluster
Number of Business
Schools
Ranking Distance to the centroid
1 1 1,0 0,0
2 2 29,5 2,3
3 12 34,0 2,9
4 4 4,3 3,4
5 38 62,4 2,4
6 28 65,6 3,2
7 15 23,8 3,3
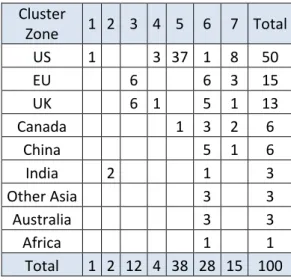
Finally, with respect to their geographic location, the results for each cluster were:
Table 4. Geographical location of the Business Schools in the final clusters
Cluster
Zone 1 2 3 4 5 6 7 Total
US 1 3 37 1 8 50
EU 6 6 3 15
UK 6 1 5 1 13
Canada 1 3 2 6
China 5 1 6
India 2 1 3
Other Asia 3 3
Australia 3 3
Africa 1 1
Total 1 2 12 4 38 28 15 100
According to these findings, the components of each cluster and their group
47
Cluster 0.1: Harvard Business School
The first cluster has a single member – Harvard Business School (HBS). As shown
in the dendogram in graph 38, the distance between HBS and the other schools
immediately separates this extreme case from the rest, as it cannot be assimilated
easily to any other Business School. Its privileged position in the Global MBA
ranking and the fact that it neither offers an MSc nor an EMBA programme but
shows intense activity in executive education make HBS stand out from the rest.
Furthermore, the highest investment required from its full-time MBA students (in
both cost and duration of 2 years), the outstanding authority of its website and
even more, its activity in social networks, form a very peculiar profile.
Cluster 0.2: Two Indian Business Schools
Again, the cluster analysis tool SPSS proposes this classification with surprising
precision if we consider that it completely ignores the geographic placement of
the schools classified, guiding itself only by the similarity of their performance
throughout the different variables. In this case, it separates two Indian Business
Schools (Indian Institute of Management, Ahmedabad and Indian School of
Business) from the rest. They share a high score in the “value” variable in their
GMBA ranking although they also show worse results in the rest of the variables
related to “diversity” and “generation of ideas”. These schools clearly focus on the
academic end of the continuum. They also do not demand high investment from
students, mainly in terms of the cost, and they seem to give more emphasis on the
communication potential of social networks (particularly Facebook) than on the
48
Cluster 0.3: European Business Schools with a balanced profile
SPSS proposes another cluster with an intense geographic component since the
schools included in this cluster are all European. They share the fact of not being
in the “top 10” of the GMBA ranking but in the “top 50” (except one of them).
Occupying an intermediate position in the ranking, these Business Schools have
succeeded in their offerings to the market, basically based on the diversity of their
GMBA programmes but also maintaining a good level in the “value” and
“generation of ideas” variables. Characteristically, although their strength seems
to lie clearly in their MSc scope, they also offer programmes in all the levels of the
academic–professional continuum (some of them even have online programmes).
Their required investment is low, as they normally offer 1-year MBAs. They keep
an average to high level of communication activity on their websites, as well as in
social networks, mainly those that the studies of CarringtonCrisp (“Tomorrow’s MBA 2013. The New Diversity”) and the Graduate Management Admission Council GMAC (“mba.com Prospective Students Survey” 2015) identified as more relevant for prospective students, LinkedIn and Twitter. Table 5 shows the Business Schools
included in this group and also the distance that separates them from the centroid
49
Table 5. Business Schools in cluster 0.3
Position in GMBA
ranking School name Cluster Distance
12 IE Business School 3 4,766
16 HEC Paris 3 3,321
19 Esade Business School 3 2,817
22 University of Oxford: Saïd 3 3,012
27 SDA Bocconi 3 2,285
34 Imperial College Business School 3 2,470
35 Manchester Business School 3 3,242
38 Warwick Business School 3 4,210
45 Rotterdam School of Management, Erasmus
University 3 2,287
46 City University: Cass 3 2,570
47 Cranfield School of Management 3 2,079
67 University of St Gallen 3 2,321
Cluster 0.4: US and UK Business Schools with high value and investment
requirements
This cluster displays the highest dispersion of all; with only four members, it seems
to indicate a low internal similarity. For this reason, the conclusions on its common
profile should be taken more relatively than in other groups. Nonetheless, these
cases seem very similar to that of HBS since these institutions are mainly leaders
50
Table 6. Business Schools in cluster 0.4
Position in GMBA ranking School name Cluster Distance
2 London Business School 4 3,343
3 University of Pennsylvania: Wharton 4 3,181 4 Stanford Graduate School of Business 4 3,538
8 MIT: Sloan 4 3,360
According to the results of the analysis and despite the warning regarding the high
dispersion, the common characteristic of all these institutions is that they show
excellent results in the GMBA ranking, based particularly on doctoral and research
performance, without forgetting the variables related to “value”. Similar to HBS,
their strengths lie mainly in their MBA and executive education programmes
although, in contrast to that school, they also generally offer programmes at EMBA
and MSc levels. Their degree of investment and commitment is equally
outstanding. Their communication activities are remarkable on both their
respective websites and social networks, mainly on Twitter.
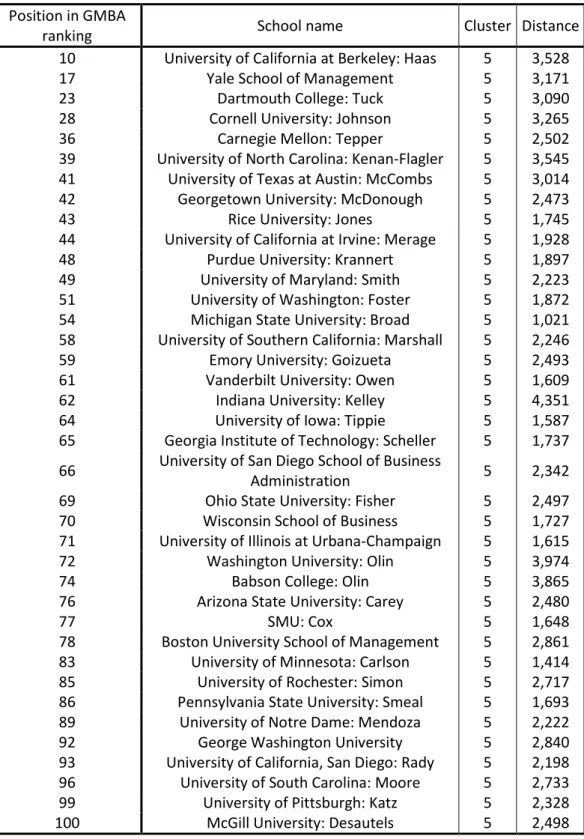
Cluster 0.5: US Business Schools at a crossroads
With a low relative internal dispersion, the schools in this cluster are mostly from
the US. In this cluster, SPSS groups 37 US schools with negative (or nearly negative)
scores in almost all variables, except for “web authority”. Mostly, they opt for the
2-year programmes. Consequently, they require a higher financial investment. On
the other hand, according to the rankings data, they deliver a lower value than
those of other Business Schools that require lower investments, which might lead
to some reflection. Their activities on Twitter could be considered average; in the
51
Table 7. Business Schools in cluster 0.5
Position in GMBA
ranking School name Cluster Distance
10 University of California at Berkeley: Haas 5 3,528
17 Yale School of Management 5 3,171
23 Dartmouth College: Tuck 5 3,090
28 Cornell University: Johnson 5 3,265
36 Carnegie Mellon: Tepper 5 2,502
39 University of North Carolina: Kenan-Flagler 5 3,545 41 University of Texas at Austin: McCombs 5 3,014
42 Georgetown University: McDonough 5 2,473
43 Rice University: Jones 5 1,745
44 University of California at Irvine: Merage 5 1,928
48 Purdue University: Krannert 5 1,897
49 University of Maryland: Smith 5 2,223
51 University of Washington: Foster 5 1,872
54 Michigan State University: Broad 5 1,021
58 University of Southern California: Marshall 5 2,246
59 Emory University: Goizueta 5 2,493
61 Vanderbilt University: Owen 5 1,609
62 Indiana University: Kelley 5 4,351
64 University of Iowa: Tippie 5 1,587
65 Georgia Institute of Technology: Scheller 5 1,737 66 University of San Diego School of Business
Administration 5 2,342
69 Ohio State University: Fisher 5 2,497
70 Wisconsin School of Business 5 1,727
71 University of Illinois at Urbana-Champaign 5 1,615
72 Washington University: Olin 5 3,974
74 Babson College: Olin 5 3,865
76 Arizona State University: Carey 5 2,480
77 SMU: Cox 5 1,648
78 Boston University School of Management 5 2,861
83 University of Minnesota: Carlson 5 1,414
85 University of Rochester: Simon 5 2,717
86 Pennsylvania State University: Smeal 5 1,693 89 University of Notre Dame: Mendoza 5 2,222
92 George Washington University 5 2,840
93 University of California, San Diego: Rady 5 2,198 96 University of South Carolina: Moore 5 2,733
99 University of Pittsburgh: Katz 5 2,328
52
Cluster 0.6: Business Schools with low investment requirements and lower value
Coming from very different geographic areas, these schools show a common
characteristic – a profile in their GMBA ranking that combines a low “value” and
low potential in “idea generation” (in the context of the given definition of these
complex variables) with a medium to high “diversity”. This is in exchange for their
students’ small investment, particularly in financial terms. They seem focused on
more academic and less professional programmes, and their communication
53
Tabla 8. Business Schools in cluster 0.6
Position in GMBA
ranking School name Cluster Distance
14 HKUST Business School 6 3,566
29 University of Hong Kong 6 2,754
30 CUHK Business School 6 3,257
31 National University of Singapore Business
School 6 3,323
37 The Lisbon MBA (Averaged) 6 3,855
40 Nanyang Business School 6 2,980
50 Lancaster University Management School 6 2,672
52 University of Cape Town GSB 6 3,595
55 Mannheim Business School 6 3,016
56 Fudan University School of Management 6 3,207 57 Shanghai Jiao Tong University: Antai 6 3,889
60 Sungkyunkwan University GSB 6 3,198
63 ESMT - European School of Management and
Technology 6 3,006
68 Macquarie Graduate School of Management 6 2,819 73 University College Dublin: Smurfit 6 2,430
75 AGSM at UNSW Business School 6 2,286
79 Durham University Business School 6 4,040 80 University of Strathclyde Business School 6 3,325 81 University of British Columbia: Sauder 6 3,615 82 Indian Institute of Management, Bangalore 6 4,097 84 University of Bath School of Management 6 2,460
87 Queen's School of Business 6 3,493
88 University of Alberta 6 2,486
90 Melbourne Business School 6 5,271
91 Boston College: Carroll 6 2,966
94 Vlerick Business School 6 2,816
95 Birmingham Business School 6 2,856
54
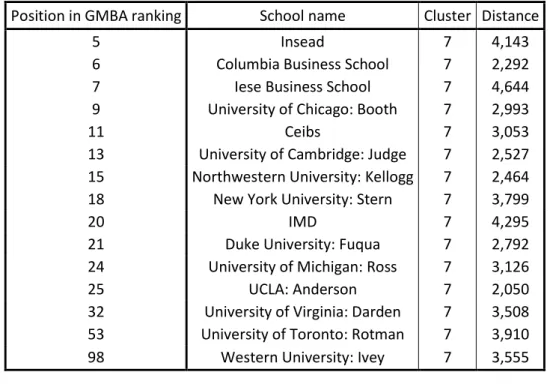
Cluster 0.7: Professional Business Schools with high investment effort required
Finally, this cluster brings together schools whose activities are closer to the
professional end of the spectrum. Their full-time MBA programmes are listed in
privileged positions in the rankings (typically among the top 25), highlighting the
variables related to “value” and “idea generation”. The investment effort on the
part of the students is medium to high, especially in the financial aspect of tuition
fees. The duration of their full-time MBA programmes is either 2 years for some
Business Schools and 1 year for others. Their websites are particularly well linked
to other relevant sites on the Internet, and they show more intense activities in
the most important networks (LinkedIn and Twitter), as reported in the GMAC
(2015) and CarringtonCrisp studies (2013) mentioned above. All schools included
in this cluster are based in Western countries, except the China Europe
International Business School (CEIBS), which shares a common approach to
Western schools (as mentioned, although CEIBS is a Chinese school, this project is
backed by several members of the European Foundation for Management
55
Tabla 9. Business Schools in cluster 0.7
Position in GMBA ranking School name Cluster Distance
5 Insead 7 4,143
6 Columbia Business School 7 2,292
7 Iese Business School 7 4,644
9 University of Chicago: Booth 7 2,993
11 Ceibs 7 3,053
13 University of Cambridge: Judge 7 2,527 15 Northwestern University: Kellogg 7 2,464 18 New York University: Stern 7 3,799
20 IMD 7 4,295
21 Duke University: Fuqua 7 2,792
24 University of Michigan: Ross 7 3,126
25 UCLA: Anderson 7 2,050
32 University of Virginia: Darden 7 3,508 53 University of Toronto: Rotman 7 3,910
98 Western University: Ivey 7 3,555
This analysis was completed by producing a dissimilarity matrix (Appendix 13)
that presents the Euclidean distance of each Business School with respect to all
the others. As a result of this matrix, it is easy to visualise how near or far any
Business School is to or from any other and therefore, to what extent their
57
CAPÍTULO 1: INTRODUCCIÓN
Las Escuelas de Negocio son agentes recientes en el sector de la Educación
Superior y, a pesar de ello, su pujanza en los últimos tiempos ha venido siendo
cada vez más destacada. La literatura científica se ha hecho eco de esa tendencia.
Thomas y Wilson (2011, p. 444) hacen notar la expansión del ámbito de las
Escuelas de Negocio, “a feature of which has been to make Business Schools a Business in their own right”. Ciertamente, el desarrollo económico de las Escuelas de Negocio, su estrecha competencia, el que a menudo supongan una buena
fuente de ingresos para las Universidades o entidades privadas a las cuales
pertenecen y su particular relación con el mundo de los negocios ha llevado a
algunos autores a afirmar que estamos ante un negocio en sí mismo. De este
modo, Pfeffer y Fong (2002) afirman que “It is a truism to say that business schools and business education are big business”.
Esta doble naturaleza, próxima a la Universidad y al negocio, hizo afirmar a Wilson
y Thomas (2012) que “this creates a series of tensions which have been increasing
58
necesariamente se entremezclan criterios formativos, investigadores y
empresariales que es preciso armonizar de la mejor forma posible, a fin de ganar
en sostenibilidad económica a la vez que en legitimación académica y social. A este
respecto, Trieschmann, Dennis, Northcraft y Niemi (2000) demostraron que los
factores académicos que hacen excelente a una Escuela de Negocios en lo que se
refiere a la investigación (“number of faculty, the proportion of full professors, the proportion of assistant professors and editorships”) son en parte distintos a los que les hacen destacar con su programa Master in Business Administration, MBA
(“budget per faculty member and the proportion of full professors”). De igual modo, Siemens, Burton, Jensen y Mendoza (2005) demostraron que, si bien existe
una correlación en los programas de grado entre productividad investigadora y
rankings, esa relación era muy inferior e nivel de programas Master.
Muchos son los autores que se han preguntado sobre la el papel de las Escuelas
de Negocio en al mundo actual y la fuente de su legitimación (Starley y Tempest,
2008; Thomas, 2012; Currie, Knights y Starkey, 2010). Khurana (2007) afirmó que
las Escuelas de Negocio, como empresas que son en sí mismas y por tanto
sometidas a las reglas de la competencia, “have not lived up to their promise and have sold out to the ‘tyranny of rankings’”. Esta necesidad de doble legitimación, académica y profesional, fue estudiada por Thomas y Wilson (2009), quienes
examinaron la lucha por la relevancia frente a la Universidad y frente al mundo de
los negocios y la dirección de empresas en ámbitos como los rankings académicos
centrados en la formación y la investigación, frente a los que destacan la
reputación gerencial y el progreso profesional de los estudiantes (como los del
Financial Times o la revista The Economist), así como la actividad regulatoria de
59
search for legitimacy may unwittingly create more homogeneity in the strategies of business schools and impact the development of alternative strategic choices about differentiating research and programs and improving linkages with the management community”.
Esta tensión interna y lucha por encontrar una legitimación clara encuentra su
contrapunto en un entorno cambiante, que ha sido descrito como disruptivo por
multitud de voces desde la academia y la práctica profesional que más tarde
analizaremos. Fundamentalmente los cambios proceden de la aparición de nuevas
tecnologías que permiten el mejor aprovechamiento de Internet como
herramienta formativa, con la aparición de nuevas formas de enseñanza en la
formación en negocios como son la conocida como “blended education” (parte
presencial, apoyada con otra parte on-line) y últimamente los MOOCs (Massive
On-line Open Courses), que llevan a tener cientos de miles de participantes en
cada curso individual. Pero no solo eso. Las necesidades cambiantes de las nuevas
generaciones (el paso de los “baby boomers” a la “Generación X” y más
recientemente los “Millenials”) reclama igualmente un cambio hacia la
flexibilidad, la modularización, la globalización y la formación entendida como un
continuo a lo largo de toda la carrera profesional, entre otras tendencias que
igualmente analizaremos.
Ante esta situación, el propósito de esta tesis se centra en indagar qué respuestas
están dando las Escuelas de Negocio a esta realidad actual del mercado en
términos de diferenciación competitiva, así como qué estrategias de marketing y