What makes a big demonstration? Exploring the impact of mobilization strategies on the size of demonstrations
20
0
0
Texto completo
(2) SOCIAL MOVEMENT STUDIES 2019, VOL. 18, NO. 2, 233–251 https://doi.org/10.1080/14742837.2018.1532285. What makes a big demonstration? Exploring the impact of mobilization strategies on the size of demonstrations Nicolás M. Somma. a. and Rodrigo M. Medel. b. a. Instituto de Sociología, Pontificia Universidad Católica de Chile; bInstituto de Ciencia Política, Pontificia Universidad Católica de Chile ABSTRACT. ARTICLE HISTORY. Massive demonstrations are the staple of powerful social movements, but research on the factors affecting the size of demonstrations (in terms of number of attendants) is almost nonexistent. Why do some demonstrations pack long avenues with masses of people while other ones barely fill a street corner? Combining resource mobilization, political opportunity, and framing theories, we argue that mobilization strategies – the sequence of decisions and actions taken by protest organizers before staging a protest – shape demonstration size. Multivariate models with 937 Chilean demonstrations between 2000 and 2012 show that demonstrations are larger when they display more demands (especially universalistic demands), target the national government, attract more organizations (especially umbrella organizations), and mobilize cohesive groups with broad public support. We reinforce the internal validity of our argument using interviews with movement leaders and secondary research on Chilean society.. Received 21 July 2017 Accepted 18 September 2018 KEYWORDS. Collective protest; social movements; mobilization; demonstrations; protest event analysis; Chile. One of the main concerns of social movement leaders is to stage large demonstrations (Boekkooi, Klandermans, & van Stekelenburg, 2011, p. 223). Movements capable of filling streets and squares with thousands of supporters usually enjoy many advantages. Political authorities take them seriously because large movements cause disruption and may indirectly affect electoral outcomes (Biggs, 2016, p. 3; DeNardo, 1985; Walgrave, 2013). Large demonstrations are more likely to be covered by the mass media, therefore getting more attention to movement demands. As more people support the movement, bystanders may be more inclined to think it is worthwhile. Activists marching by thousands feel empowered and reinforce their emotional connection to the movement. Organizers believe they did a good job and prepare optimistically for the next assault. For all these reasons, the fate of social movements often depends on the massiveness of mobilizations – there is ‘power in numbers’, as DeNardo (1985) put it. According to Tilly (1993), one of the four defining aspects of social movements are ‘numbers’, understood as the ability to mobilize many people in public challenges against power holders. Numbers are indicated ‘by the size of demonstrations or petitions’ (Tilly, 1993, p. 14). A long pedigree of activists, from Lenin and Gramsci to Gandhi, and from Martin Luther King to Saul. CONTACT Nicolás M. Somma [email protected] Instituto de Sociología, Pontificia Universidad Católica de Chile, Av. Vicuña Mackenna 4860, Macul, Región Metropolitana, Chile © 2018 Informa UK Limited, trading as Taylor & Francis Group.
(3) 234. N. M. SOMMA AND R. M. MEDEL. Alinsky – let alone thousands of anonymous activists all over the world – wondered how to mobilize the largest number of people in the streets (Jasper, 2004, p. 4). Despite the theoretical and practical relevance of the topic, scholars have rarely attempted to understand why some demonstrations convoke more participants than other ones. Why did the March on Washington in 1963 or the calls against the American invasion in Iraq in 2003 convoke hundreds of thousands of people? Why do other demonstrations only convoke a few dozen? Our main purpose is to understand the sources of variation in the size of demonstrations – which are our unit of analysis. By doing so we follow Biggs’ recent call that ‘Modelling the size of protest events is a promising avenue for future research’ (2016, p. 25). Demonstrations are ‘legal or illegal gatherings of people in the public domain (squares or streets) voicing economic, social, or political claims’ (Walgrave, 2013, p. 347). Demonstration size is reflected in the estimated number of participants (i. e. people who attend the demonstration). We study demonstrations (rather than other protest tactics) because demonstrations are ‘the quintessential tactic’ (King & Soule, 2007, p. 415) and ‘the most visible face’ (Walgrave, 2013, p. 347) of social movements, and because demonstrations take place in large public spaces such as streets and squares – thus they are the most appropriate tactic for gathering large numbers of supporters. We are aware of only three studies attempting to explain variations in the size of collective protests. Lehman-Wilzig and Ungar (1985) found that in Israel during the 1960s the ‘magnitude’ of protest events – with size being one of its components – was shaped by several economic and political variables at the national level. Saunders (2014) recently found that demonstration size in Western Europe is related to more contingent factors such as whether there was a ‘trigger event’ or not, the relationship between protest organizers and the government, and the political salience of the issue. Disi (2016) found that student protests in Latin America during the 2000s were larger when they targeted the state, voiced reactive student demands, and were supported by political parties. Following Saunders and Disi, we focus on a set of factors linked to the ‘mobilization strategy’ of protest organizers. By mobilization strategy we refer to the sequence of decisions and actions taken by protest organizers with the purpose of staging a collective protest. This involves several issues that we discuss in detail below, including the mobilization of certain groups and organizations, and the definition of demands and targets. Using protest event analysis in Chile between 2000 and 2012, we find that variations in several components of mobilization strategies are strongly associated with variations in the size of demonstrations. While we cannot assert a causal impact, we present theoretical reasons and qualitative evidence that hint so. Our main contribution is to show that factors, which to a certain extent are under the influence of protest organizers, may have a powerful impact on the size of demonstrations. Protest organizers may be enthusiastic with our article. Regarding scope conditions, while the findings come from a single Latin American country, our argument about the relevance of mobilization strategies is general enough to be potentially useful for other contexts. In particular, it seems more plausible for demonstrations taking place in liberal democracies with active and variegated kinds of.
(4) SOCIAL MOVEMENT STUDIES. 235. social movements, as is the case for Chile. Our argument might be less useful for other contexts.. Protest organizers and mobilization strategies We broadly define protest organizers as a small group of individuals that take the lead in staging collective action. Social movement theories have conceptualized protest organizers from different lenses. In the resource mobilization tradition, SMOs depend on ‘issue entrepreneurs’ who define issues, goals and strategies for broad audiences. Such individuals can even manipulate grievances and discontent (McCarthy & Zald, 1977). Framing scholars argued that movement leaders are in charge of crafting collective action frames that resonate among the public and motivate participation (Snow, Rochford, Worden, & Benford, 1986). Formal models emphasize the need for a critical mass of individuals ‘intentionally trying to “make something happen” in pursuit of a social change goal’ (Oliver, 2013, p. 286). All these approaches agree that protest organizers exist and play a central role in collective action. When protest organizers plan a demonstration they deal with several issues. Which groups and/or organizations should be mobilized? What about making alliances with other people? If so, with whom? Which frames, slogans, and demands need to be voiced for attracting adherents and pressing the authorities? Who should be blamed for the problem that motivates the protest? Mobilization strategies do not happen in a vacuum, and protest organizers are constrained by context, culture and history (Jasper, 2004, p. 5; Boekkooi, 2012, p. 140). Yet these do not fully dictate what to do on every occasion. Activists do not ‘simply follow the scripts and routines they have learned in or from other movements’ (Jasper, 2013, p. 1264). They often have room for making deliberate choices (Boekkooi, 2012, p. 140), and such choices may be consequential. For instance, in a study about multi-country demonstrations against the Iraq invasion in 2003, Boekkooi et al. (2011) show that the type of mobilization strategy adopted by organizers in the early stages of the campaign shaped the kind of people that attended, their motivations, and their mobilization paths (also Boekkooi, 2012). Although they do not focus on demonstration size as we do, they note that the Dutch demonstration was smaller than those in other countries because its organizers were divided, thus delaying the onset of the campaign.. The argument: how mobilization strategies shape demonstration size Based on several strands of social movement research, below we explain why certain features of mobilization strategies could affect demonstration size. We focus on four aspects: the number of demands demonstrators display; the targets to which the demand or complaint is directed; the extent to which formal organizations are involved in the process; and the social groups that participate. Demands Demonstrators in Western societies can display a wide array of demands: from more funding to public education, abortion rights, and environmental protection, to higher.
(5) 236. N. M. SOMMA AND R. M. MEDEL. minimum wages, restriction to immigration, or the end of neoliberalism. A central issue in any mobilization strategy revolves around how much to ask (Gamson, 1975). Movement leaders spend precious time and energy discussing it. Based on Snow et al.’s (1986) notion of ‘frame extension’, we argue that the breadth of the demands raised by demonstrators should affect demonstration size. At some point, movement leaders ‘may have to extend the boundaries of its primary framework so as to encompass interests or points of view that are incidental to its primary objectives but of considerable salience to potential adherents’ (Snow et al., 1986, p. 472). Although frame extension may alienate preexisting supporters (Snow et al., 1986, p. 478; Benford & Snow, 2000, p. 625), protest organizers addressing a wider set of demands could persuade different kinds of people to take the streets, with this resulting in larger demonstrations. We conceive the breadth of the demands in two ways: first, as the number of demands (more demands indicate more breadth); and second, as the presence or absence of ‘universalistic’ demands (Sabucedo, Gómez-Román, Alzate, van Stekelenburg, & Klandermans, 2017), that is, demands that explicitly go beyond the interests of a particular group and encompass broader groups (such as stopping climate change or improving the quality of public education or health services). Ceteris paribus, we expect that: H1a. There is a positive association between the number of demands voiced in the demonstration and its size. H1b. Demonstrations with universalistic demands will be larger than those without them.. Targets By ‘protest target’ we mean the entity to which demonstrators direct their claims. A central component of any mobilization strategy is to define such a target. Sometimes this seems obvious, yet sometimes it is not (Benford & Snow, 2000, p. 615). We argue that the choice of the target is relevant for demonstration size. Until recently, researchers saw political authorities as the main targets of collective protests. Now it is clear that other entities – such as private companies (King & Soule, 2007) or religious, educational, and medical institutions (Soule, 2009) – can also be important targets. Specifically, we explore whether having the national government as a target affects demonstration size. We argue that demonstrations against the national government should attract more people than those without such a target (Disi, 2016). This is for three reasons. First, although the power of national governments has declined in recent decades (Walker, Martin, & McCarthy, 2008, p. 38), their decisions shape people’s lives on many issues – from wages to the environment, from immigration to the health system – in ways that may incubate grievances and motivate collective protest. The pool of people with potential reasons to demonstrate against the national government is thus considerably large (Walker et al., 2008). Second, national governments are resourceful and have extensive means (including legal attributions) to redress collective grievances. They can advance or obstruct legislation, make concessions to third parties, and provide material or symbolic resources to.
(6) SOCIAL MOVEMENT STUDIES. 237. movements (Walker et al., 2008). As governments can change things, people will demonstrate to persuade them to do so. Finally, because in democratic regimes national authorities seek votes and popularity, they have incentives to use their resources to solve collective problems. Although public trust on governments has been recently declining in several countries (Zmerli & Van der Meer, 2017), governments are still the most powerful and accountable actors when it comes to solving people’s collective problems. Protest organizers targeting national governments may bring to the streets many people that would otherwise remain at home. Thus: H2. Demonstrations targeting national governments are larger than those not doing so. We also explore the role of targeting sub-national governments and private companies because they are frequent protest targets. Yet, since they lack the resources and attributions of national governments, we do not expect them to have a noticeable impact on demonstration size. Formal organizations Should protest organizers resort to formal organizations or not for staging large demonstrations? This is a common dilemma (Jasper, 2004). Some demonstrations are heavily crafted from the beginning by organizations such as SMOs, churches, labor unions or student centers (Earl, 2015, p. 38). Other demonstrations arise more spontaneously, with little or no involvement of formal, stable organizations. Scholars have long debated the consequences of organizations for social movements (Gamson, 1975), but their impact on demonstration size is unclear. We expect that having formal organizations during the mobilization process boosts attendance – especially ‘umbrella’ organizations, which coordinate the work of many other lower-level organizations. First, organizations may bring their own members to the streets (Boekkooi et al., 2011; Earl, 2015). They spread the message of an upcoming protest among their members, motivate them to participate, and invite them explicitly to do so (Verba, Schlozman, Brady, & Brady, 1995). This may happen even within organizations not specialized in protest activities (Oberschall, 1973). Organizations also provide social selective incentives through friendship ties (McAdam, 1986) as well as psychological incentives (Olson, 1965). This motivates members to comply with collective action requests. Even if a relatively small proportion of the population belongs to formal organizations, activating them prior to the demonstration may make a noticeable difference in attendance. Organizations may also mobilize non-members, and in fact many demonstrators in Europe are not tied to organizations (Klandermans, van Stekelenburg, Damen, van Troost, & van Leeuwen, 2014). Organizations may distribute flyers in the streets, paste posters about upcoming demonstrations, advertise in the traditional and online media, and arrange buses for lowering the cost of attendance. Their members can also spread the message across their non-affiliated social networks, reaching variegated audiences and bringing to the streets people that otherwise would not show up (Boekkooi et al., 2011). Thus: H3a. Demonstrations with the participation of more organizations are larger than demonstrations with fewer organizations..
(7) 238. N. M. SOMMA AND R. M. MEDEL. H3b. Demonstrations with the participation of ‘umbrella’ organizations are larger than demonstrations without them.. Social groups By ‘social groups’ we refer to categories of people having something in common which serves as a basis for mobilization – e. g. university students, public workers, racial minorities, or residents of an affected locality. While we are interested in exploring the impact of participating groups on demonstration size, we recognize that this dimension is less about ‘strategy’ and more about ‘structure’ than the previous ones. Protest organizers often have stronger links to some groups than other ones, which restricts their room for choice. And because demonstrations are open events, organizers do not have complete control over the groups demonstrating. Having said that, demonstrators often try to mobilize specific groups through different mechanisms. They activate college networks to mobilize students, ally with labor unions to bring workers to the demonstration, or craft frames emphasizing racial oppression for getting racial minorities on board (Snow et al., 1986). Below we discuss four dimensions of groups that should matter for demonstration size, yet at this point we are interested in their combined rather than independent impact. First, groups vary in their sheer numbers. Demonstrations addressing the grievances of nominally large groups (e. g. women of a given country) may attract more people than those addressing the grievances of smaller groups (e. g. residents of a locality threatened by environmental hazards), thus increasing their size (Boekkooi, 2012, p. 13). Second, groups vary in their level of internal cohesion (Tilly 1978). Millions of people use public health systems, yet since they are weakly organized they rarely stage large demonstrations. However, smaller but more cohesive groups – such as miners or ethnic minorities living in ghettoes – may bring more people to the streets. Third, groups vary in their degree of biographical availability (McAdam, 1986). Groups with high biographical availability have few job and family responsibilities, enjoying more flexible schedules for protesting (e. g. youngsters or students). Demonstrations convoking these groups should be larger than those without them. We do not claim that the largest demonstrations will only have biographically available groups – in fact, large demonstrations tend to have a very heterogeneous group composition (Walgrave & Manssens, 2000). We focus on the impact of each specific group rather than on the whole composition of the demonstration. Finally, demonstrations should be larger when participating groups evoke high solidarity and empathy among the general public – even if the latter is not directly affected by the cause (McCarthy & Zald, 1977). This helps understand why whites supported African American mobilizations (McAdam, 1982), and why heterosexuals often attend gay parades. Conversely, demonstrations should be smaller when staged by widely despised groups (e. g. neo-Nazis) groups with collective action frames unrelated to mainstream culture (e. g. some religious sects), or groups barely known to the public at large (e. g. movements in isolated communities). Therefore:.
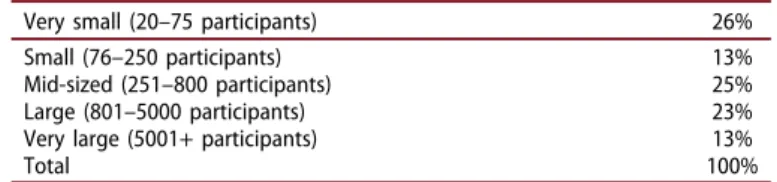
(8) SOCIAL MOVEMENT STUDIES. 239. H4. Demonstrations staged by groups which are large, cohesive, are accepted by the general public, and their members have high biographical availability, are larger than those staged by groups lacking these characteristics.. Size of demonstrations in Chile For testing these hypotheses, we employ a protest events dataset covering more than nine hundred demonstrations that took place across Chile between 2000 and 2012 (details below). We choose Chile for three reasons. First, protest event analysis is still relatively uncommon beyond Europe or the United States. Going beyond the northern advanced countries may shed light on new protest dynamics. Second, between 2000 and 2012 Chile saw hundreds of demonstrations staged by variegated movements, directed to different targets, and resulting from heterogeneous organizational structures and collective action frames (Somma & Medel, 2017). We believe that such diversity and vibrancy makes Chile an interesting case. Finally, we have better data to address our research question for Chile than for other countries. Specifically, we complement the protest event analysis with secondary sources and interviews with movement leaders in which we asked them about their mobilization strategies. This allows a more nuanced understanding of how mobilization strategies shape demonstration size. As Table 1 shows, the size of Chilean demonstrations varies drastically. While about one quarter of them are very small (between 20 and 75 participants), 13% are very large (more than 5,000 participants). Also, there are sizable proportions of demonstrations we label as ‘small’ (76–250 participants, 13% of all demonstrations), ‘mid-sized’ (251– 800, 25%), and ‘large’ (801–5,000, 23%). Below we try to make sense of these variations.. Data, variables and methods Dataset For exploring the determinants of demonstration size we resort to protest event analysis – a technique which uses qualitative descriptions for quantifying the attributes of protest events. Our study is an adaptation to the Chilean context of the Dynamics of Collective Action Project (DCAP, 2016), carried out in the United States by McAdam, McCarthy, Olzak and Soule. Four coders built a dataset of protest events taking place in Chile between January 1st, 2000, and August 31st, 2012. 1,032 of these events were coded as ‘demonstrations’ (‘marcha’, ‘manifestación’, and ‘movilización’ in Spanish). Table 1. Distribution of Chilean demonstrations (2000–2012) according to their estimated size (N = 937). Very small (20–75 participants) Small (76–250 participants) Mid-sized (251–800 participants) Large (801–5000 participants) Very large (5001+ participants) Total Source: protest events dataset. 26% 13% 25% 23% 13% 100%.
(9) 240. N. M. SOMMA AND R. M. MEDEL. We used the protest descriptions of the Chronologies of Protest of the Latin American Center of Social Sciences (CLACSO). They are based on a wide array of information sources, including not only mainstream newspapers of national scope, but also radios and websites of social movement organizations. For each event, coders filled out a questionnaire mostly composed of closed-ended questions very similar to those used in the DCAP. The coding process took approximately six months, requiring periodic group meetings as well as countless email and face-to-face exchanges for discussing coding issues. Inter-rater agreement was close to 90% for most variables. Protest event analysis is known for suffering from selection bias (Hutter, 2014; Ortiz, Myers, Walls, & Diaz, 2005) and our dataset is no exception. However, we suspect it provides an acceptable picture of the universe of Chilean demonstrations for three reasons. First, a comparison between our dataset and two other influential protest datasets – the Dynamics of Collective Action Project (DCAP) and Hanspeter Kriesi’s dataset on European movements – suggests that we have a comparatively good coverage of protest events (details in Somma, 2018). Second, since our dataset is based on variegated news sources, the biases from some sources may be compensated by the biases from other sources and vice versa (Hutter, 2014). Finally, since a general goal of demonstrations is to be covered by the mass media, selection bias should be lower than that regarding other protest tactics (e. g. strikes). Although smaller demonstrations tend to be underrepresented in protest event analyses, 26% of our demonstrations are very small (Table 1). Even if they were underrepresented, they comprise a sizable proportion of the demonstrations we analyze. It is also important to note that there are some variations across time in the sources used by CLACSO’s Chronologies of Protest. Most of the time CLACSO resorts to the two largest national newspapers (El Mercurio and La Tercera), ensuring an acceptable baseline coverage, yet it adds a third one (La Nación) from 2007 onwards. There is some variation too in the number of complementary sources. For minimizing its impact in our results, all multivariate models include one variable indicating the number of main, national-scope sources, and another one indicating the number of complementary sources. Dependent variable Our dependent variable is the size of the demonstration, as reflected in the estimated number of attendants reported by CLACSO. We logged this variable for reducing the disproportionate impact of outliers – for instance, about 1.5% of demonstrations gathered over 100,000 attendants. When CLACSO reported more than one figure for the same demonstration (e. g. diverging estimates by the police and the organizers) we used the average value. We made extensive internet searches for obtaining size estimates for demonstrations with missing information, but could not obtain a reasonable estimation for 9.2% of the 1,032 demonstrations, which therefore are not part of the analysis. All in all, we have size estimates for 937 demonstrations. We discarded 15 events with an estimated size of less than 20 people. They are too small to be considered demonstrations. Making precise estimations of the number of attendants in a demonstration is extremely difficult (Biggs, 2016, p. 8, McPhail & McCarthy, 2004). While researchers.
(10) SOCIAL MOVEMENT STUDIES. 241. often use attendance measures in their studies, no protest event analysis based on newspapers or kindred materials provides error-free measures of it. Our dataset is not an exception. Improving this measure is an important task for future research. Independent variables For testing H1a we use the number of demands displayed in the demonstration (none, one, two or more). ‘None’ is the reference category, which is contrasted against ‘one’ and ‘two or more’. For H1b, we use a dichotomous variable being 1 if the demonstration voices at least one ‘universalistic demand’ and 0 otherwise. For H2 (targets) we use three dummy variables indicating whether the demonstration targets (1) or not (0) the national government, regional or local governments, and private companies (a demonstration may have more than one target). For H3a (number of organizations in the demonstration) we consider three categories: no organization (reference category), one organization, and two or more organizations. For H3b we use a dummy variable indicating the presence in the demonstration of an umbrella organization (1) or not (0). Our dataset captures labor and student federations and confederations. We test H4 (groups) in two ways. Firstly, we use eight dummy variables indicating the presence (1) or absence (0) of eight social groups that routinely demonstrate in Chile: indigenous peoples, high school students, university students, public workers, private or self-employed workers, consumers and debtors, local residents and squatters, and environmentalists. In multivariate models, a significant coefficient for a group indicates the increase or decrease in demonstration size resulting from the addition of that group to the demonstration. Secondly, we built a variable indicating the extent to which the groups observed in each demonstration possess the four dimensions that, according to our discussion, affect demonstration size (group size, cohesion, biographical availability, and public acceptance). For this task we asked several Chilean social movement scholars to assign scores (0 = low, 1 = medium, 2 = high) to each group in each of the four dimensions, adding also our own judgments. Next we summed the dimension scores for each group and computed a variable indicating the average score for the groups in each demonstration (we use the average to prevent that demonstrations with more groups get artificially high values). Contextual factors We focus on the impact of mobilization strategies, but social movement theories – such as political opportunity, resource mobilization, and grievance theories – suggest that national contextual factors might affect demonstration size. We explored the role of contextual factors on demonstration size in two steps. First, because contextual factors (such as economic growth or the ideology of the incumbent party) vary across time, we investigated the extent to which variation in demonstration size depends on time-varying factors. Since demonstrations are nested in different time periods – such as months, trimesters, and years – we decomposed the variance of demonstration size associated to each period (Hox, Moerbeek, & van de Schoot, 2010, p. 15). The intraclass correlation coefficients of an ‘empty model’ suggest that a very small proportion of variance depends on factors varying across time – 4% for year, 3% for trimester, and 3% for month, assuming demonstrations nested in months, months nested in trimesters, and trimesters nested in years. When considering.
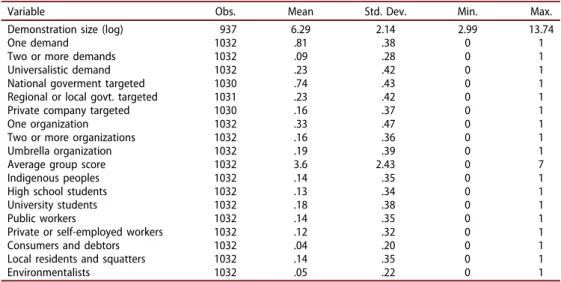
(11) 242. N. M. SOMMA AND R. M. MEDEL. each time period separately (e. g. demonstrations nested only in months), the proportions increase but they still are rather low – 5% for year, 7% for trimester, and 8% for month. This indicates that grouping demonstrations according to different time periods does not help much in understanding variation in demonstration size. We also examined the relationships between demonstration size and ten social, economic, and political conditions that vary nationally across time. Bivariate and multivariate analyses showed that relationships were almost always statistically insignificant (results available upon request). In any event, for reducing the risk of omitted variable bias, all regression models presented below include fixed effects for the trimester in which the demonstration took place (Walker et al., 2008, p. 52 for a similar strategy; we obtained very similar results using year or month fixed effects). Thus, we are confident that the relations between mobilization strategies and demonstration size reported below cannot be attributed to the many observable and unobservable factors changing across time. Table 2 presents descriptive statistics of the variables used in the analysis.. Modelling strategy Since the dependent variable is continuous, we use ordinary least squares (OLS) models. There were no collinearity problems among the independent variables: in the final and more demanding model (model 6 in Table 3), the maximum VIF among the variables of substantive interest is 2.33. Finally, although the trimester variables absorb the effect of time-changing factors, demonstrations within each trimester are not independent from each other and thus errors may be correlated. To take this into account we cluster observations by trimester and use robust standard errors. This allows more conservative estimates of the relationships.. Table 2. Descriptive statistics. Variable Demonstration size (log) One demand Two or more demands Universalistic demand National goverment targeted Regional or local govt. targeted Private company targeted One organization Two or more organizations Umbrella organization Average group score Indigenous peoples High school students University students Public workers Private or self-employed workers Consumers and debtors Local residents and squatters Environmentalists Source: protest events dataset.. Obs. 937 1032 1032 1032 1030 1031 1030 1032 1032 1032 1032 1032 1032 1032 1032 1032 1032 1032 1032. Mean 6.29 .81 .09 .23 .74 .23 .16 .33 .16 .19 3.6 .14 .13 .18 .14 .12 .04 .14 .05. Std. Dev. 2.14 .38 .28 .42 .43 .42 .37 .47 .36 .39 2.43 .35 .34 .38 .35 .32 .20 .35 .22. Min. 2.99 0 0 0 0 0 0 0 0 0 0 0 0 0 0 0 0 0 0. Max. 13.74 1 1 1 1 1 1 1 1 1 7 1 1 1 1 1 1 1 1.
(12) SOCIAL MOVEMENT STUDIES. 243. Table 3. Determinants of demonstration size (OLS models). One demand (vs. none) 2 or more demands (vs. none) Universalistic demand. (1) .915*** (.238) 1.037** (.339) 1.491*** (.211). National govt. targeted. (2). (3). (4). .841*** (.186) −.167 (.238) −.392* (.160). Reg./local govt. targeted Private company targeted One organization (vs. none). Umbrella organization Average group score. .512** (.163) 1.039*** (.178) .176*** (.039). Indigenous peoples High school students University students Public workers Private/self-employed workers Consumers and debtors Local residents/squatters Environmentalists 937 .15. 935 .11. (6) .566* (.227) .846* (.349) .812*** (.171) .517** (.164) −.036 (.210). .237 (.173) .795*** (.176) 1.546*** (.225). 2 or more organiz. (vs. none). N Adjusted R2. (5). 937 .20. 937 .11. −.590* (.253) 1.244*** (.225) .977*** (.211) 1.242*** (.265) .257 (.238) −.162 (.364) .041 (.281) .332 (.365) 937 .20. −.629** (.209) .812*** (.217) .390* (.181) .538* (.268). 935 .29. Robust standard errors in parentheses. * p < .05, ** p < .01, *** p < .001. All models include trimester dummy variables and two variables indicating the number of main (national) and complementary sources (not shown).. Endogeneity Could demonstration size shape mobilization strategies rather than the opposite? Since we lack longitudinal data for each demonstration, we cannot speak of causal relationships. However, if the models reveal significant relationships, we tend to believe that they result from mobilization strategies shaping demonstration size rather than the other way around. Our independent variables reflect processes that are chronologically prior to the resulting demonstration size. The definition of targets, demands, groups and organizations require coordination and planning ahead among activists. This, in turn, requires time. All this happens before the demonstration takes place and a given number of people shows up. Thus, it is unlikely that the number of participants gathering on the demonstration day could affect, say, the target of the demonstration or the demands displayed. Of course, a firm answer to this issue requires longitudinal.
(13) 244. N. M. SOMMA AND R. M. MEDEL. data at the demonstration level and in-depth studies of mobilization campaigns. Future studies should address this point.. Results Table 3 presents six OLS models with demonstration size as the dependent variable. All include controls for the number of main and complementary sources, trimester dummy variables, and robust standard errors. Results are generally consistent with our hypotheses. According to model 1, demonstrations displaying one demand, as well as those displaying two or more demands, are significantly larger than demonstrations without visible demands (H1a). Also, demonstrations with universalistic demands are significantly larger than those without them (H1b). Consistent with H2, model 2 shows that demonstrations targeting the national government are significantly larger than those without such a target. Interestingly, demonstrations targeting private companies are smaller than the rest, while targeting regional or local governments seems irrelevant for demonstration size. Model 3 suggests that, consistent with H3a, demonstrations with two or more organizations are larger than those without organizations (but there is no difference for demonstrations with just one organization). And in line with H3b, demonstrations with umbrella organizations are significantly larger than the rest. As reflected in the group score variable, model 4 suggests that demonstrations attracting groups which on average are larger and more cohesive, have higher biographical availability, and enjoy broader public support, are significantly bigger than demonstrations with groups lacking these characteristics (H4). Model 5 provides evidence also consistent with H4, but of a different kind. Both high school and university students, and public workers, which comprise numerous people and are pretty cohesive groups, boost demonstration size, while indigenous groups – stigmatized and historically oppressed – drive it down (more on this below). For rendering our hypotheses to a more demanding test, model 6 includes all variables that resulted as statistically significant in models 1 to 5. Most coefficients become smaller yet all remain significant with one exception (company target). The adjusted R-square indicates that model 6 accounts for a considerable 29% of the variation in demonstration size. Our main empirical conclusion is as follows: ceteris paribus, Chilean demonstrations attract more participants when they include a larger number of demands and organizations (especially universalistic demands and umbrella organizations); when they target the national government; and when they mobilize large and cohesive groups with high public acceptance and biographically available members. Are these results substantively relevant? Based on model 6, Figure 1 shows the predicted demonstration size when the values of a few selected independent variables change from 0 (represented in the line ‘observed values’) to 1 (remaining lines). We consider demonstration sizes corresponding to percentiles 10th (about 35 participants), 30th (100 participants), 50th (467 participants), 70th (2,000 participants) and 90th (8,000 participants) of the observed dependent variable. Since the dependent variable is logged, we exponentiated the coefficient of each independent variable and multiplied such value by the observed demonstration size of each percentile. The substantive impacts of our independent variables are considerable. For instance, demonstrations in the 50th percentile have an estimated size of about 467 participants,.
(14) SOCIAL MOVEMENT STUDIES. 245. Figure 1. Impact of selected independent variables on predicted demonstration size, by percentile of demonstration size.. yet if umbrella organizations participate, it goes up to nearly 1,300 participants. Because the relationship is multiplicative, the expected difference grows as percentiles increase. Robustness analyses We performed several additional analyses to check the robustness of the results presented above (not shown but available upon request). First, we carried out regression models using four different specifications of the dependent variable: not logging it but excluding the 1%, 2%, and 5% of the largest demonstrations to avoid their unduly influence; using quartiles and quintiles instead of continuous values (with ordinal logistic models); using a dichotomous variable differentiating between large demonstrations (801 and more participants) vs. the rest (binary logistic model); and restricting the analysis to the subset of demonstrations with an exact estimation of participants as reported by CLACSO (that is, excluding demonstrations with attendance estimated by the coders or the authors based on news reports). The findings are very similar to those reported above. We also considered alternative independent variables in three ways. First, the specific demands displayed during the demonstration (e. g. educational or labor demands) could be construed as a component of the mobilization strategy. Yet since demands and groups are highly correlated (tetrachoric correlations of paired variables range between .69 and .95), we cannot include them in the same model. However, we ran.
(15) 246. N. M. SOMMA AND R. M. MEDEL. models excluding group variables and including demand variables and obtained the same substantive results – demands perform essentially the same as groups do. Second, the place in which the demonstration occurs might also be construed as a component of the mobilization strategy. We considered five variables indicating the demographic, socioeconomic, and political characteristics of the localities (provincias) in which demonstrations took place. Most results were statistically insignificant or inconsistent. Finally, we tested extensively for interaction effects among the variables included in the analysis but did not find consistent or interpretable patterns.. Fleshing out statistical results In this section we reinforce the internal validity of some of our statistical results. We resort to secondary sources and interviews carried out in 2014 with more than thirty environmental, student, and indigenous social movement leaders (details upon request). First of all, why are demonstrations targeting the national government larger than those who do not? The Chilean state – through a complex network of agencies, programs and policies – has a noticeable influence on the daily life of Chileans. Although public trust in political institutions declined in Chile in the last two decades (Bargsted and Somma 2018), millions across the country receive state pensions, hold state housing and education loans, are enrolled in public schools, use public health care and transportation services, and are affected by consumer, environmental, and wage-setting policies carried out by the national government. Thus, it is no surprise that Chileans agree that the state can do a lot: 20% believes that the state can solve ‘all problems in our society’ and 37% considers it can solve ‘most of them’ (Latinobarometer 2010 survey).1 In a separate question asked in 2011, 82% answered that the state ‘has the means to solve the problems of our society’.2 Additionally, a large majority of Chileans (ranging between 65% and over 80%) agrees that the state should indeed control the transport, health, pensions, and banking system (UDP, 2016). In sum, most Chileans believe that the state is an influential actor that should, and has the means for, taking care of many collective problems.3 Organizing a demonstration against the most visible incarnation of the state – the national government – brings many people that would otherwise remain at home. Our models also suggest that when formal organizations participate during the mobilization, process demonstrations are larger. Why? As in many countries, Chilean organizations mobilize their members for collective action. Asún and Zúñiga (2013) found that, controlling for important predictors, Chileans belonging to voluntary organizations were more likely to participate in regionalist protests. Likewise, Valenzuela, Arriagada, and Scherman (2012) show that membership in charitable, student, and environmental organizations was one of the strongest predictors of protest participation among the Chilean youth. By showing that formal organizations are powerful drivers behind large demonstrations, our results contribute to the current debate about the extent to which organizations add value to collective actions in the digital age (Earl, 2015). Finally, the contrast between students and indigenous groups illustrates the relevance of groups for demonstration size – although we reiterate that this component is less amenable to strategy and choice than previous ones. Why does student presence boosts attendance? Students differ from indigenous groups in some important respects. The number of people self-identified with the Mapuche ethnic group (the largest and most active indigenous group.
(16) SOCIAL MOVEMENT STUDIES. 247. in Chile) is similar to the number of people enrolled in the upper education system. However, students are better placed for collective action. Chilean students interact regularly in educational institutions and are organized in a pyramidal fashion ranging from local student clubs to national-level confederations at the secondary and university level. They can activate a mobilization cascade that reaches large chunks of the student population. In contrast, in part due to five centuries of state repression, social exclusion and cultural stigmatization, Mapuche organizations lack a comparable degree of articulation. They sometimes hold contradictory stands on indigenous rights and have severe problems for staging collective action in a unified fashion. Additionally, Chilean students have higher biographical availability than the indigenous population. Almost 90% of students do not work and almost all of them are single (indicating weak family demands). For the Mapuche population these figures are much lower – about 45% and 58% respectively. Finally, student actions and demands (oriented towards greater socioeconomic inclusion and public funding of education) tend to be more supported by the general public than indigenous demands (some of the most vocal indigenous organizations demand political autonomy from the Chilean state). For instance, 35% of adult Chileans surveyed in 2014 valued ‘a lot’ the student movement but only 22% valued the indigenous movement. Likewise, when asked about the ‘worthiest’ social movement, 45% of respondents chose the student movement while only 14% chose the indigenous movement (COES, 2014). In sum, higher internal cohesion, biographical availability, and public support helps explaining why demonstrations with students convoke more people.. Conclusions We have attempted to understand why the size of demonstrations vary. The topic matters because demonstrations are the quintessential social movement tactic, and the capacity of movements for influencing authorities and the public at large often depends on staging massive demonstrations (DeNardo, 1985; Tilly, 1993; Walgrave, 2013). Also, activists have long wondered about issues of this kind. But research addressing them is almost nonexistent. We argued that variations across mobilization strategies – the decisions and actions taken by organizers for staging a protest – help in unraveling the puzzle. Multivariate analyses of 937 Chilean demonstrations between 2000 and 2012 show that demonstrations are larger when they target the national government, display more demands and of a universalistic character, when several organizations participate (especially umbrella organizations), and when they mobilize large, cohesive groups with high biographical availability and public support. Our argument draws upon well-established theories and concepts in social movement research, including framing, political opportunity, resource mobilization, and biographical availability. There are many avenues for future research, some of them stemming from the limitations of this article. First, we need better measures of demonstration size. As many researchers before us, we relied on the estimates reported by organizers and the police, which are likely to be imprecise. Novel technologies, like the use of drones, may help in this task (Choi-Fitzpatrick & Juskauskas, 2015)..
(17) 248. N. M. SOMMA AND R. M. MEDEL. Second, although we focus on the role of mobilization strategies, we do not claim that protest organizers can freely combine them to stage a large demonstration – we are not providing recipes. Leaders are constrained by movement and organizational contexts and histories, as well as by their own cultural frames and blind spots. For instance, there may be insurmountable barriers for mobilizing certain groups or organizations. Enlarging the set of claims may destroy internal unity. Blaming certain targets may be unconvincing. Intensive case studies of mobilization processes will help ascertaining both the constraints protest organizers face as well as their room for choice. Third, we need to continue exploring the role of contextual factors. Because protest dynamics are often shaped by the broader context, we were surprised by the lack of statistical significance of a wide array of political, social, and economic factors at the national and local level. We call for more research exploring different countries during longer time periods and under different conditions. Fourth, we need more work on the presumed causal link from mobilization strategies to demonstration size. We would benefit from panel studies measuring mobilization strategies in time 0 and demonstration size in time 1, complemented by case studies for detecting potential causal mechanisms. However, we have presented quantitative and qualitative evidence, as well as theoretical reasoning, that suggest that such a link is plausible. Finally, a relatively easy next step would be to replicate this study using the DCAP dataset for the United States – as well as other national datasets containing the required variables. This could tell us whether our results are specific of Chile or rather represent a more general pattern.. Notes 1. See Latinobarómetro’s website. 2. See 2011 CASEN survey’s website, and CNED (2015, p. 2). 3. See 2011 CASEN survey’s website.. Acknowledgment We thank the excellent comments provided by two anonymous reviewers and the editor.. Disclosure statement No potential conflict of interest was reported by the authors.. Funding This research was supported by CONICYT (Chile) through a FONDECYT Iniciación en Investigación grant (11121147), a FONDECYT Regular grant (1160308), the Centre for Social Conflict and Cohesion Studies (COES) (CONICYT/FONDAP/15130009), and the Center for Intercultural and Indigenous Research (CIIR) [CONICYT/FONDAP/15110006].
(18) SOCIAL MOVEMENT STUDIES. 249. Notes on contributors Nicolás M. Somma is Associate Professor of Sociology at the Pontificia Universidad Católica de Chile, and Associate Researcher at the Centre for Social Conflict and Cohesion Studies (COES, Chile). He earned a PhD in Sociology from the University of Notre Dame. His research focuses on social movements, political sociology, and comparative-historical sociology. His work has appeared in several journals, including Party Politics, Comparative Politics, Latin American Politics and Society, and Research in Social Movements, Conflicts and Change, as well as in several book chapters. Rodrigo M. Medel is a Doctoral Candidate in Political Science at the Instituto de Ciencia Política of the Pontificia Universidad Católica de Chile, and an Associate Researcher at the Observatory of Labor Strikes of the Centre for Social Conflict and Cohesion Studies (COES) and Universidad Alberto Hurtado. His research interests revolve around labor relations, political participation, and social movements.. ORCID Nicolás M. Somma Rodrigo M. Medel. http://orcid.org/0000-0001-8717-3868 http://orcid.org/0000-0002-6610-3809. References Asún, R., & Zúñiga, C. (2013). ¿Por qué se participa? Explicando la protesta social regionalista a partir de dos modelos psicosociales. Psicoperspectivas, 12(2), 38–50. Bargsted, M., & Somma, N. M. (2018). La cultura política, diagnóstico y evolución. In C. Huneeus & O. Avendaño (editors), El Sistema Político de Chile (pp 193–224). Santiago, Chile: LOM Editores. Benford, R. D., & Snow, D. A. (2000). Framing processes and social movements: An overview and assessment. Annual Review of Sociology, 611–639. Biggs, M. (2016). Size matters. Quantifying protest by counting participants. Sociological Methods and Research, 47(3), 1–33. Boekkooi, M., Klandermans, B., & van Stekelenburg, J. (2011). Quarrelling and protesting: How organizers shape a demonstration. Mobilization: An International Quarterly, 16(2), 221–239. Boekkooi, M. E. (2012). Mobilizing protest: The influence of organizers on who participates and why. (PhD Dissertation), Vrije Universiteit. Choi-Fitzpatrick, A., & Juskauskas, T. (2015). Up in the air: Applying the Jacobs crowd formula to drone imagery. Procedia Engineering, 107, 273–281. CNED. (2015). Tendencias Índices 2015. Departamento de Investigación e Información Pública. Chile: Consejo Nacional de Educación. COES. (2014) Encuesta Nacional sobre el Conflicto y la Cohesión Social en Chile. Retrieved from www.coes.cl DCAP. (2016) Dynamics of collective action project. Retrieved December 22, 2016. from http:// web.stanford.edu/group/collectiveaction/cgi-bin/drupal/ DeNardo, J. (1985). Power in numbers: The political strategy of protest and rebellion. New Jersey: Princeton University Press. Disi, R. (2016, October 19–21). Still massive? Explaining the size of tertiary student protests in Latin America. Paper presented in the Annual Conference of the Chilean Political Science Association, Pucón, Chile. Earl, J. (2015). The future of social movement organizations: The waning dominance of SMOs online. American Behavioral Scientist, 59(1), 35–52. Gamson, W. A. (1975). The strategy of social protest. Homewood, Illinois: The Dorsey Press. Hox, J. J., Moerbeek, M., & van de Schoot, R. (2010). Multilevel analysis: Techniques and applications. New York: Routledge..
(19) 250. N. M. SOMMA AND R. M. MEDEL. Hutter, S. (2014). Protest event analysis and its offspring. In D. Della Porta (ed.), Methodological practices in social movement research (pp. 335–367). Oxford: Oxford University Press. Jasper, J. (2004). A strategic approach to collective action: Looking for agency in social-movement choices. Mobilization: An International Quarterly, 9(1), 1–16. Jasper, J. (2013). Strategy. In D. A. Snow, D. D. Porta, B. Klandermans, & D. McAdam (edited by), Wiley-Blackwell encyclopedia of social and political movements (pp. 1262–1267). New Jersey: Blackwell. King, B. G., & Soule, S. A. (2007). Social movements as extra-institutional entrepreneurs: The effect of protests on stock price returns. Administrative Science Quarterly, 52(3), 413–442. Klandermans, B., van Stekelenburg, J., Damen, M. L., van Troost, D., & van Leeuwen, A. (2014). Mobilization without organization: The case of unaffiliated demonstrators. European Sociological Review, 30(6), 702–716. Lehman-Wilzig, S., & Ungar, M. (1985). The economic and political determinants of public protest frequency and magnitude: The Israeli experience. In International review of modern sociology, 15(1/2), 63–80. McAdam, D. (1982). Political process and the development of black insurgency, 1930–1970. Chicago, Illinois: University of Chicago Press. McAdam, D. (1986). Recruitment to high-risk activism: The case of freedom Summer. American Journal of Sociology, 92(1), 64–90. McCarthy, J. D., & Zald, M. N. (1977). Resource mobilization and social movements: A partial theory. American Journal of Sociology, 82(6), 1212–1241. McPhail, C., & McCarthy, J. D. (2004). Who counts and how: Estimating the size of protests. Contexts, 3(3), 12–18. Oberschall, A. (1973). Social conflict and social movements. Englewood Cliffs, NJ: Prentice Hall. Oliver, P. (2013). Critical mass theory. In D. A. Snow, D. D. Porta, B. Klandermans, & D. McAdam (edited by), The Wiley-Blackwell Encyclopedia of Social and Political Movements (pp. 285–289). New Jersey: Willey-Blackwell. Olson, M. (1965). The logic of collective action: Public goods and the theory of groups. Cambridge, Mass: Harvard University Pres. Ortiz, D., Myers, D., Walls, E., & Diaz, M. E. (2005). Where do we stand with newspaper data? Mobilization: An International Quarterly, 10(3), 397–419. Sabucedo, J. M., Gómez-Román, C., Alzate, M., van Stekelenburg, J., & Klandermans, B. (2017). Comparing protests and demonstrators in times of austerity: Regular and occasional protesters in universalistic and particularistic mobilisations. Social Movement Studies, 16(6), 704–720. Saunders, C. (2014, April). Factors determining the size of protests: The configuration of the state, protest organisations and individual protesters. ECPR Joint Sessions, 11–15, 1–24. Snow, D. A., Rochford, E. B., Jr, Worden, S. K., & Benford, R. D. (1986). Frame alignment processes, micromobilization, and movement participation. American Sociological Review, 51(4), 464–481. Somma, N. M. (2018). When do political parties move to the streets? Party protest in Chile. Research in Social Movements, Conflicts and Change, 42, 63–85. Somma, N. M., & Medel, R. M. (2017). “Shifting relationships between social movements and institutional politics”. In Marisa Vön Bulow and Sofía Donoso (eds.), Social movements in Chile: Organization, trajectories, and political consequences, Palgrave Macmillan, 29–61. Soule, S. A. (2009). Contention and corporate social responsibility. Cambridge: University Press. Tilly, Ch. (1978). From mobilization to revolution. Boston: Addison-Wesley Tilly, C. (1993). Social movements as historically specific clusters of political performances. Berkeley Journal of Sociology, 38, 1–30. UDP. (2016). Encuesta Nacional UDP, 2005–2015. Chile: . Instituto de Investigaciones en Ciencias Sociales, Universidad Diego Portales. Valenzuela, S., Arriagada, A., & Scherman, A. (2012). The social media basis of youth protest behavior: The case of Chile. Journal of Communication, 62(2), 299–314. Verba, S., Schlozman, K. L., Brady, H. E., & Brady, H. E. (1995). Voice and equality: Civic voluntarism in American Politics. Cambridge, MA: Harvard University Press..
(20) SOCIAL MOVEMENT STUDIES. 251. Walgrave, S. (2013). Demonstrations. In D. A. Snow, D. D. Porta, B. Klandermans, & D. McAdam (edited by), The Wiley-Blackwell Encyclopedia of Social and Political Movements (pp. 347–348). New Jersey: Willey-Blackwell. Walgrave, S., & Manssens, J. (2000). The making of the white march: The mass media as a mobilizing alternative to movement organizations. Mobilization: An International Quarterly, 5(2), 217–239. Walker, E. T., Martin, A. W., & McCarthy, J. D. (2008). Confronting the state, the corporation, and the academy: The influence of institutional targets on social movement repertoires. American Journal of Sociology, 114(1), 35–76. Zmerli, S., & Van der Meer, T. W. (Eds.). (2017). Handbook on political trust. Cheltenham, UK: Edward Elgar Publishing..
(21)
Figure
Documento similar
We want to follow the proof of the existence of Delaunay surfaces given in the previous section in order to prove the existence of a smooth family of normal graphs over the
In the preparation of this report, the Venice Commission has relied on the comments of its rapporteurs; its recently adopted Report on Respect for Democracy, Human Rights and the Rule
The draft amendments do not operate any more a distinction between different states of emergency; they repeal articles 120, 121and 122 and make it possible for the President to
rous artworks, such as sonorou s poetry; d) instances of nOlHu1islie music, such as sonorous activiti es with soc ial, bu t not necessarily aes thetic, funct ions. Lango
As we shall see below, Michael the Syrian‘s account closely follows the Bible narrative (the Syriac version of the Peshīṭtā), although he makes use of a
On the other hand at Alalakh Level VII and at Mari, which are the sites in the Semitic world with the closest affinities to Minoan Crete, the language used was Old Babylonian,
The results of our analysis show that less ATF is spent as larger is the number of features in the exhibit; that, in the average, more time is spent in new exhibits than in
The purpose of the research project presented below is to analyze the financial management of a small municipality in the province of Teruel. The data under study has
