The publication included in this document should be referenced as follows:
MARCH 2017
Urban Heat Island and Vulnerable Population. The Case
of Madrid
Carmen Sánchez-Guevara Sánchez, Miguel Núñez Peiró & Francisco
Javier Neila González
included in:
Sustainable Development and Renovation in Architecture,
Urbanism and Engineering
Publication details, including instructions for authors and subscription information: https://link.springer.com/book/10.1007/978-3-319-51442-0
Please cite this document as:
Sánchez-Guevara Sánchez, C., Núñez Peiró, M. & Neila González, F.J. (2017). Urban Heat
Island and Vulnerable Population. The Case of Madrid. In P. Mercader-Moyano (Ed.),
Sustainable Development and Renovation in Architecture, Urbanism and Engineering (pp.
3-13). Springer International Publising.
DOI: 10.1007/978-3-319-51442-0_1
To link to this document:
https://link.springer.com/chapter/10.1007/978-3-319-51442-0_1
The following document has been archived according to the publisher’s default policies as
a PRE-PRINT versión on the repository of the Universidad Politécnica de Madrid.
For more information, please visit:
DOI: 10.1007/978-3-319-51442-0_1.
Urban heat island and vulnerable population.
The case of Madrid
Sánchez-Guevara Sánchez, Carmen
(1,*), Núñez Peiró, Miguel
(1), Neila
González, Fco. Javier
(1)(1) (*) Grupo de investigación ABIO. Universidad Politécnica de Madrid, [email protected], 913363889
Abstract
The Urban Heat Island effect shows the differences among temperatures in urban
areas and the surrounding rural ones. Previous studies have demonstrated that
temperature differences could be up to 8ºC during the hottest periods of summer
in Madrid, and that it varies according to the urban structure. Associated to this
ef-fect, the impact of temperature increase over dwelling indoor thermal comfort
seems to double cooling energy demand. In Madrid, fuel poor households already
suffering from inadequate indoor temperatures can face important overheating
problems and, as a consequence, relevant health problems could become more
frequent and stronger. This poses an increment in mortality rates in risk groups
that should be evaluated. This research is aimed at establishing the geospatial
con-nection between the urban heat island and the most vulnerable population living in
the city of Madrid. Hence, those areas most in need for an urban intervention can
be detected and prioritized.
Keywords: Urban Heat Island; Urban Indicators; Vulnerable Population; Heat
Wave; Fuel Poverty
1 Introduction
1.1 Relevance of the research
The Urban Heat Island (UHI) is a well recognised effect that rises the ambient air
temperature compared to surrounding less urbanized areas (Oke 1982). Recent
studies of the UHI of Madrid has shown this temperature difference to be up to
8ºC (Núñez Peiró et al. 2016).
2 Sánchez-Guevara Sánchez, C. et al
which are expected to be more pronounced in dense urban areas combined with
the urban heat island phenomenon.
The combination of all these effects will make population to be exposed to
ex-treme temperatures. High daytime temperatures together along with warm
night-time temperatures, for an extended duration of days, will have important impacts
over people’s health. High temperature health-related consequences have been
al-ready studied and some population groups have been identified as being more
vul-nerable towards this temperature raise. The age of the population has shown to be
an important factor, but not only the elder and children are more susceptible to
high temperatures; also people already suffering from a chronic disease or people
living in high-rise dense areas of the city, are vulnerable towards these effects
(Tomlinson et al. 2011; Culqui et al. 2013; Basu 2002; Díaz et al. 2002; Simon et
al. 2005). In a recent report for the city of Madrid some districts were already
identified as being more vulnerable towards climate change due to their
tempera-tures, social composition and building qualities (Tapia et al. 2015).
Derived from these differences in vulnerability towards extreme temperatures,
researchers have started analysing whether social inequalities can be found as a
consequence of urban temperature gradient distribution. Results of many of these
studies have shown a correlation between urban location of more disadvantaged
people and a higher exposure to high temperatures (Harlan et al. 2015). These
studies are usually based on heat-related mortality data and point at some
socio-demographic indicators as a key element in the measurement of this vulnerability:
elderly groups of more than 60-65-70 years, secondary education attainment,
peo-ple living alone as widowed, divorced and separated, low and middle incomes and
poor housing conditions (Wong et al. 2016; Klein Rosenthal et al. 2014).
Nowa-days heat vulnerability indexes are being developed in different cities based on the
correlation of high heat risk and socio-economic conditions (Johnson & Wilson
2009; Johnson et al. 2012; Wolf & McGregor 2013).
DOI: 10.1007/978-3-319-51442-0_1.
https://link.springer.com/chapter/10.1007/978-3-319-51442-0_1
1.
2 Aims and objective of the study
This paper explores the geospatial connection between the urban heat island of
Madrid and the location of the most vulnerable population towards high extreme
temperatures. The research is aimed at locating which are the neighbourhoods
where those most in need live and hence, determining priorities for dwelling
ener-gy retrofitting and urban intervention in specific areas of the city.
2 Means and methods
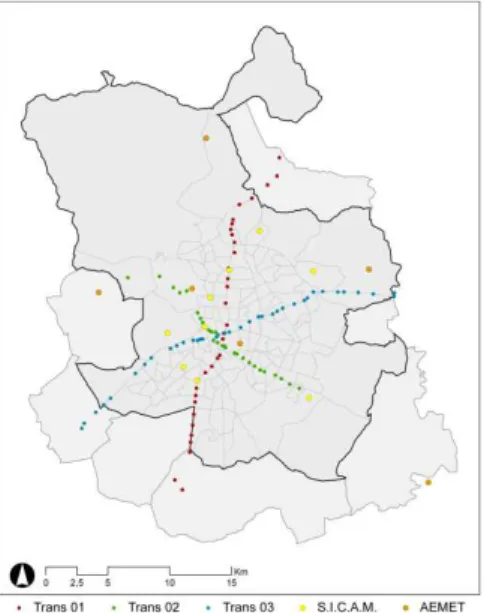
2.1 Summer Urban Heat Island of Madrid during a heat wave
Along 2015 and 2016 years, a proximity environmental temperature
measure-ment campaign was conducted. Temperatures were registered by the method of
urban transects, as shown in Figure 1, already used in the first UHI existing study
of Madrid (López Gómez et al. 1988). Results shown in present study were
regis-tered in the night of the 15
thof July of 2015 under a heat wave event conditions
and maximum intensity of the Urban Heat Island. Hence, this research has worked
with an urban gradient temperature snapshot wherein the two phenomenon are
combined.
4 Sánchez-Guevara Sánchez, C. et al
2.2 Vulnerable population indicators towards extreme
temperatures
Previous research showed socioeconomic indicators as a key element to detect
vulnerability to heat-related illnesses and mortality. Social indicators used for this
study were selected from available data derived from the European project Urban
Audit (Eurostat 2012). This project, started in the late nineties, was aimed at
gath-ering statistical data that enabled the comparison of life quality among main
Euro-pean cities. The project is conducted by Directorate-General for Regional and
Ur-ban Policy of the European Commission and Eurostat.
Available statistical data for the city of Madrid is disaggregated by
neighbor-hoods in what the project call
sub-city districts
which are urban areas with a
popu-lation between 5,000 and 40,000 inhabitants, smaller than districts and formed by
the aggregation of census sections.
Four were the indicators selected from the Urban Audit database:
•
Mean household annual net income (€): represents household’s income and is
calculated by National Statistics Institute derived from data of the Spanish Tax
Agency.
•
Proportion of foreigners over total population: people who do not have the
na-tionality of the country of residence regardless the place of birth.
•
Single household (%): proportion of single households over the total.
•
Low educational level (%): proportion of the population between 25-65 years
old with a maximum level of education ISCED 0, 1 or 2 according to the
classi-fication of the United Nations. Level 0 is for early education level, 1 for
ele-mentary education level and 2 is for the first stage of secondary education
lev-el.
All indicators were selected from 2011 data, except income values that were
only available from 2013.
In line with existing literature that points at aged people and children as
popula-tion at risk towards extreme temperatures, data for these groups was extracted
from 2011 municipal census. Hence, another two indicators were incorporated to
the study with the same disaggregation level as the sub-city districts:
•
Elderly (%): proportion of the population over 70 years old.
•
Children (%): proportion of the population under 4 years old.
DOI: 10.1007/978-3-319-51442-0_1.
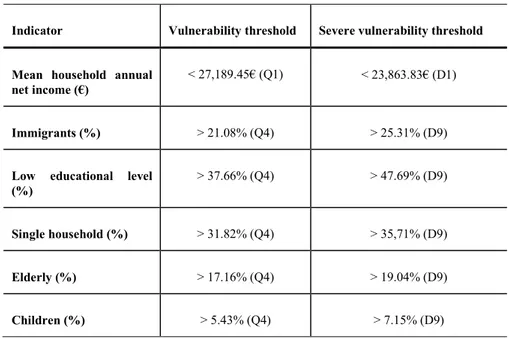
https://link.springer.com/chapter/10.1007/978-3-319-51442-0_1 Table 1 Thresholds for vulnerability indicators
Indicator Vulnerability threshold Severe vulnerability threshold
Mean household annual net income (€)
< 27,189.45€ (Q1) < 23,863.83€ (D1)
Immigrants (%) > 21.08% (Q4) > 25.31% (D9)
Low educational level (%)
> 37.66% (Q4) > 47.69% (D9)
Single household (%) > 31.82% (Q4) > 35,71% (D9)
Elderly (%) > 17.16% (Q4) > 19.04% (D9)
Children (%) > 5.43% (Q4) > 7.15% (D9)
2.3 Geographic Information System Tool
All the information of this research was managed, analyzed and represented
through a Geographic Information System (GIS) Tool. The software used was
ArcGIS version 10.3.
Urban area disaggregation level was the
sub-city
previously defined, set by the
indicators used from the Urban Audit. A reference temperature value was
associ-ated to each one of these areas as explained in section 2.1, which is the arithmetic
mean value of all contained points within each area. Calculations were made by
means of the ArcGIS statistics package.
6 Sánchez-Guevara Sánchez, C. et al
3 Results
3.1 Social indicators and the UHI of Madrid
First part of the study consisted of analyzing the relation between temperature
gradient of the UHI and selected socioeconomic indicators. For that purpose
tem-perature gradient was calculated for each neighbourhood in order to set
compara-ble geographical delimitations with the rest of indicators. Each indicator was
sepa-rately analysed and compared with registered temperatures. Figure 2 shows
neighbourhoods with a median income below the first quartile mainly located in
the south of the city where higher temperatures were registered. This figure also
enables locating some of the neighbourhoods with the highest presence of
foreign-ers settled in hotter areas.
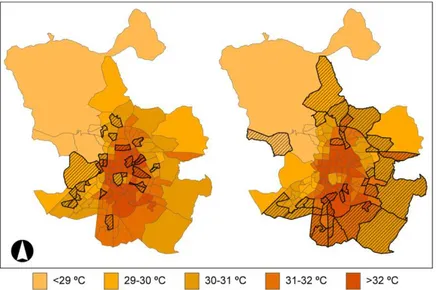
Larger rates of single households can be found in the center of the city where
extreme temperatures were recorded. By contrast, population with lower
educa-tional levels can be found in the south, as shows Figure 3. Finally, Figure 4 shows
the relation of vulnerable population due to its age and the UHI of Madrid. It is
possible to detect some of the most aged neighbourhoods in central areas where
the highest temperatures are registered, while those with larger presence of
chil-dren seem to be located in more peripheral areas and hence, with better thermal
conditions. However, there can be found some areas in the south side of the city
where the overlap between high temperatures and rates of children can be
as-sessed.
DOI: 10.1007/978-3-319-51442-0_1.
https://link.springer.com/chapter/10.1007/978-3-319-51442-0_1
Fig. 3 UHI of Madrid during summer nighttime and neighbourhoods with a proportion of single households over the fourth quartile (Left) and neighbourhoods with a population with low educa-tional level over the fourth quartile (Right).
Fig. 4 UHI of Madrid during summer nighttime and neighbourhoods with a proportion of people older than 70 years over the fourth quartile (Left) and neighbourhoods with a proportion of chil-dren below 4 years over the fourth quartile (Right).
8 Sánchez-Guevara Sánchez, C. et al
3.2 Vulnerable neighbourhoods and the UHI of Madrid
After analyzing socioeconomic vulnerable indicators separately and comparing
them with UHI gradient temperature, some areas of the city were delimitated.
Neighbourhoods were defined as vulnerable when three or more of these
indica-tors overlapped so most disadvantaged population could be located. Figure 5
shows these areas and their relation with the temperatures of the city. It can be
seen that these neighbouhoods are mainly concentrated in the south of the city.
Fig. 5 UHI of Madrid during summer nighttime and vulnerable neighbourhoods according to se-lected indicators.
DOI: 10.1007/978-3-319-51442-0_1.
https://link.springer.com/chapter/10.1007/978-3-319-51442-0_1
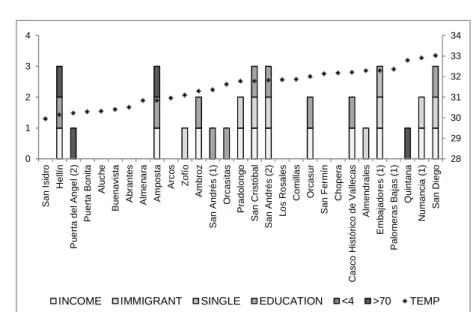
Fig. 6 Neighbourhoods’ vulnerability indicators exceeding fixed thresholds and nighttime tem-peratures registered.
Besides that, and in order to better understand neighbourhood vulnerability
de-gree, those wherein at least too indicators exceeded the severe vulnerability
thresholds were delimitated. Figure 7 shows the location of these neighbourhoods,
mainly placed in the south of the city where also higher temperature levels are
reg-istered. Figure 8 gathers all vulnerable neighbourhoods and presents for which
in-dicators severe vulnerability thresholds were exceeded.
Fig. 7 UHI of Madrid during summer nighttime and severe vulnerable neighbourhoods according to selected indicators.
28 29 30 31 32 33 34 0 1 2 3 4 S a n I s id ro H e llí n P u e rt a d e l A n g e l (2 ) P u e rt a B o n it a A lu c h e B u e n a v is ta A b ra n te s A lm e n a ra A m p o s ta A rc o s Z o fí o A m b ro z S a n A n d ré s ( 1 ) O rc a s it a s P ra d o lo n g o S a n C ri s tó b a l S a n A n d ré s ( 2 ) L o s R o s a le s C o m ill a s O rc a s u r S a n F e rm ín C h o p e ra C a s c o H is tó ri c o d e V a lle c a s A lm e n d ra le s E m b a ja d o re s ( 1 ) P a lo m e ra s B a ja s ( 1 ) Q u in ta n a N u m a n c ia ( 1 ) S a n D ie g o
10 Sánchez-Guevara Sánchez, C. et al
Fig. 8 Neighbourhoods’ severe vulnerability indicators exceeding fixed thresholds and nighttime
temperatures registered.
4 Conclusions
This research has shown, for the city of Madrid, the existence of several
neigh-bourhoods with an important presence of vulnerable population that are located in
some of the hottest areas of the city, which poses important health risks for that
population. Methodology developed poses a useful tool in order to establish
dif-ferent degrees of vulnerability and hence, prioritize interventions among urban
ar-eas.
Neighbourhoods delimitated as being vulnerable towards high temperatures
are, in their majority, included in the ‘Map of priority areas for the impulse of
ur-ban regeneration’- APIRU by its initials in Spanish- (Área de Gobierno de
Desarrollo Urbano Sostenible. Dirección General de Estrategia de Regeneración
Urbana 2016). This is mainly because this report is based on studies of deprived
areas delimitation that take into account socioeconomic indicators of disadvantage
of the population along with some others relative to the poor quality of dwellings.
Households settled in these are likely not to be able to cope with extreme
tem-perature episodes either because of the poor quality of their dwellings or the lack
of adequate cooling systems. As a conclusion it can be highlighted the importance
of incorporating intercity temperature variations as another indicator that must
play an important role in the urban regeneration decision-making process.
28 29 30 31 32 33 34 0 1 2 3 4 S a n I s id ro H e llí n P u e rt a d e l A n g e l (2 ) P u e rt a B o n it a A lu c h e B u e n a v is ta A b ra n te s A lm e n a ra A m p o s ta A rc o s Z o fí o A m b ro z S a n A n d ré s ( 1 ) O rc a s it a s P ra d o lo n g o S a n C ri s tó b a l S a n A n d ré s ( 2 ) L o s R o s a le s C o m ill a s O rc a s u r S a n F e rm ín C h o p e ra C a s c o H is tó ri c o d e V a lle c a s A lm e n d ra le s E m b a ja d o re s ( 1 ) P a lo m e ra s B a ja s ( 1 ) Q u in ta n a N u m a n c ia ( 1 ) S a n D ie g o
DOI: 10.1007/978-3-319-51442-0_1.
https://link.springer.com/chapter/10.1007/978-3-319-51442-0_1
5 References
Área de Gobierno de Desarrollo Urbano Sostenible. Dirección General de Estrategia de Regeneración Urbana, 2016. Mapa de áreas preferentes de impulso a la regeneración urbana (APIRU), Madrid.
Basu, R., 2002. Relation between Elevated Ambient Temperature and Mortality: A Review of the Epidemiologic Evidence. Epidemiologic Reviews, 24(2), pp.190–202.
Culqui, D.R., Díaz, J., Simón, F., & Linares, C., 2013. Impact of the Effects of Heat Waves on Mortality in the City of Madrid, Spain during the Period 1990-2009 / Análisis del impacto de las olas de calor sobre la mortalidad de la ciudad de Madrid durante el período 1990-2009. Revista Española de Salud Pública, 87(3), pp.277–282.
Díaz, J., Jordán, A., García, R., López, C., Alberdi, J.C., Hernández, E., & Otero A., 2002. Heat waves in Madrid 1986-1997: effects on the health of the elderly. International Archives of Occupational and Environmental Health, 75(3), pp.163–170.
Eurostat, 2012. Methodological Manual on City Statistics,
Fischer, E.M. & Schär, C., 2010. Consistent geographical patterns of changes in high-impact European heatwaves. Nature Geoscience, 3(6), pp.398–403.
Harlan, S.L., Brazel, A.J., Jenerette, G.D., Jones, N.S., Larsen, L., Prashad, L., & Stefanov, W.L., 2015. In the shade of affluence: the inequitable distribution of the urban heat island.
Equity and the Environment, 15, pp.173–202.
Intergovernmental Panel of Climate Change, 2013. Working group I. Contribution to the IPCC fifth assessment report of climate change 2013: The physical science basis.
Johnson, D.P., Stanforth, A., Lulla, V., & Luber, G., 2012. Developing an applied extreme heat vulnerability index utilizing socioeconomic and environmental data. Applied Geography, 35(1-2), pp.23–31.
Johnson, D.P. & Wilson, J.S., 2009. The socio-spatial dynamics of extreme urban heat events: The case of heat-related deaths in Philadelphia. Applied Geography, 29(3), pp.419–434. Klein Rosenthal, J., Kinney, P.L. & Metzger, K.B., 2014. Intra-urban vulnerability to
heat-related mortality in New York City, 1997-2006. Health and Place, 30, pp.45–60. López Gómez, A. et al., 1988. El Clima urbano de Madrid: La isla de calor, Madrid: CSIC. López Moreno, H., Sánchez-Guevara Sánchez, C., Román López, E. & Neila González, F.J.,
2015. Thermal characterization of urban heat island according to urban morphology of Madrid. In Proceedings of the III International Congress on Construction and Building Research. Madrid.
Moreno Jiménez, A. & Fernández García, F., 2003. El confort climático en los entornos residenciales de las capas altas, medias y bajas de la Comunidad de Madrid: otra forma de desigualdad socioespacial. La distribución espacial de la renta en la Comunidad de Madrid, Madrid.
Núñez Peiró, M., Román López, E., Sánchez-Guevara Sánchez, C., Neila González, F.J., 2016. Hacia un modelo dinámico para la isla de calor urbana de Madrid = Towards a Dynamic Model for the Urban Heat Island of Madrid. Anales de Edificación, 2(1), p.49.
12 Sánchez-Guevara Sánchez, C. et al
Sánchez-Guevara, C., Sanz Fernández, A. & Hernández Aja, A., 2014. Income, energy expenditure and housing in Madrid: retrofitting policy implications. Building Research &
Information, 3218(May 2015), pp.1–13.
Simon, F., López Abente, G., Ballester, E. & Martínez, F., 2005. Mortality in Spain during the heat waves of summer 2003. Eurosurveillance, 10(7-9), pp.168–171.
Tapia, C., Abajo, B., Feliu, E., Fernández, J.G., Padró, A. & Castaño, J., 2015. Análisis de
vulnerabilidad ante el cambio climático en el Municipio de Madrid, Madrid.
Tomlinson, C.J., Chapman, L., Thornes, J.E. & Baker, C.J., 2011. Including the urban heat island in spatial heat health risk assessment strategies: a case study for Birmingham, UK.
International journal of health geographics, 10(1), p.42.
Wolf, T. & McGregor, G., 2013. The development of a heat wave vulnerability index for London, United Kingdom. Weather and Climate Extremes, 1(August 2003), pp.59–68. Wong, M.S. et al., 2016. Spatially analyzing the inequity of the hong kong urban heat island by
socio-demographic characteristics. International Journal of Environmental Research and
Public Health, 13(3), pp.1–17.
Acknowledge
This research is funded by Programa de I+D+I orientada a los retos de la sociedad ‘Retos
In-vestigación’ of the Ministry of Economy and Competitiveness. Grant code BIA2013-41732-R,
MODIFICA Project: Predictive Model For Dwellings Energy Performance Under The Urban Heat Island Effect.