Search for neutral Higgs bosons of the minimal supersymmetric standard model in pp collisions at root s=8 TeV with the ATLAS detector
55
0
0
Texto completo
(2) Prepared for submission to JHEP. Search for neutral Higgs bosons of the minimal supersymmetric standard model in pp collisions at √ s = 8 TeV with the ATLAS detector. Abstract: A search for the neutral Higgs bosons predicted by the Minimal Supersymmetric Standard Model (MSSM) is reported. The analysis is performed on data from proton–proton collisions at a centre-of-mass energy of 8 TeV collected with the ATLAS detector at the Large Hadron Collider. The samples used for this search were collected in 2012 and correspond to integrated luminosities in the range 19.5–20.3 fb−1 . The MSSM Higgs bosons are searched for in the τ τ final state. No significant excess over the expected background is observed, and exclusion limits are derived for the production cross section times branching fraction of a scalar particle as a function of its mass. The results are also interpreted in the MSSM parameter space for various benchmark scenarios..
(3) Contents 1 Introduction. 1. 2 The ATLAS detector. 3. 3 Data and Monte Carlo simulation samples. 4. 4 Object reconstruction. 5. 5 Search channels 5.1 The h/H/A → τe τµ channel 5.2 The h/H/A → τlep τhad channel 5.3 The h/H/A → τhad τhad channel. 6 7 11 16. 6 Systematic uncertainties. 19. 7 Results. 22. 8 Summary. 26. 1. Introduction. The discovery of a scalar particle at the Large Hadron Collider (LHC) [1, 2] has provided important insight into the mechanism of electroweak symmetry breaking. Experimental studies of the new particle [3–7] demonstrate consistency with the Standard Model (SM) Higgs boson [8–13]. However, it remains possible that the discovered particle is part of an extended scalar sector, a scenario that is favoured by a number of theoretical arguments [14, 15]. The Minimal Supersymmetric Standard Model (MSSM) [16–20] is an extension of the SM, which provides a framework addressing naturalness, gauge coupling unification, and the existence of dark matter. The Higgs sector of the MSSM contains two Higgs doublets, which results in five physical Higgs bosons after electroweak symmetry breaking. Of these bosons, two are neutral and CP-even (h, H), one is neutral and CP-odd (A), 1 and the remaining two are charged (H ± ). At tree level, the mass of the light scalar Higgs boson, mh , is restricted to be smaller than the Z boson mass, mZ . This bound is weakened due to radiative corrections up to a maximum allowed value of mh ∼ 135 GeV. Only two additional parameters are needed with respect to the SM at tree level to describe the MSSM Higgs 1. By convention the lighter CP-even Higgs boson is denoted h, the heavier CP-even Higgs boson is denoted H. The masses of the three bosons are denoted in the following as mh , mH and mA for h, H and A, respectively.. 1.
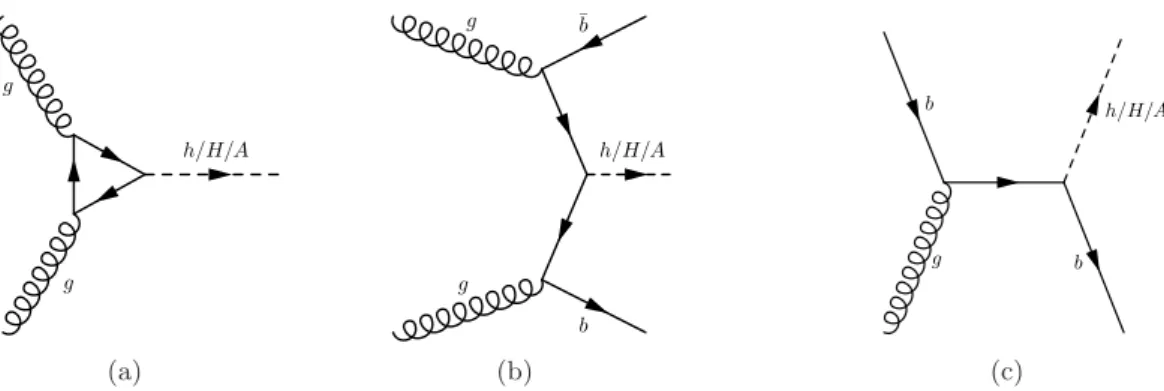
(4) g. b̄. g. b. h/H/A. h/H/A. h/H/A. g. g. b. g b. (a). (b). (c). Figure 1. Example Feynman diagrams for (a) gluon fusion and (b) b-associated production in the four-flavour scheme and (c) five-flavour scheme of a neutral MSSM Higgs boson.. sector. These can be chosen to be the mass of the CP-odd Higgs boson, mA , and the ratio of the vacuum expectation values of the two Higgs doublets, tan β. Beyond lowest order, the MSSM Higgs sector depends on additional parameters, which are fixed at specific values scenario the radiative in various MSSM benchmark scenarios. For example, in the mmax h corrections are chosen such that mh is maximized for a given tan β and MSUSY [21, 22]. 2 This results for MSUSY = 1 TeV in mh ∼ 130 GeV for large mA and tan β. In addition, in the same region the heavy Higgs bosons, H, A and H ± , are approximately mass degenerate and h has properties very similar to a SM Higgs boson with the same mass. This feature is generic in the MSSM Higgs sector: a decoupling limit exists defined by mA ≫ mZ in which the heavy Higgs bosons have similar masses and the light CP-even Higgs boson in practice becomes identical to a SM Higgs boson with the same mass. The discovery of a SM-like Higgs boson, with mass that is now measured to be 125.36 ± 0.37 (stat) ± 0.18 (syst) GeV [24], has prompted the definition of additional MSSM scenarios [23]. Most notably, the mmod+ and mmod− scenarios are similar to the h h max mh scenario, apart from the fact that the choice of radiative corrections is such that the maximum light CP-even Higgs boson mass is ∼ 126 GeV. This choice increases the region of the parameter space that is compatible with the observed Higgs boson being the lightest scenario. There are many CP-even Higgs boson of the MSSM with respect to the mmax h other MSSM parameter choices beyond these scenarios that are also compatible with the observed SM Higgs boson, for instance, refs. [25, 26]. The couplings of the MSSM Higgs bosons to down-type fermions are enhanced with respect to the SM for large tan β values resulting in increased branching fractions to τ leptons and b-quarks, as well as a higher cross section for Higgs boson production in association with b-quarks. This has motivated a variety of searches in τ τ and bb final states at LEP [27], the Tevatron [28–30] and the LHC [31–33]. This paper presents the results of a search for a neutral MSSM Higgs boson in the τ τ decay mode using 19.5–20.3 fb−1 of proton–proton collision data collected with the ATLAS detector [34] in 2012 at a centre-of-mass energy of 8 TeV. Higgs boson production through 2. The supersymmetry scale, MSUSY , is defined here as the mass of the third generation squarks following refs. [21–23].. 2.
(5) gluon fusion or in association with b-quarks is considered (see figure 1), with the latter mode dominating for high tan β values. The results of the search are interpreted in various MSSM scenarios. The ATLAS search for the SM Higgs boson in the τ τ channel [35] is similar to that described here. Important differences between the two searches are that they are optimized for different production mechanisms and Higgs boson mass ranges. Additionally, the three Higgs bosons of the MSSM, which can have different masses, are considered in this search. In particular the couplings to b-quarks and vector bosons are different between the SM and MSSM. The b-associated production mode is dominant for the H and A bosons and is enhanced for the h boson with respect to the SM for large parts of the MSSM parameter space. Furthermore, the coupling of the H boson to vector bosons is suppressed with respect to those for a SM Higgs boson with the same mass and the coupling of the A boson to vector bosons is zero at lowest order, due to the assumption of CP symmetry conservation. Hence, vector boson fusion production and production in association with a vector boson, which contribute significantly to the SM Higgs boson searches, are much less important with respect to the SM. Finally, for high mA the search for the heavy H and A bosons is more sensitive in constraining the MSSM parameter space than the search for the h boson. As a consequence, this search has little sensitivity to the production of a SM Higgs boson with a mass around 125 GeV. For consistency, the SM Higgs signal is not considered part of the SM background, as the MSSM contains a SM-like Higgs boson for large parts of the parameter space.. 2. The ATLAS detector. The ATLAS experiment [34] at the LHC is a multi-purpose particle detector with a forwardbackward symmetric cylindrical geometry and a near 4π coverage in solid angle. It consists of an inner tracking detector surrounded by a thin superconducting solenoid providing a 2 T axial magnetic field, electromagnetic and hadronic calorimeters, and a muon spectrometer. The inner tracking detector covers the pseudorapidity range3 |η| < 2.5. It consists of silicon pixel, silicon micro-strip, and transition radiation tracking detectors. Lead/liquidargon (LAr) sampling calorimeters provide electromagnetic (EM) energy measurements with high granularity. A hadronic (iron/scintillator-tile) calorimeter covers the central pseudorapidity range (|η| < 1.7). The end-cap and forward regions are instrumented with LAr calorimeters for both the EM and hadronic energy measurements up to |η| = 4.9. The muon spectrometer surrounds the calorimeters and is based on three large air-core toroid superconducting magnets with eight coils each. Its bending power is in the range 2.0–7.5 Tm. It includes a system of precision tracking chambers and fast detectors for triggering. A three-level trigger system is used to select events. The first-level trigger is 3. ATLAS uses a right-handed coordinate system with its origin at the nominal interaction point (IP) in the centre of the detector and the z-axis along the beam pipe. The x-axis points from the IP to the centre of the LHC ring, and the y-axis points upwards. Cylindrical coordinates (r, φ) are used in the transverse plane, φ being the azimuthal angle around the beam pipe. The pseudorapidity is defined in terms of the p polar angle θ as η = − ln tan(θ/2). Angular distance is measured in units of ∆R ≡ (∆η)2 + (∆φ)2 .. 3.
(6) implemented in hardware. It is designed to use a subset of the detector information to reduce the accepted rate to at most 75 kHz. This is followed by two software-based trigger levels that together reduce the accepted event rate to 400 Hz on average, depending on the data-taking conditions, during 2012.. 3. Data and Monte Carlo simulation samples. The data used in this search were recorded by the ATLAS experiment during the 2012 LHC run with proton–proton collisions at a centre-of-mass energy of 8 TeV. They correspond to an integrated luminosity of 19.5–20.3 fb−1 , depending on the search channel. Simulated samples of signal and background events were produced using various event generators. The presence of multiple interactions occurring in the same or neighbouring bunch crossings (pile-up) was accounted for, and the ATLAS detector was modelled using GEANT4 [36, 37]. The Higgs boson production mechanisms considered in this analysis are gluon fusion and b-associated production. The cross sections for these processes were calculated using Higlu [38], ggh@nnlo [39] and SusHi [39–54]. For b-associated production, fourflavour [55, 56] and five-flavour [44] cross-section calculations are combined [57]. The masses, couplings and branching fractions of the Higgs bosons are computed with FeynHiggs [50, 51, 53]. Gluon fusion production is simulated with Powheg Box 1.0 [58], while b-associated production is simulated with Sherpa 1.4.1 [59]. For a mass of mA = 150 GeV and tan β = 20, the ratio of the gluon fusion to b associated production modes is approximately 0.5 for A and H production and three for h production. For a mass of mA = 300 GeV and tan β = 30, the ratio of production modes becomes approximately 0.1 for A and H production and 50 for h production. For both samples the CT10 [60] parton distribution function set is used. Signal samples are generated using the A boson production mode at discrete values of mA , with the mass steps chosen by taking the τ τ mass resolution into account. The signal model is then constructed by combining three mass samples, one for each of the h, H and A bosons, with appropriately scaled cross sections and branching fractions. The cross sections and branching fractions, as well as the masses of the h and H bosons, depend on mA , tan β and the MSSM scenario under study. The differences in the kinematic properties of the decays of CP-odd and CP-even Higgs bosons are expected to be negligible for this search. Thus the efficiencies and acceptances from the A boson simulated samples are applicable to all neutral Higgs bosons. Background samples of W and Z bosons produced in association with jets are produced using Alpgen 2.14 [61], while the high-mass Z/γ ∗ tail is modelled separately using Pythia8 [62, 63] since in the high-mass range the current analysis is rather insensitive to the modelling of b-jet production. W W production is modelled with Alpgen and W Z and ZZ production is modelled with Herwig 6.520 [64]. The simulation of top pair production uses Powheg and mc@nlo 4.01 [65], and single-top processes are generated with AcerMC 3.8 [66]. All simulated background samples use the CTEQ6L1 [67] parton distribution function set, apart from mc@nlo, which uses CT10.. 4.
(7) For all the simulated event samples, the parton shower and hadronization are simulated with Herwig, Pythia8 or Sherpa. Pythia8 is used for Powheg-generated samples, Sherpa for the b-associated signal production and Herwig for the remaining samples. Decays of τ leptons are generated with Tauola [68], Sherpa or Pythia8. Photos [69] or Sherpa provide additional radiation from charged leptons. Z/γ ∗ → τ τ events form an irreducible background that is particularly important when considering low-mass Higgs bosons (mA . 200 GeV). It is modelled with Z/γ ∗ → µ+ µ− events from data, where the muon tracks and the associated calorimeter cells are replaced by the corresponding simulated signature of a τ lepton decay. The two τ leptons are simulated by Tauola. The procedure takes into account the effect of τ polarization and spin correlations [70]. In the resulting sample, the τ lepton decays and the response of the detector are modelled by the simulation, while the underlying event kinematics and all other properties are obtained from data. This τ -embedded Z/γ ∗ → µ+ µ− sample is validated as described in refs. [31, 35]. The µµ event selection requires two isolated muons in the rapidity range |η| < 2.5, where the leading muon has pT > 20 GeV, the subleading muon pT > 15 GeV and the invariant mass is in the range mµµ > 40 GeV. This results in an almost pure Z/γ ∗ → µ+ µ− sample, which, however, has some contribution from tt̄ and diboson production. The contamination from these backgrounds that pass the original µµ event selection and, after replacement of the muons by tau leptons, enter the final event selection are estimated using simulation. Further details can be found in section 6. Z/γ ∗ → τ τ events in the invariant mass range mτ τ < 40 GeV are modelled using ALPGEN simulated events.. 4. Object reconstruction. Electron candidates are formed from energy deposits in the electromagnetic calorimeter associated with a charged-particle track measured in the inner detector. Electrons are selected if they have a transverse energy ET > 15 GeV, lie within |η| < 2.47, but outside the transition region between the barrel and end-cap calorimeters (1.37 < |η| < 1.52), and meet the “medium” identification requirements defined in ref. [71]. Additional isolation criteria, based on tracking and calorimeter information, are used to suppress backgrounds from misidentified jets or semileptonic decays of heavy quarks. In particular, the sum of the calorimeter deposits in a cone of size ∆R = 0.2 around the electron direction is required to be less than 6 (8)% of the electron ET for the τlep τhad (τlep τlep ) final state. Similarly, the scalar sum of the transverse momentum of tracks with pT > 1 GeV in a cone of size ∆R = 0.4 with respect to the electron direction is required to be less than 6% of the electron ET . Muon candidates are reconstructed by associating an inner detector track with a muon spectrometer track [72]. For this analysis, the reconstructed muons are required to have a transverse momentum pT > 10 GeV and to lie within |η| < 2.5. Additional track-quality and track-isolation criteria are required to further suppress backgrounds from cosmic rays, hadrons punching through the calorimeter, or muons from semileptonic decays of heavy quarks. The muon calorimetric and track isolation criteria use the same cone sizes and. 5.
(8) generally the same threshold values with respect to the muon pT as in the case of electrons - only for the case of the τlep τlep final state is the muon calorimetric isolation requirement changed to be less than 4% of the muon momentum. Jets are reconstructed using the anti-kt algorithm [73] with a radius parameter R = 0.4, taking topological clusters [74] in the calorimeter as input. The jet energy is calibrated using a combination of test-beam results, simulation and in situ measurements [75]. Jets must satisfy ET > 20 GeV and |η| < 4.5. To reduce the effect of pile-up, it is required that, for jets within |η| < 2.4 and ET < 50 GeV, at least half of the transverse momentum, as measured by the associated charged particles, be from particles matched to the primary vertex.4 A multivariate discriminant is used to tag jets, reconstructed within |η| < 2.5, originating from a b-quark [76]. The b-jet identification has an average efficiency of 70% in simulated tt̄ events, whereas the corresponding light-quark jet misidentification probability is approximately 0.7%, but varies as a function of the jet pT and η [77]. Hadronic decays of τ leptons (τhad ) [78] are reconstructed starting from topological clusters in the calorimeter. A τhad candidate must lie within |η| < 2.5, have a transverse momentum greater than 20 GeV, one or three associated tracks and a charge of ±1. Information on the collimation, isolation, and shower profile is combined into a multivariate discriminant against backgrounds from jets. Dedicated algorithms that reduce the number of electrons and muons misreconstructed as hadronic τ decays are applied. In this analysis, two τhad identification selections are used —“loose” and “medium”— with efficiencies of about 65% and 55%, respectively. When different objects selected according to the criteria mentioned above overlap with each other geometrically (within ∆R = 0.2) only one of them is considered. The overlap is resolved by selecting muon, electron, τhad and jet candidates in this order of priority. The missing transverse momentum is defined as the negative vectorial sum of the muon momenta and energy deposits in the calorimeters [79]. The magnitude of the missing miss . Clusters of calorimeter-cell energy deposits transverse momentum is denoted by ET belonging to jets, τhad candidates, electrons, and photons, as well as cells that are not associated with any object, are treated separately in the missing transverse momentum calculation. The energy deposits in calorimeter cells that are not matched to any object are weighted by the fraction of unmatched tracks associated with the primary vertex, in miss resolution. The contributions of muons order to reduce the effect of pile-up on the ET to missing transverse momentum are calculated differently for isolated and non-isolated muons, to account for the energy deposited by muons in the calorimeters.. 5. Search channels. The following τ τ decay modes are considered in this search: τe τµ (6%), τe τhad (23%), τµ τhad (23%) and τhad τhad (42%), where τe and τµ represent the two leptonic τ decay modes and the percentages in the parentheses denote the corresponding τ τ branching fractions. 4. The primary vertex is taken to be the reconstructed vertex with the highest Σp2T of the associated tracks.. 6.
(9) The selections defined for each of the channels and described in sections 5.1–5.3 are such that there are no events common to any two of these channels. Events are collected using several single- and combined-object triggers. The singleelectron and single-muon triggers require an isolated lepton with a pT threshold of 24 GeV. The single-τhad trigger implements a pT threshold of 125 GeV. The following combinedobject triggers are used: an electron–muon trigger with lepton pT thresholds of 12 GeV and 8 GeV for electrons and muons, respectively, and a τhad τhad trigger with pT thresholds of 38 GeV for each hadronically decaying τ lepton. With two τ leptons in the final state, it is not possible to infer the neutrino momenta from the reconstructed missing transverse momentum vector and, hence, the τ τ invariant mass. Two approaches are used. The first method used is the Missing Mass Calculator (MMC) [80]. This algorithm assumes that the missing transverse momentum is due entirely to the neutrinos, and performs a scan over the angles between the neutrinos and the visible τ lepton decay products. The MMC mass, mMMC , is defined as the most likely value chosen ττ by weighting each solution according to probability density functions that are derived from simulated τ lepton decays. As an example, the MMC resolution,5 assuming a Higgs boson with mass mA = 150 GeV, is about 30% for τe τµ events. The resolution is about 20% for τlep τhad events (τlep = τe or τµ ) for Higgs bosons with a mass in the range 150 − 350 GeV. The second method uses the τ τ total transverse mass, defined as: q miss ) + m2 (τ , E miss ) , m2T (τ1 , τ2 ) + m2T (τ1 , ET mtotal = T T 2 T where the transverse mass, mT , between two objects with transverse momenta pT1 and pT2 and relative angle ∆φ is given by p mT = 2pT1 pT2 (1 − cos ∆φ) . As an example, the mtotal mass resolution assuming a Higgs boson with mass mA = T 350 GeV for τhad τhad events is approximately 30%. While the MMC exhibits a better τ τ mass resolution for signal events, multi-jet background events tend to be reconstructed at lower masses with mtotal T , leading to better overall discrimination between signal and background for topologies dominated by multi-jet background. 5.1. The h/H/A → τe τµ channel. Events in the h/H/A → τe τµ channel are selected using either single-electron or electron– muon triggers. The data sample corresponds to an integrated luminosity of 20.3 fb−1 . Exactly one isolated electron and one isolated muon of opposite charge are required, with lepton pT thresholds of 15 GeV for electrons and 10 GeV for muons. Electrons with pT in the range 15–25 GeV are from events selected by the electron–muon trigger, whereas electrons with pT > 25 GeV are from events selected by the single-electron trigger. Events containing hadronically decaying τ leptons, satisfying the “loose” τhad identification criterion, are vetoed. 5. The resolution of the mass reconstruction is estimated by dividing the root mean square of the mass distribution by its mean.. 7.
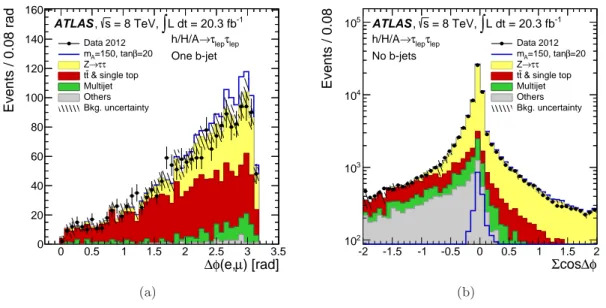
(10) 160 140. Events / 0.08. Events / 0.08 rad. To increase the sensitivity of this channel, the events are split into two categories based on the presence (“tag category”) or absence (“veto category”) of a b-tagged jet. The tag category requires exactly one jet satisfying the b-jet identification criterion. In addition, a number of kinematic requirements are imposed to reduce the background from top quark decays. The azimuthal angle between the electron and the muon, ∆φ(e, µ), must be greater than 2.0 (see figure 2(a)). The sum of the cosines of the azimuthal angles between the miss ))+cos(φ(µ)− leptons and the missing transverse momentum, Σ cos ∆φ ≡ cos(φ(e)−φ(ET miss φ(ET )), must be greater than −0.2. The scalar sum of the pT of jets with pT > 30 GeV miss must be less than 100 GeV. Finally, the scalar sum of the pT of the leptons and the ET must be below 125 GeV. The veto category is defined by requiring that no jet satisfies the b-jet identification criterion. Because the top quark background is smaller in this category, the imposed kinematic selection requirements, ∆φ(e, µ) > 1.6 and Σ cos ∆φ > −0.4 (see figure 2(b)), are looser than in the tag category.. ATLAS , s = 8 TeV, ∫ L dt = 20.3 fb-1 Data 2012 mA=150, tanβ=20 Z→ττ tt & single top Multijet Others Bkg. uncertainty. 120 100. h/H/A→τlepτlep One b-jet. 105. ATLAS , s = 8 TeV, ∫ L dt = 20.3 fb-1. h/H/A→τlepτlep. Data 2012 mA=150, tanβ=20 Z→ττ tt & single top Multijet Others Bkg. uncertainty. No b-jets 104. 80 60. 103. 40 20 0. 0. 0.5. 1. 1.5. 2. 2.5. 3. 102 -2. 3.5. ∆φ(e,µ) [rad]. (a). -1.5. -1. -0.5. 0. 0.5. 1. 1.5. 2. Σcos∆φ. (b). Figure 2. Kinematic distributions for the h/H/A → τe τµ channel: (a) the ∆φ(e, µ) distribution after the tag category selection criteria apart from the ∆φ(e, µ) requirement and (b) the Σ cos ∆φ distribution after the b-jet veto requirement. The data are compared to the background expectation and a hypothetical MSSM signal (mA = 150 GeV and tan β = 20). In (b) the assumed signal is shown twice: as a distribution in the bottom of the plot and on top of the total background prediction. The background uncertainty includes statistical and systematic uncertainties.. The most important background processes in this channel are Z/γ ∗ + jets, tt̄, and multi-jet production. The Z/γ ∗ → τ τ background is estimated using the τ -embedded Z/γ ∗ → µ+ µ− sample outlined in section 3. It is normalized using the NNLO Z/γ ∗ + jets cross section calculated with FEWZ [81] and a simulation estimate of the efficiency of the trigger, lepton η and pT , and identification requirements. The tt̄ background is estimated from simulation with the normalization taken from a data control region enriched in tt̄ events, defined by requiring two b-tagged jets. The W +jet background, where one of the leptons results from a misidentified jet, is estimated using simulation. Smaller backgrounds. 8.
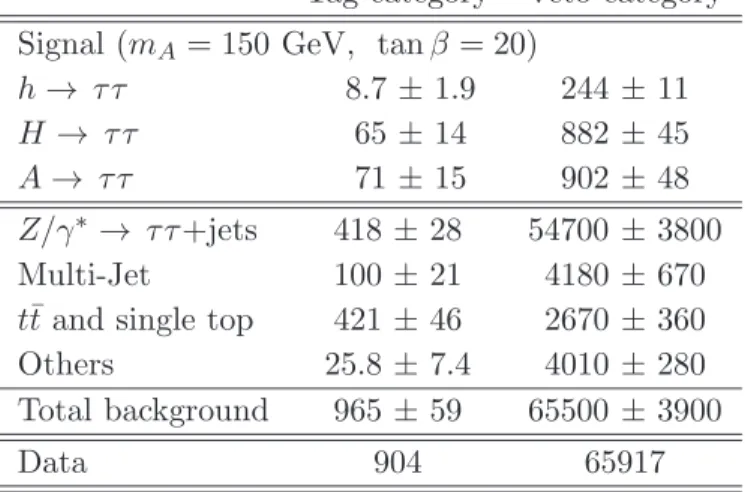
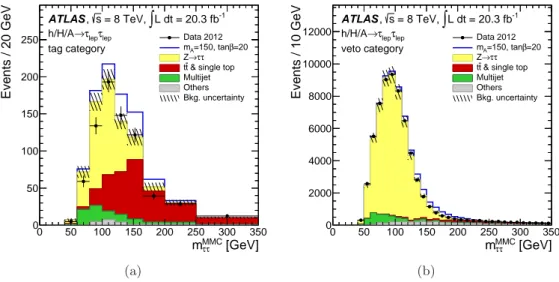
(11) Tag category. Veto category. Signal (mA = 150 GeV, tan β = 20) h → ττ 8.7 ± 1.9 244 ± 11 H → ττ 65 ± 14 882 ± 45 A → ττ 71 ± 15 902 ± 48. Z/γ ∗ → τ τ +jets Multi-Jet tt̄ and single top Others Total background Data. 418 100 421 25.8 965. ± ± ± ± ±. 904. 28 21 46 7.4 59. 54700 4180 2670 4010 65500. ± ± ± ± ±. 3800 670 360 280 3900. 65917. Table 1. Number of events observed in the h/H/A → τe τµ channel and the predicted background and signal. The predicted signal event yields correspond to the parameter choice mA = 150 GeV and tan β = 20. The row labelled “Others” includes events from diboson production, Z/γ ∗ → ee/µµ and W +jets production. Combined statistical and systematic uncertainties are quoted. The signal prediction does not include the uncertainty due to the cross-section calculation.. from single-top and diboson production are also estimated from simulation. The multi-jet background is estimated from data using a two-dimensional sideband method. The event sample is split into four regions according to the charge product of the eµ pair and the isolation requirements on the electron and muon. Region A (B) contains events where both leptons pass the isolation requirements and are of opposite (same) charge, while region C (D) contains events where both leptons fail the isolation requirements and are also of opposite (same) charge. This way, A is the signal region, while B, C, and D are control regions. Event contributions to the B, C and D control regions from processes other than multi-jet production are estimated using simulation and subtracted. The final prediction for the multi-jet contribution to the signal region, A, is given by the background-subtracted data in region B, scaled by the opposite-sign to samesign ratio measured in regions C and D, rC/D ≡ nC /nD . Systematic uncertainties on the prediction are estimated from the stability of rC/D under variations of the lepton isolation requirement. Table 1 shows the number of observed τe τµ events, the predicted background, and the scenario [21, 22] parameter choice mA = 150 GeV and signal prediction for the MSSM mmax h tan β = 20. The total combined statistical and systematic uncertainties on the predictions are also quoted on table 1. The observed event yields are compatible with the expected yields from SM processes. The MMC mass is used as the discriminating variable in this channel, and is shown in figure 3 for the tag and veto categories separately.. 9.
(12) Events / 10 GeV. Events / 20 GeV. ∫. ATLAS , s = 8 TeV, L dt = 20.3 fb-1 h/H/A→τlepτlep 250 tag category. Data 2012 mA=150, tanβ=20 Z→ττ tt & single top Multijet Others Bkg. uncertainty. 200. ∫. ATLAS , s = 8 TeV, L dt = 20.3 fb-1. 12000 h/H/A→τlepτlep veto category 10000. Data 2012 mA=150, tanβ=20 Z→ττ tt & single top Multijet Others Bkg. uncertainty. 8000. 150 6000 100 4000 50. 0 0. 2000. 50. 100. 150. 200. 250. 300. mMMC ττ. 0 0. 350. 50. 100. 150. 200. 250. 300. 350. mMMC [GeV] ττ. [GeV]. (a). (b). Figure 3. MMC mass distributions for the h/H/A → τe τµ channel. The MMC mass is shown for (a) the tag and (b) the veto categories. The data are compared to the background expectation and a hypothetical MSSM signal (mA = 150 GeV and tan β = 20). The contributions of the diboson, Z/γ ∗ → ee/µµ, and W + jets background processes are combined and labelled “Others”. The background uncertainty includes statistical and systematic uncertainties.. 10.
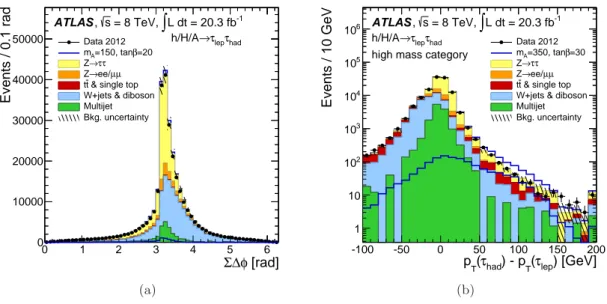
(13) 5.2. The h/H/A → τlep τhad channel. Events in the h/H/A → τlep τhad channel are selected using single-electron or single-muon triggers. The data sample corresponds to an integrated luminosity of 20.3 fb−1 . Events are required to contain an electron or a muon with pT > 26 GeV and an oppositely charged τhad with pT > 20 GeV satisfying the “medium” τhad identification criterion. Events must not contain additional electrons or muons. The event selection is optimized separately for lowand high-mass Higgs bosons in order to exploit differences in kinematics and background composition. The low-mass selection targets the parameter space with mA < 200 GeV. It includes two orthogonal categories: the tag category and the veto category. In the tag category there must be at least one jet tagged as a b-jet. Events that contain one or more jets with pT > 30 GeV, without taking into account the leading b-jet, are rejected. In addition, the transverse mass of the lepton and the transverse missing momentum is required to not exceed 45 GeV. These requirements serve to reduce the otherwise dominant tt̄ background. In the veto category there must be no jet tagged as a b-jet. Two additional selection requirements are applied to reduce the W + jets background. First, the transverse mass of the lepton and the missing transverse momentum must be below 60 GeV. Secondly, the miss ) + ∆φ(τ , E miss ), must have a value sum of the azimuthal angles Σ∆φ ≡ ∆φ(τhad , ET lep T less than 3.3 (see figure 4(a)). Finally, in the τµ τhad channel of the veto category, dedicated requirements based on kinematic and shower shape properties of the τhad candidate are applied to reduce the number of muons faking hadronic τ lepton decays. The high-mass selection targets mA ≥ 200 GeV. It requires Σ∆φ < 3.3, in order to reduce the W +jets background. The hadronic and leptonic τ lepton decays are required to be back-to-back: ∆φ(τlep , τhad ) > 2.4. In addition, the transverse momentum difference between the τhad and the lepton, ∆pT ≡ pT (τhad ) − pT (lepton), must be above 45 GeV (see figure 4(b)). This requirement takes advantage of the fact that a τhad tends to have a higher visible transverse momentum than a τlep due to the presence of more neutrinos in the latter decay. In the low-mass categories, the electron and muon channels are treated separately and combined statistically. For the high-mass category, they are treated as a single channel to improve the statistical robustness. The most important SM background processes in this channel are Z/γ ∗ +jets, W +jets, multi-jet production, top (including both tt̄ and single top) and diboson production. The τ -embedded Z/γ ∗ → µ+ µ− sample is used to estimate the Z/γ ∗ → τ τ background. It is normalized in the same way as in the τlep τlep channel. The rate at which electrons are misidentified as τhad , important mostly for Z → ee decays, was estimated from data in ref. [78]. The contribution of diboson processes is small and estimated from simulation. Events originating from W + jets, Z(→ ℓℓ)+ jets (ℓ = e, µ), tt̄ and single-top production, in which a jet is misreconstructed as τhad , are estimated from simulated samples with normalization estimated by comparing event yields in background-dominated control regions in data. Separate regions are defined for each of the background sources in each of the lowmass tag, low-mass veto, and high-mass categories. Systematic uncertainties are derived. 11.
(14) 40000. 30000. Events / 10 GeV. Events / 0.1 rad. 50000. ATLAS , s = 8 TeV, ∫ L dt = 20.3 fb-1 Data 2012 mA=150, tanβ=20 Z→ττ Z→ee/µµ tt & single top W+jets & diboson Multijet Bkg. uncertainty. h/H/A→τlepτhad. 106 105. ATLAS , s = 8 TeV, ∫ L dt = 20.3 fb-1. h/H/A→τlepτhad. Data 2012 mA=350, tanβ=30 Z→ττ Z→ee/µµ tt & single top W+jets & diboson Multijet Bkg. uncertainty. high mass category. 104 103 102. 20000. 10. 10000. 1 0 0. 1. 2. 3. 4. 5. 6. -100. Σ∆φ [rad]. -50. 0. 50. T. (a). 100. 150. 200. p (τhad) - p (τlep) [GeV] T. (b). Figure 4. Kinematic distributions for the h/H/A → τlep τhad channel: (a) the Σ∆φ distribution after the kinematic requirements on the τlep and τhad and (b) the distribution of ∆pT ≡ pT (τhad ) − pT (lepton) for the high-mass category for the combined τe τhad and τµ τhad final states. In (b) all the τlep τhad high-mass selection criteria are applied apart from the ∆pT > 45 GeV requirement. The data are compared to the background expectation and a hypothetical MSSM signal: mA = 150 GeV, tan β = 20 for (a) and mA = 350 GeV, tan β = 30 for (b). The assumed signal is shown twice: as a distribution in the bottom of the plot and on top of the total background prediction. The background uncertainty includes statistical and systematic uncertainties.. using alternative definitions for the control regions. The multi-jet background is estimated with a two-dimensional sideband method, similar to the one employed for the τe τµ channel, using the product of the lepton (e or µ) and τhad charges and lepton isolation. The systematic uncertainty on the predicted event yield is estimated by varying the definitions range. of the regions used, and by testing the stability of the rC/D ratio across the mMMC ττ Table 2 shows the number of observed τlep τhad events, the predicted background, and the signal prediction for the MSSM mmax scenario. The signal MSSM parameters are h mA = 150 GeV, tan β = 20 for the low-mass categories and mA = 350 GeV, tan β = 30 for the high mass category. The total combined statistical and systematic uncertainties on the predictions are also quoted in table 2. The observed event yields are compatible with the expected yields from SM processes within the uncertainties. The MMC mass is used as the final mass discriminant in this channel and is shown in figures 5 and 6 for the lowand high-mass categories, respectively.. 12.
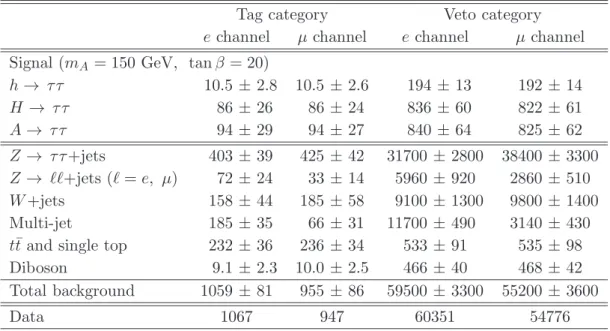
(15) Low-mass categories Tag category e channel µ channel Signal (mA = 150 GeV, tan β = 20) h → ττ 10.5 ± 2.8 H → ττ 86 ± 26 A → ττ 94 ± 29. Z → τ τ +jets Z → ℓℓ+jets (ℓ = e, µ) W +jets Multi-jet tt̄ and single top Diboson Total background Data. 403 72 158 185 232 9.1 1059. ± ± ± ± ± ± ±. 39 24 44 35 36 2.3 81. 10.5 ± 2.6 86 ± 24 94 ± 27. 425 33 185 66 236 10.0 955. 1067. ± ± ± ± ± ± ±. 42 14 58 31 34 2.5 86. Veto category e channel µ channel 194 ± 13 836 ± 60 840 ± 64. 31700 5960 9100 11700 533 466 59500. 947. ± ± ± ± ± ± ±. 2800 920 1300 490 91 40 3300. 60351. 192 ± 14 822 ± 61 825 ± 62. 38400 2860 9800 3140 535 468 55200. ± ± ± ± ± ± ±. 3300 510 1400 430 98 42 3600. 54776. High-mass category Signal (mA = 350 GeV, tan β = 30) h → ττ 5.60 ± 0.68 H → ττ 157 ± 13 A → ττ 152 ± 13 Z → τ τ +jets Z → ℓℓ+jets (ℓ = e, µ) W +jets Multi-jet tt̄ and single top Diboson Total background Data. 380 34.9 213 57 184 30.1 900. ± ± ± ± ± ± ±. 50 7.3 40 20 26 4.8 72. 920. Table 2. Numbers of events observed in the h/H/A → τlep τhad channel and the predicted background and signal. The predicted signal event yields correspond to the parameter choice mA = 150 GeV, tan β = 20 for the low-mass categories and mA = 350 GeV, tan β = 30 for the high-mass category. Combined statistical and systematic uncertainties are quoted. The signal prediction does not include the uncertainty due to the cross-section calculation.. 13.
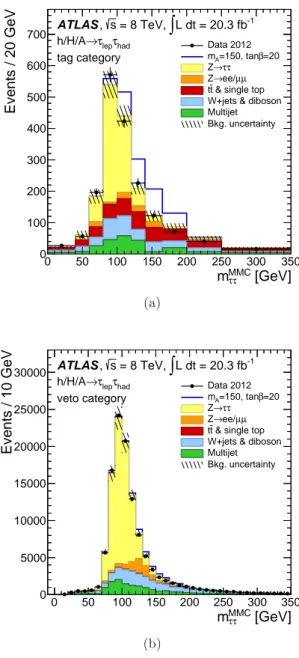
(16) Events / 20 GeV. 700 600. ATLAS , s = 8 TeV, ∫ L dt = 20.3 fb-1. h/H/A→τlepτhad tag category. Data 2012 mA=150, tanβ=20 Z→ττ Z→ee/µµ tt & single top W+jets & diboson Multijet Bkg. uncertainty. 500 400 300 200 100 0 0. 50. 100. 150. 200. 250. 300. 350. mτMMC [GeV] τ. Events / 10 GeV. (a). 30000. ATLAS , s = 8 TeV, ∫ L dt = 20.3 fb-1. h/H/A→τlepτhad veto category. Data 2012 mA=150, tanβ=20 Z→ττ Z→ee/µµ tt & single top W+jets & diboson Multijet Bkg. uncertainty. 25000 20000 15000 10000 5000 0. 0. 50. 100. 150. 200. 250. 300. 350. mτMMC [GeV] τ (b). Figure 5. The MMC mass distributions for the low-mass categories of the h/H/A → τlep τhad channel. Tag (a) and veto (b) categories are shown for the combined τe τhad and τµ τhad final states. The data are compared to the background expectation and a hypothetical MSSM signal (mA = 150 GeV and tan β = 20). The background uncertainty includes statistical and systematic uncertainties.. 14.
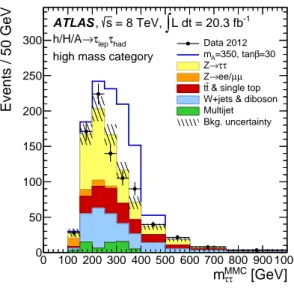
(17) Events / 50 GeV. ATLAS , s = 8 TeV, ∫ L dt = 20.3 fb-1. 300 h/H/A→τlepτhad high mass category 250 200. Data 2012 mA=350, tanβ=30 Z→ττ Z→ee/µµ tt & single top W+jets & diboson Multijet Bkg. uncertainty. 150 100 50 0 0 100 200 300 400 500 600 700 800 900 1000. mτMMC [GeV] τ. Figure 6. The MMC mass distribution for the high-mass category of the h/H/A → τlep τhad channel is shown for the combined τe τhad and τµ τhad final states. The data are compared to the background expectation and a hypothetical MSSM signal (mA = 350 GeV and tan β = 30). The background uncertainty includes statistical and systematic uncertainties.. 15.
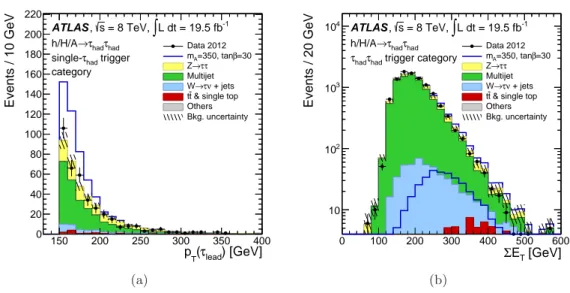
(18) The h/H/A → τhad τhad channel. 5.3. 220 200. Events / 20 GeV. Events / 10 GeV. Events in the h/H/A → τhad τhad channel are selected using either a single-τhad trigger or a τhad τhad trigger. The data sample corresponds to an integrated luminosity of 19.5 fb−1 . Events are required to contain at least two τhad , identified using the “loose” identification criterion. If more than two τhad are present, the two with the highest pT values are considered. Events containing an electron or muon are rejected to ensure orthogonality with the other channels. The two τhad are required to have pT > 50 GeV, have opposite electric charges, and to be back-to-back in the azimuthal plane (∆φ > 2.7). Two event categories are defined as follows. The single-τhad trigger category (STT category) includes the events selected by the single-τhad trigger which contain at least one τhad with pT > 150 GeV (see figure 7(a)). The τhad τhad trigger category (DTT category) includes the events selected by the τhad τhad trigger, with the leading τhad required to have pT less than 150 GeV, to ensure orthogonality with the STT category, and with both τ leptons satisfying the “medium” identification criterion. In addition, events in the DTT category are required to have miss > 10 GeV, and the scalar sum of transverse energy of all deposits in the calorimeter ET to be greater than 160 GeV (see figure 7(b)).. ∫. ATLAS , s = 8 TeV, L dt = 19.5 fb-1. h/H/A→τhadτhad 180 single-τ trigger had 160 category. Data 2012 mA=350, tanβ=30 Z→ττ Multijet W→τν + jets tt & single top Others Bkg. uncertainty. 140 120. 104. ∫. ATLAS , s = 8 TeV, L dt = 19.5 fb-1 h/H/A→τhadτhad τhadτhad trigger category. 103. Data 2012 mA=350, tanβ=30 Z→ττ Multijet W→τν + jets tt & single top Others Bkg. uncertainty. 100 102. 80 60 40. 10. 20 0. 150. 200. 250. 300. 350. 400. 0. p (τlead) [GeV]. 100. 200. 300. T. (a). 400. 500. 600. ΣET [GeV]. (b). Figure 7. Kinematic distributions for the h/H/A → τhad τhad channel: (a) the transverse momentum of the highest-pT τhad for the STT category and (b) the scalar sum of transverse energy of all deposits, ΣET , in the DTT category, before the application of this requirement. The data are compared to the background expectation and a hypothetical MSSM signal (mA = 350 GeV and tan β = 30). The background labelled “Others” includes events from diboson production, Z → ℓℓ and W → ℓν with ℓ = e, µ. In (b) the assumed signal is shown twice: as a distribution in the bottom of the plot and on top of the total background prediction. The background uncertainty includes statistical and systematic uncertainties.. The dominant background in this channel is multi-jet production and for this reason is used as the final discriminant. Other background samples include Z/γ ∗ + jets, W + jets, tt̄ and diboson. mtotal T. 16.
(19) The multi-jet background is estimated separately for the STT and DTT categories. In the STT category, a control region is obtained by requiring the next-to-highest-pT τhad to fail the “loose” τhad identification requirement, thus obtaining a high-purity sample of multi-jet events. The probability of a jet to be misidentified as a τhad is measured in a high purity sample of dijet events in data, as a function of the number of associated tracks with the jet and the jet pT . These efficiencies are used to obtain the shape and the normalization of the multi-jet background from the control region with the next-to-highestpT τhad that fails the τhad identification requirement. The systematic uncertainty on the method is obtained by repeating the multijet estimation, but requiring either a same-sign or opposite-sign between the two jets. The difference between the calculated efficiencies for the two measurements is then taken as the systematic uncertainty. This procedure has some sensitivity to differences related to whether the jets in the dijet sample are quark- or gluon-initiated. The resulting uncertainty is on average 11%. A two-dimensional sideband method is used in the DTT category by defining four regions based on the charge product miss > 10 GeV requirement. A systematic uncertainty is derived of the two τhad and the ET by measuring the variation of the ratio of opposite-sign to same-sign τhad τhad pairs for different sideband region definitions, as well as across the mtotal range, and amounts to T 5%. The remaining backgrounds are modelled using simulation. Non-multi-jet processes with jets misidentified as τhad are dominated by W (→ τ ν)+jets. In such events the τhad identification requirements are only applied to the τhad from the W decay and not the jet that may be misidentified as the second τhad . Instead the event is weighted using misidentification probabilities, measured in a control region in data, to estimate the background yield. Z/γ ∗ + jets background is also estimated using simulation. Due to the small number of remaining events after the pT thresholds of the τhad trigger requirements, the τ -embedded Z → µµ sample is not used. Table 3 shows the number of observed τhad τhad events, the predicted background, and scenario parameter choice mA = 350 GeV, the signal prediction for the MSSM mmax h tan β = 30. The total combined statistical and systematic uncertainties on the predictions are also quoted in table 3. The observed event yields are compatible with the expected yields from SM processes within the uncertainties. The distributions of the total transverse mass are shown in figure 8 for the STT and the DTT categories separately.. 17.
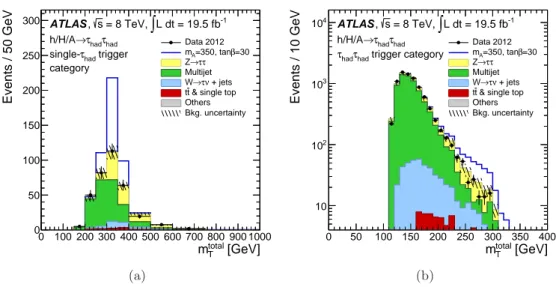
(20) Single-τhad trigger (STT) category Signal (mA = 350 GeV, tan β h → ττ 0.042 ± H → ττ 95 ± A → ττ 82 ±. Multi-jet Z/γ ∗ → τ τ W (→ τ ν)+jets tt̄ and single top Others Total background. 216 113 34 10.2 0.50 374. Data. ± ± ± ± ± ±. = 30) 0.039 18 16. τhad τhad trigger (DTT) category 11.2 ± 4.5 182 ± 27 158 ± 24. 25 18 8.1 4.4 0.20 32. 6770 750 410 76 3.40 8010. 373. ± ± ± ± ± ±. 430 210 100 26 0.80 490. 8225. ∫. 300 ATLAS , s = 8 TeV, L dt = 19.5 fb-1 h/H/A→τhadτhad Data 2012 mA=350, tanβ=30 250 single-τhad trigger Z→ττ category Multijet W→τν + jets tt & single top Others Bkg. uncertainty. 200. Events / 10 GeV. Events / 50 GeV. Table 3. Number of events observed in the h/H/A → τhad τhad channel and the predicted background and signal. The predicted signal event yields correspond to the parameter choice mA = 350 GeV, tan β = 30. The row labelled “Others” includes events from diboson production, Z → ℓℓ and W → ℓν with ℓ = e, µ. Combined statistical and systematic uncertainties are quoted. The signal prediction does not include the uncertainty due to the cross-section calculation.. 104. ∫. ATLAS , s = 8 TeV, L dt = 19.5 fb-1 h/H/A→τhadτhad τhadτhad trigger category. 103. Data 2012 mA=350, tanβ=30 Z→ττ Multijet W→τν + jets tt & single top Others Bkg. uncertainty. 150 102 100 50 10 0 0 100 200 300 400 500 600 700 800 900 1000. 0. 50. 100 150 200 250 300 350 400. mtotal [GeV] T. mtotal [GeV] T. (a). (b). Figure 8. Total transverse mass distributions for (a) STT and (b) DTT categories of the h/H/A → τhad τhad channel. The data are compared to the background expectation and a hypothetical MSSM signal (mA = 350 GeV and tan β = 30). The background labelled “Others” includes events from diboson production, Z → ℓℓ and W → ℓν with ℓ = e, µ. The background uncertainty includes statistical and systematic uncertainties.. 18.
(21) 6. Systematic uncertainties. The event yields for several of the backgrounds in this search are estimated using control samples in data as described in section 5 and their associated uncertainties are discussed there. In this section, the remaining uncertainties are discussed and the overall effect of the systematic uncertainties is presented. Many of the systematic uncertainties affect both the signal and background estimates based on MC. These correlations are used in the limit calculation described in section 7. Signal cross-section uncertainties are taken from the study in ref. [82]. Typical uncertainty values are in the range 10–15% for gluon fusion and 15–20% for b-associated production. The uncertainty on the signal acceptance from the parameters used in the event generation of signal and background samples is also considered. This is done by evaluating the change in acceptance after varying the factorisation and renormalisation scale parameters, parton distribution function choices, and if applicable, conditions for the matching of the partons used in the fixed-order calculation and the parton shower. The uncertainty on the signal acceptance is largest in the tag category for b-associated production, where it is about 13%. Uncertainties for single-boson and diboson production cross sections are estimated for missing higher-order corrections, parton distribution functions and the value of the strong coupling constant, and are considered wherever applicable. Acceptance uncertainties for these background processes are estimated in the same way as for signal. The most important theoretical uncertainties on the background are the Z+jets cross section and acceptance, which affect the normalization by about 7%. The uncertainty on the integrated luminosity is 2.8%. It is derived, following the same methodology as that detailed in ref. [83], from a preliminary calibration of the luminosity scale derived from beam-separation scans performed in November 2012. The single-τhad and τhad τhad trigger efficiencies are studied in Z → τ τ events. Their uncertainties are in the range 3–25% depending on the number of the tracks matched to the τhad , the τhad pseudorapidity and pT , as well as the data-taking period. They are estimated with a method similar to the one in ref. [84] and updated for the 2012 data-taking conditions. The τhad identification efficiency is measured using Z → τ τ events. The uncertainty is in the range 3–10%, depending on the τhad pseudorapidity and the number of tracks matched to the τ lepton [78]. Extrapolated uncertainties are used for τhad candidates with transverse momenta above those accessible in Z → τ τ events.. The τhad energy scale uncertainty is estimated by propagating the single-particle response to the individual τhad decay products (neutral and charged pions). This uncertainty is in the range 2–4% [85] depending on pT , pseudorapidity and the number of associated tracks. The jet energy scale (JES) and resolution uncertainties are described in refs. [75, 86]. The JES is established by exploiting the pT balance between a jet and a reference object. 19.
(22) such as a Z boson or a photon. The uncertainty range is between 3% and 7%, depending on the pT and pseudorapidity. The b-jet identification efficiency uncertainty range is from 2% to 8%, depending on the jet pT . The estimation of this uncertainty is based on a study that uses tt̄ events in data [76]. miss uncertainties are derived by propagating all energy scale uncertainties of The ET reconstructed objects. Additionally, the uncertainty on the scale for energy deposits outside reconstructed objects and the resolution uncertainties are considered [87]. Electron and muon reconstruction, identification, isolation and trigger efficiency uncertainties are estimated from data in refs. [72, 88]. Uncertainties related to the electron energy scale and resolution and to the muon momentum scale and resolution are also estimated from data [72, 89] and taken into account. Systematic uncertainties associated with the τ -embedded Z/γ ∗ → µ+ µ− +jets data event sample are examined in refs. [31, 35]. Two are found to be the most significant: the uncertainty due to the muon selection, which is estimated by varying the muon isolation requirement used in selecting the Z/γ ∗ → µ+ µ− +jets events, and the uncertainty from the subtraction of the calorimeter cell energy associated with the muon. The embedded sample contains a small contamination of tt̄ events at high MMC values. This is found to have a non-negligible influence in the τlep τhad tag and high-mass categories only. The effect on the search result is found to be very small in the tag category since other background contributions are dominant in the relevant MMC region. Its effect is taken into account by adding an additional uncertainty of 50% to the Z → τ τ background for MMC values exceeding 135 GeV. For the high-mass category, the estimated background level is subtracted from the data and an uncertainty contribution of the same size is applied. The relative effect of each of the systematic uncertainties can be seen by their influence on the signal strength parameter, µ, defined as the ratio of the fitted to the assumed signal cross section times branching fraction (see also section 7). The effects of the most important sources of systematic uncertainty are shown for two signal assumptions: table 4 shows a low-mass pseudoscalar boson hypothesis (mA = 150 GeV, tan β = 5.7) and table 5 a highmass pseudoscalar boson hypothesis (mA = 350 GeV, tan β = 14). The tan β values chosen correspond to the observed limits for the respective mA assumptions (see section 7). The size of the systematic uncertainty on µ varies strongly with tan β. In these tables, “Multijet background” entries refer to uncertainties inherent to the methods used in estimation of the multi-jet background in the various channels of this search. The largest contribution comes from the stability of the ratio of opposite-sign to same-sign events used in the twodimensional sideband extrapolation method for the multi-jet background estimation.. 20.
(23) Source of uncertainty Lepton-to-τhad fake rate τhad energy scale Jet energy scale and resolution Electron reconstruction & identification Simulated backgrounds cross section and acceptance Luminosity Muon reconstruction & identification b-jet identification Jet-to-τhad fake rate for electroweak processes (τlep τhad ) Multi-jet background (τlep τlep , τlep τhad ) Associated with the τ -embedded Z → µµ sample Signal acceptance eµ trigger τhad identification. Uncertainty on µ (%) 14 12 11 8.1 7.5 7.4 7.2 6.6 6.2 6.1 5.3 2.0 1.5 0.8. Table 4. The effect of the most important sources of uncertainty on the signal strength parameter, µ, for the signal hypothesis of mA = 150 GeV, tan β = 5.7. For this signal hypothesis only the h/H/A → τlep τhad and h/H/A → τe τµ channels are used.. Source of uncertainty τhad energy scale Multi-jet background (τhad τhad , τlep τhad ) τhad identification Jet-to-τhad fake rate for electroweak processes τhad trigger Simulated backgrounds cross section and acceptance Signal acceptance Luminosity Associated with the τ -embedded Z → µµ sample Lepton identification. Uncertainty on µ (%) 15 9.8 7.9 7.6 7.4 6.6 4.7 4.1 1.2 0.7. Table 5. The effect of the most important sources of uncertainty on the signal strength parameter, µ, for the signal hypothesis of mA = 350 GeV, tan β = 14. For this signal hypothesis only the h/H/A → τlep τhad and h/H/A → τhad τhad channels are used.. 21.
(24) 7. Results. The results from the channels studied in this search are combined to improve the sensitivity to MSSM Higgs boson production. Each of the channels used here is optimized for a specific Higgs boson mass regime. In particular, the τe τµ channel, the τlep τhad tag category, and the τlep τhad veto category are used for the range 90 ≤ mA < 200 GeV. The τlep τhad high mass category and the τhad τhad channel are used for mA ≥ 200 GeV. The event selection in these categories is such that the low mass categories, i.e. those that target 90 ≤ mA < 200 GeV, are sensitive to the production of all three MSSM Higgs bosons, h, H and A. In contrast, the categories that target mA ≥ 200 GeV are sensitive only to H and A production. The parameter of interest in this search is the signal strength, µ, defined as the ratio of the fitted signal cross section times branching fraction to the signal cross section times branching fraction predicted by the particular MSSM signal assumption. The value µ = 0 corresponds to the absence of signal, whereas the value µ = 1 suggests signal presence as predicted by the theoretical model under study. The statistical analysis of the data employs a binned likelihood function constructed as the product of Poisson probability terms as an estimator of µ. Signal and background predictions depend on systematic uncertainties, which are parameterized as nuisance parameters and are constrained using Gaussian functions. The binned likelihood function is constructed in bins of the MMC mass for the τe τµ and the τlep τhad channels and in bins of total transverse mass for the τhad τhad channel. Since the data are in good agreement with the predicted background yields, exclusion limits are calculated. The significance of any small observed excess in data is evaluated by quoting p-values to quantify the level of consistency of the data with the mu=0 hypothesis. Exclusion limits use the modified frequentist method known as CLs [90]. Both the exclusion limits and p-values are calculated using the asymptotic approximation [91]. The test statistic used for the exclusion limits derivation is the q̃µ test statistic and for the p-values the q0 test statistic6 [91]. The lowest local p-values are calculated assuming a single scalar boson φ with narrow natural width with respect to the experimental mass resolution. The lowest local p-value for the combination of all channels corresponds to 0.20, or 0.8 σ in terms of Gaussian standard deviations, at mφ = 200 GeV. For the individual channels, the lowest local pvalue in τhad τhad is 0.10 (or 1.3 σ) at mφ = 250 GeV and for the τlep τhad 0.10 (or 1.3 σ) 6. and. The definition of the test statistics used in this search is the following: ˆ ˆ −2 ln(L(µ, θ̂)/L(0, θ̂)) ˆ q̃µ = −2 ln(L(µ, θ̂)/L(µ̂, θ̂)) 0 q0 =. (. ˆ −2 ln(L(0, θ̂)/L(µ̂, θ̂)) 0. if µ̂ < 0 if 0 ≤ µ̂ ≤ µ if µ̂ > µ if µ̂ ≥ 0 if µ̂ < 0. where L(µ, θ) denotes the binned likelihood function, µ is the parameter of interest (i.e. the signal strength parameter), and θ denotes the nuisance parameters. The pair (µ̂, θ̂) corresponds to the global maximum of ˆ the likelihood, whereas (x, θ̂) corresponds to a conditional maximum in which µ is fixed to a given value x.. 22.
(25) at mφ = 90 GeV. In the τlep τlep channel there is no excess in the mass region used for the combination (90 ≤ mφ < 200 GeV). Expected and observed 95% confidence level (CL) upper limits for the combination of all channels are shown in figure 9(a) for the MSSM mmax scenario with MSUSY = 1 TeV h [21, 22]. In this figure, the theoretical MSSM Higgs cross-section uncertainties are not included in the reported result, but their impact is shown separately, by recalculating the upper limits again after considering the relevant ±1σ variations. Figure 9(b) shows the upper limits for each channel separately for comparison. The best tan β constraint for the combined search excludes tan β > 5.4 for mA = 140 GeV, whereas, as an example, tan β > 37 is excluded for mA = 800 GeV. Figure 9(a) shows also contours of constant mh scenario. Assuming that the light CP-even Higgs boson of the and mH for the MSSM mmax h MSSM has a mass of about 125 GeV and taking into consideration the 3 GeV uncertainty in the mh calculation in the MSSM [23], only the parameter space that is compatible with 122 < mh < 128 GeV is allowed. From this consideration it is concluded that if the light CP-even Higgs boson of the MSSM is identified with the particle discovered at the LHC, then for this particular MSSM scenario mA < 160 GeV is excluded for all tan β values. Similarly, tan β > 10 and tan β < 4 are excluded for all mA values. Figure 10 shows the expected and observed upper limits for the MSSM mmod+ and mmod− scenarios [23]. Again, h h the combination of all channels is shown and the impact of signal cross-section uncertainties is shown separately. Under the assumption that the light CP-even Higgs boson of the MSSM is identified with the particle discovered at the LHC and taking into account the scenario case, the region with mA < 200 GeV is same considerations as in the mmax h excluded for all tan β values, whereas tan β < 5.5 is excluded for all values of mA for both the MSSM mmod+ and mmod− scenarios. h h The outcome of the search is further interpreted in the case of a single scalar boson φ, with narrow width relative to the experimental mass resolution, produced in either the gluon fusion or b-associated production mode and decaying to τ τ . Figure 11 shows 95% CL upper limits on the cross section times the τ τ branching fraction based on this interpretation. The exclusion limits for the production cross section times the branching fraction for a scalar boson decaying to τ τ are shown as a function of the scalar boson mass. The excluded cross section times branching fraction values range from σ × BR > 29 pb at mφ = 90 GeV to σ × BR > 7.4 fb at mφ = 1000 GeV for a scalar boson produced via gluon fusion. The exclusion range for the b-associated production mechanism ranges from σ × BR > 6.4 pb at mφ = 90 GeV to σ × BR > 7.2 fb at mφ = 1000 GeV.. 23.
(26) mh = 122 GeV. 30. mH=170 GeV. 40. 20. tanβ. scenario, MSUSY = 1 TeV, h/H/A→ ττ. Obs 95% CL limit Exp 95% CL limit 1σ 2 σ Obs 95% CL limit ± 1 σtheory. 50. -1. 80 70 60. mH=700 GeV. MSSM. 60. max mh. ∫ L dt = 19.5 - 20.3 fb. mH=500 GeV. 70. ATLAS s=8 TeV,. mH=300 GeV. tanβ. 80. ATLAS MSSM. 50. τlepτhad. 40. τhadτhad. scenario, MSUSY = 1 TeV, h/H/A→ ττ. τlepτlep. 30. 10. -1. 95% CL limit. mh = 130.2 GeV. mh = 130 GeV. ∫ L dt = 19.5 - 20.3 fb. s=8 TeV,. max mh. 20 10. mh = 128 GeV mh = 125 GeV. 100 200 300 400 500 600 700 800 900 1000. 100 200 300 400 500 600 700 800 900 1000. mA [GeV]. mA [GeV]. (a). (b). 40 30 20. -1. scenario, MSUSY = 1 TeV, h/H/A→ ττ mH=700 GeV. modmh. Obs 95% CL limit Exp 95% CL limit 1σ 2 σ Obs 95% CL limit ± 1 σtheory. 50. mh = 125 GeV. 10. MSSM. 60. mh = 126 GeV. ∫ L dt = 19.5 - 20.3 fb. ATLAS s=8 TeV,. mH=500 GeV. 70. mh = 126.2 GeV. mh = 126 GeV mH=300 GeV. mh = 126.2 GeV. 80. mH=170 GeV. 20. mH=170 GeV. 40 30. scenario, MSUSY = 1 TeV, h/H/A→ ττ. Obs 95% CL limit Exp 95% CL limit 1σ 2 σ Obs 95% CL limit ± 1 σtheory. 50. ∫. mH=700 GeV. MSSM. 60. mod+ mh. L dt = 19.5 - 20.3 fb-1. mH=500 GeV. 70. ATLAS s=8 TeV,. tanβ. 80. mH=300 GeV. tanβ. Figure 9. Expected (dashed line) and observed (solid line with markers) 95% CL upper limits on tan β as a function of mA for the mmax scenario of the MSSM (a) for the combination of all h channels and (b) for each channel separately. Values of tan β above the lines are excluded. The vertical dashed line at 200 GeV in (a) indicates the transition point between low- and high-mass categories. Lines of constant mh and mH are also shown in (a) in red and blue colour, respectively. For more information, see text.. mh = 125 GeV. 10. mh = 122 GeV. mh = 122 GeV. mh = 115 GeV. mh = 115 GeV. 100 200 300 400 500 600 700 800 900 1000. 100 200 300 400 500 600 700 800 900 1000. mA [GeV]. mA [GeV]. (a). (b). Figure 10. Expected (dashed line) and observed (solid line with markers) 95% CL upper limits on tan β as a function of mA for (a) the mmod+ and (b) the mmod− benchmark scenarios of the h h MSSM. The same notation as in figure 9(a) is used.. 24.
(27) ATLAS 2. 10. s=8 TeV,. ∫ L dt = 19.5 - 20.3 fb. -1. φ → ττ. gluon fusion. Obs 95% CL limit Exp 95% CL limit 1σ 2 σ. 10 1. 103. σ × BR( φ → ττ) [pb]. σ × BR( φ → ττ) [pb]. 103. ATLAS 2. 10. s=8 TeV,. ∫ L dt = 19.5 - 20.3 fb. -1. b-associated production. φ → ττ. Obs 95% CL limit Exp 95% CL limit 1σ 2 σ. 10 1. 10-1. 10-1. 10-2. 10-2. 10-3100 200 300 400 500 600 700 800 900 1000 mφ [GeV]. 10-3100 200 300 400 500 600 700 800 900 1000 mφ [GeV]. (a). (b). Figure 11. Expected (dashed bold line) and observed (solid bold line) 95% CL upper limits on the cross section of a scalar boson φ produced via (a) gluon fusion and (b) in association with b-quarks times the branching fraction into τ pairs. The vertical dashed line at 200 GeV indicates the transition point between low- and high-mass categories.. 25.
(28) 8. Summary. A search is presented for the neutral Higgs bosons of the Minimal Supersymmetric Standard Model in proton–proton collisions at the centre-of-mass energy of 8 TeV with the ATLAS experiment at the LHC. The integrated luminosity used in the search is 19.5–20.3 fb−1 . The search uses the τ τ final state. In particular, the following cases are considered: one τ lepton decays to an electron and the other to a muon (τe τµ ), one τ lepton decays to an electron or muon and the other hadronically (τlep τhad ) and finally both τ leptons decay hadronically (τhad τhad ). The sensitivity is improved by performing a categorisation based on expected Higgs boson mass and production mechanisms. The search finds no indication of an excess over the expected background in the channels considered and 95% CL limits are set, which provide tight constraints in the MSSM parameter space. In particular, in the scenario the lowest tan β constraint excludes tan β > 5.4 for context of the MSSM mmax h mA = 140 GeV. Upper limits for the production cross section times τ τ branching fraction of a scalar boson versus its mass, depending on the production mode, are also presented. The excluded cross section times τ τ branching fraction ranges from about 30 pb to about 7 fb depending on the Higgs boson mass and the production mechanism.. Acknowledgements We thank CERN for the very successful operation of the LHC, as well as the support staff from our institutions without whom ATLAS could not be operated efficiently. We acknowledge the support of ANPCyT, Argentina; YerPhI, Armenia; ARC, Australia; BMWFW and FWF, Austria; ANAS, Azerbaijan; SSTC, Belarus; CNPq and FAPESP, Brazil; NSERC, NRC and CFI, Canada; CERN; CONICYT, Chile; CAS, MOST and NSFC, China; COLCIENCIAS, Colombia; MSMT CR, MPO CR and VSC CR, Czech Republic; DNRF, DNSRC and Lundbeck Foundation, Denmark; EPLANET, ERC and NSRF, European Union; IN2P3-CNRS, CEA-DSM/IRFU, France; GNSF, Georgia; BMBF, DFG, HGF, MPG and AvH Foundation, Germany; GSRT and NSRF, Greece; ISF, MINERVA, GIF, I-CORE and Benoziyo Center, Israel; INFN, Italy; MEXT and JSPS, Japan; CNRST, Morocco; FOM and NWO, Netherlands; BRF and RCN, Norway; MNiSW and NCN, Poland; GRICES and FCT, Portugal; MNE/IFA, Romania; MES of Russia and ROSATOM, Russian Federation; JINR; MSTD, Serbia; MSSR, Slovakia; ARRS and MIZŠ, Slovenia; DST/NRF, South Africa; MINECO, Spain; SRC and Wallenberg Foundation, Sweden; SER, SNSF and Cantons of Bern and Geneva, Switzerland; NSC, Taiwan; TAEK, Turkey; STFC, the Royal Society and Leverhulme Trust, United Kingdom; DOE and NSF, United States of America. The crucial computing support from all WLCG partners is acknowledged gratefully, in particular from CERN and the ATLAS Tier-1 facilities at TRIUMF (Canada), NDGF (Denmark, Norway, Sweden), CC-IN2P3 (France), KIT/GridKA (Germany), INFN-CNAF (Italy), NL-T1 (Netherlands), PIC (Spain), ASGC (Taiwan), RAL (UK) and BNL (USA) and in the Tier-2 facilities worldwide.. 26.
(29) References [1] ATLAS Collaboration, Observation of a new particle in the search for the Standard Model Higgs boson with the ATLAS detector at the LHC, Phys. Lett. B 716 (2012) 1–29, [arXiv:1207.7214]. [2] CMS Collaboration, Observation of a new boson at a mass of 125 GeV with the CMS experiment at the LHC, Phys. Lett. B 716 (2012) 30–61, [arXiv:1207.7235]. [3] ATLAS Collaboration, Measurements of Higgs boson production and couplings in diboson final states with the ATLAS detector at the LHC, Phys. Lett. B 726 (2013) 88–119, [arXiv:1307.1427]. [4] ATLAS Collaboration, Evidence for the spin-0 nature of the Higgs boson using ATLAS data, Phys. Lett. B 726 (2013) 120–144, [arXiv:1307.1432]. [5] CMS Collaboration, Evidence for the direct decay of the 125 GeV Higgs boson to fermions, Nature Phys. 10 (2014) [arXiv:1401.6527]. [6] CMS Collaboration, Measurement of the properties of a Higgs boson in the four-lepton final state, Phys.Rev. D 89 (2014) 092007, [arXiv:1312.5353]. [7] CMS Collaboration, Measurement of Higgs boson production and properties in the WW decay channel with leptonic final states, JHEP 01 (2014) 096, [arXiv:1312.1129]. [8] F. Englert and R. Brout, Broken symmetry and the mass of gauge vector mesons, Phys. Rev. Lett. 13 (1964) 321–323. [9] P. W. Higgs, Broken symmetries, massless particles and gauge fields, Phys. Lett. 12 (1964) 132–133. [10] P. W. Higgs, Broken symmetries and the masses of gauge bosons, Phys. Rev. Lett. 13 (1964) 508–509. [11] P. W. Higgs, Spontaneous symmetry breakdown without massless bosons, Phys. Rev. 145 (1966) 1156–1163. [12] G. Guralnik, C. Hagen, and T. Kibble, Global conservation laws and massless particles, Phys. Rev. Lett. 13 (1964) 585–587. [13] T. Kibble, Symmetry breaking in non-Abelian gauge theories, Phys. Rev. 155 (1967) 1554–1561. [14] A. Djouadi, The Anatomy of electro-weak symmetry breaking. II. The Higgs bosons in the minimal supersymmetric model, Phys. Rept. 459 (2008) 1–241, [hep-ph/0503173]. [15] Theory and phenomenology of two-Higgs-doublet models, Phys. Rept. 516 (2012) 1–102, [arXiv:1106.0034]. [16] P. Fayet, Supersymmetry and Weak, Electromagnetic and Strong Interactions, Phys. Lett. B 64 (1976) 159. [17] P. Fayet, Spontaneously Broken Supersymmetric Theories of Weak, Electromagnetic and Strong Interactions, Phys. Lett. B 69 (1977) 489. [18] G. R. Farrar and P. Fayet, Phenomenology of the Production, Decay, and Detection of New Hadronic States Associated with Supersymmetry, Phys. Lett. B 76 (1978) 575–579. [19] P. Fayet, Relations Between the Masses of the Superpartners of Leptons and Quarks, the Goldstino Couplings and the Neutral Currents, Phys. Lett. B 84 (1979) 416.. 27.
(30) [20] S. Dimopoulos and H. Georgi, Softly Broken Supersymmetry and SU(5), Nucl. Phys. B 193 (1981) 150. [21] S. Heinemeyer, W. Hollik, and G. Weiglein, Constraints on tan Beta in the MSSM from the upper bound on the mass of the lightest Higgs boson, JHEP 06 (2000) 009, [hep-ph/9909540]. [22] M. Carena, S. Heinemeyer, C. E. M. Wagner and G. Weiglein, Suggestions for benchmark scenarios for MSSM Higgs boson searches at hadron colliders, Eur. Phys. J. C 26 (2003) 601, [hep-ph/0202167]. [23] M. Carena, S. Heinemeyer, O. Stål, C. Wagner, and G. Weiglein, MSSM Higgs Boson Searches at the LHC: Benchmark Scenarios after the Discovery of a Higgs-like Particle, Eur. Phys. J. C 73 (2013) 2552, [arXiv:1302.7033]. [24] Measurement of the Higgs boson mass from the H → γγ and H → ZZ ∗ → 4ℓ channels with the ATLAS detector using 25 fb−1 of pp collision data, arXiv:1406.3827. [25] P. Bechtle et al., MSSM Interpretations of the LHC Discovery: Light or Heavy Higgs?, Eur. Phys. J. C 73 (2013) 2354, [arXiv:1211.1955]. [26] A. Arbey, M. Battaglia, A. Djouadi, and F. Mahmoudi, The Higgs sector of the phenomenological MSSM in the light of the Higgs boson discovery, JHEP 09 (2012) 107, [arXiv:1207.1348]. [27] ALEPH, DELPHI, L3, and OPAL Collaborations, S. Schael et al., Search for neutral MSSM Higgs bosons at LEP, Eur. Phys. J. C 47 (2006) 547–587, [hep-ex/0602042]. [28] Tevatron New Phenomena & Higgs Working Group Collaboration, B. Doug et al., Combined CDF and D0 upper limits on MSSM Higgs boson production in τ τ final states with up to 2.2 fb−1 , arXiv:1003.3363. [29] CDF Collaboration, T. Aaltonen et al., Search for Higgs bosons predicted in two-Higgs-doublet models via decays to τ lepton pairs in 1.96 TeV proton–antiproton collisions, Phys. Rev. Lett. 103 (2009) 201801, [arXiv:0906.1014]. [30] D0 Collaboration, V. M. Abazov et al., Search for Higgs bosons decaying to τ pairs in pp̄ collisions with the D0 detector, Phys. Rev. Lett. 101 (2008) 071804, [arXiv:0805.2491]. [31] ATLAS Collaboration, Search for the neutral Higgs bosons of the minimal supersymmetric √ standard model in pp collisions at s = 7 TeV with the ATLAS detector, JHEP 02 (2013) 095, [arXiv:1211.6956]. [32] CMS Collaboration, Search for neutral MSSM Higgs bosons decaying to a pair of tau leptons in pp collisions, arXiv:1408.3316. [33] LHCb Collaboration, R. Aaij et al., Limits on neutral Higgs boson production in the forward √ region in pp collisions at s = 7 TeV, JHEP 05 (2013) 132, [arXiv:1304.2591]. [34] ATLAS Collaboration, The ATLAS experiment at the CERN Large Hadron Collider, JINST 3 (2008) S08003. [35] ATLAS Collaboration, Search for the Standard Model Higgs boson in the H → τ τ decay √ mode in s=7 TeV pp collisions with ATLAS, JHEP 09 (2012) 070, [arXiv:1206.5971]. [36] ATLAS Collaboration, The ATLAS simulation infrastructure, Eur. Phys. J. C 70 (2010) 823–874, [arXiv:1005.4568]. [37] GEANT4 Collaboration, S. Agostinelli et al., GEANT4 - a simulation toolkit, Nucl. Instrum. Meth. A 506 (2003) 250–303.. 28.
Figure
+7
Documento similar
63 Department of Physics and Astronomy, Iowa State University, Ames IA, United States of America. 64 Joint Institute for Nuclear Research, JINR Dubna,
78 Department of Physics and Astronomy, University College London, London, United Kingdom. 79 Louisiana Tech University, Ruston
University at Albany, Albany, NY, United States Department of Physics, University of Alberta, Edmonton, AB, Canada 3 a Department of Physics, Ankara University, Ankara; b Department
Javakhishvili Tbilisi State University, Tbilisi; b High Energy Physics Institute, Tbilisi State University, Tbilisi, Georgia 52 II Physikalisches Institut,
Javakhishvili Tbilisi State University, Tbilisi; b High Energy Physics Institute, Tbilisi State University, Tbilisi, Georgia II Physikalisches Institut,
United States of America o Also at Department of Financial and Management Engineering, University of the Aegean, Chios, Greece p Also at Institucio Catalana de Recerca i
Petersburg, Russia l Also at Chinese University of Hong Kong, China m Also at Department of Financial and Management Engineering, University of the Aegean, Chios, Greece n Also
Petersburg, Russia Department of Physics and Astronomy, University of Pittsburgh, Pittsburgh PA, United States of America a Laboratório de Instrumentação e Fı́sica Experimental
