Methodology and applications for the benefit cost analysis of the seismic risk reduction of building portfolios at broad scale
29
0
0
Texto completo
(2) Methodology and applications for the Benefit Cost Analysis of the seismic risk reduction of building portfolios at broad scale Nat Hazards (2013) 69:845–868 DOI 10.1007/s11069-013-0739-2 Jairo A. Valcárcel,a) Miguel G. Mora,b) Omar D. Cardona,c), Lluis G. Pujades,a), Alex H. Barbat,b) and Gabriel A. Bernal b) a). Department of Geotechnical Engineering and Geosciences, Civil Engineering School, Technical University of Catalonia, Building D2, Campus Norte UPC, Jordi Girona 1-3, 08034 Barcelona, Spain. b). Department of Structural Mechanics, Civil Engineering School, Technical University of Catalonia, Building C1, Campus Norte UPC, Jordi Girona 1-3, 08034 Barcelona, Spain. c). Universidad Nacional de Colombia, Campus Palogrande. IDEA, Cra. 27 No. 64-60, Manizales, Colombia Corresponding Author Jairo A. Valcárcel E-mail address: [email protected] Telephone +34 93 4016485. Abstract This article presents a methodology for an estimate of the benefit cost ratio of the seismic risk reduction of buildings portfolio at broad scale, for a World region, allowing comparing the results obtained for the countries belonging to that region. This methodology encompasses: i) the generation of a set of random seismic events and the evaluation of the spectral accelerations at the buildings location; ii) the estimation of the buildings built area, the economic value, as well as the classification in structural typologies; iii) the development of vulnerability curves for each typology; iv) the estimation of the annual average loss of the buildings portfolio in the current conditions as well as in the case of a hypothetical structural intervention. The benefit cost ratio is obtained by comparing the annual average loss with the reinforcement costs. This methodology has been applied to the portfolio of public schools of fourteen countries of Latin America and The Caribbean, for evaluating the feasibility of the seismic risk reduction at a national scale. Keywords: Seismic risk, Benefit Cost Analysis, Retrofitting of schools. INTRODUCTION Risk assessment and risk reduction require information regarding the typology of the buildings, their location and their structural properties. It is also valuable to identify the economic value of the buildings, their use and the number of inhabitants. The construction techniques and the structural typologies are usually identified by building inspections (see Carreño et al. 2010; IGC 1.
(3) 2010). Starting from all these data, and in order to assess the seismic performance of the most common existing buildings, it is necessary to perform a detailed structural modeling and analysis, taking into account their structural characteristics, the local seismic hazard and safety requirements (see Faleiro et al. 2008; Mata et al. 2008; Vielma et al. 2010; Vargas et al. 2010; Vargas et al. 2011). On this basis, alternatives for possible structural interventions are defined (López et al 2007). For seismic safety and risk management and reduction, Barbat et al. (2006), Barbat et al. (2008), Carreño et al (2007a), Carreño et al. (2007 b), Lantada et al. (2010) and Lantada et al (2011) proposed procedures for developing seismic scenarios useful to identify, at urban scale, the most critical administrative zones regarding the vulnerability of buildings and the expected losses. For prioritization purposes, simplified assessment methods have been proposed in order to score the safety of the buildings. In the case of schools, damage assessments using vulnerability indexes have been developed in Portugal and Istanbul (Ferreira et al. 2008; Ferreira y Proença 2008). Capacity indexes and interstory drift indexes have been also considered in Istanbul (Yakut et al. 2008) and Bogotá (Proyectos y Diseños – P&D 2000). In order to balance the complexity of the damage assessment and the amount of buildings studied, Gran et al. (2007) present a multi level procedure for prioritization of the seismic intervention of school buildings including indexes based on the peak ground acceleration, vulnerability indexes and a simplified structural mechanics-based structural assessment. At a broad regional scale, the seismic risk assessment of a portfolio of buildings (for example, hospitals, infrastructure of lifelines, public buildings and schools) is very useful for policy making, risk perception and communication. Obtaining detailed information for the buildings and developing detailed models of their performance, are activities that require a significant effort that makes them not feasible. Moreover, at this scale, the decision making process requires risk assessments aggregated by countries or by subnational administrative units, useful for scoring areas according to their seismic risk. Therefore, simplified methods, as well as gross assumptions regarding the vulnerability of the buildings, must be considered. This article presents a risk based methodology for an appraisal of the feasibility of the structural intervention of portfolios of buildings at the national scale, aiming to obtain benefit cost ratios of the structural intervention. The concrete objectives of this application are: i) the generation of a set of random seismic events and the evaluation of the spectral accelerations at the buildings location ii) to develop a proxy of the built area and their vulnerability; iii) to estimate the Loss Exceedance Curve (LEC) and the Average Annual Loss (AAL) of the buildings portfolio in both the current and retrofitted case and iv) to obtain an estimate of the cost-benefit ratio of the seismic risk mitigation alternatives. The proposed methodology follows the structure of the catastrophe models which is a robust approach from a financial perspective (Grossi & Kuhnreuther 2005). The contributions of this methodology are as follows: (i) the estimation of the AAL for the current and retrofitted case by following a probabilistic approach; (ii) the adoption of a simplified procedure in order to estimate the present value of the AAL for both alternatives; and (iii) the definition of a Benefit Cost Ratio, BCR, as the difference of the estimates of the present value of the AAL, compared with the retrofitting costs. This procedure is useful for making risk based decisions, given that losses are 2.
(4) estimated for all the potential seismic events to which buildings are exposed. This methodology has been applied to countries of Latin America and the Caribbean. This study was promoted by the International Labor Office, through its Programme on Crisis Response and Reconstruction (ILO /CRISIS), and by the International Strategy for Disaster Reduction (UNISDR), in order to evaluate the seismic risk of schools. The obtained results were included in the Global Assessment Report (GAR 2011; ERN-AL 2010) as a case study of the benefits of investments in vulnerability reduction.. METHODOLOGY FOR BENEFIT COST ANALYSIS Defining the adequate level of safety of a building regarding the seismic hazard is an optimization problem. In this sense, Li et al. (2009) presents an expected utility approach of benefit cost analysis, in which, the optimal investment satisfies the equivalence between marginal benefits and costs. According to Hadjian (2002), for making risk based decisions, it is necessary to consider that any structure is potentially exposed, during its design life, to all possible ground motions intensities at a given site which is characterized by the site specific seismic hazard curves. This opinion is confirmed by Smyth et al. (2004a) and Smyth et al. (2004b) who perform a benefit cost analysis for a specific building typology, taking into account all possible ground motion intensities according to the seismicity of the region and estimating the present value of losses for a given time horizon. A similar approach is developed by Kappos & Dimitrakopoulos (2008) in order to evaluate the economic feasibility of the seismic retrofitting of a set o heterogeneous buildings. Based on the works of Smyth et al (2004a), Kappos & Dimitrakopoulos (2008) and Mora et al. (2011), we propose in this article a Benefit Cost Ratio (BCR) estimated as the difference between the present value of the losses in the current and retrofitted cases divided by the retrofitting costs. BCR . LU LR CR. (1). In this equation, LU is the net present value of the losses due to all future earthquakes for the unreinforced case; LR is the net present value of the losses due to all future earthquakes for the retrofitted case and CR is the retrofitting costs. The BCR has been adopted herein in order to evaluate the feasibility of the seismic risk reduction of the buildings portfolio. The methodology for obtaining the net present value of the losses, as well as the Benefit Cost Ratio is explained in this section. This procedure encompasses the following steps: generation of a set of stochastic events and the corresponding ground motion fields, the description of the exposed buildings and their vulnerability, and the estimation of the expected losses of the buildings portfolios.. SEISMIC HAZARD EVENTS At a national level, the main seismic sources are geometrically defined based on available geological and tectonic information. Source seismicity parameters are assigned following a 3.
(5) Poisson recurrence model, taking into account seismic catalogues and previous studies. On this basis, a set of seismic events of diverse magnitudes is generated through a sampling procedure, based on the recursive sub division of the geometry of sources. The seismicity parameters of each segment are assigned by weighting its area in relation to the total area. Once generated the set of events, the expected spectral acceleration at the location of the buildings can be obtained by using attenuation laws. Given the random nature of the seismic ground motion, the spectral acceleration is assumed as a random variable with lognormal distribution. The CRISIS 2007 Version 7.2 code (Ordaz et al. 2007) can be used for generating a file which includes multiple grids of the studied territory. Each grid corresponds to the spectral accelerations calculated for each event. Those events are characterized by their magnitudes and their frequency of occurrence.. EXPOSURE The exposed elements are aggregated at a given administrative unit such as, for instance, municipalities. Similar procedures have been proposed by Goran et al. (2009) in order to calculate damages by averaging over an entire city. In order to characterize an exposed portfolio, it is necessary to identify: i) the built area of the portfolio of buildings aggregated by a given administrative unit; ii) the economic value and iii) the representative structural typologies. Those estimations are based on coarse grain data or on expert opinions. Regarding the built area, for each municipality (or any administrative unit) this value can be obtained as a relationship between the number of inhabitants and an average built area per inhabitant. The number of inhabitants can be obtained from data available in the national census. Finally, the economic value of the buildings can be obtained by using representative prices per square meter of the buildings. At national level, the representative structural typologies can be selected depending on the predominant building classes and techniques, according to the basic structural system, typical height and period of construction (Bommer et al. 2002; Barbat et al. 2007). The development of surveys and field inspections in order to identify the structural typologies, as well as the use of detailed computational models for defining their seismic performance are desirable, especially for making decisions about structural interventions (López et al. 2007). Given that the time and cost required for this procedure could be large, expert’s opinion can be considered, as well the description of the buildings typologies available in databases such as, for instance, the World Housing Encyclopedia-WHE (EERI-IAEE (2012), see http://www.worldhousing.net/, or the PAGER-WHE (Jaiswal et al. 2010).. VULNERABILITY Vulnerability curves are developed for all the structural typology considered in the analysis. These curves describe the expected value of the loss and its standard deviation as a function of the. 4.
(6) spectral acceleration estimated at the buildings location. The loss is expressed as a ratio of the structural reparation costs to the reposition value of the building. The vulnerability curves are defined based on the parameters of the bilinear capacity spectrum of each typology. In Barbat et al. (2006), Barbat et al. (2008) and Lantada et al. (2011) are given procedures allowing to obtain the capacity curves and capacity spectra for building structures. It is assumed a loss value β0 of 5% corresponding to the displacement at the yielding point, 0, identified in the bilinear capacity spectrum. For the spectral displacement corresponding to the ultimate capacity point, a loss value of 100% is assumed. Under these considerations, the expected value of the loss, βi, for a given spectral displacement, i, can be obtained by using the following expression (Miranda, 1999; Ordaz, 2000): ε γi E βi | γi 1 exp ln 1 β0 γ0 . (2). where ε is a factor used in order to fit the curve to the levels of loss defined for the point of ultimate capacity. Since in the hazard module the seismic action is expressed in terms of the spectral acceleration, it is necessary to convert those values into spectral displacement using the following equation (Miranda et al., 1999): 2. T i 1 2 3 e 2 Sa T 4. (3). where Te is the period of the structural typology; β1 is the ratio between the maximum lateral displacement at the upper level of the structure and the spectral displacement, considering linearelastic behaviour; β2 is the ratio between the maximum storey drift and the maximum lateral displacement at the upper level divided by its total height; β3 is the ratio between maximum lateral displacement with inelastic behaviour and the maximum lateral elastic displacement. We considered in this study that the loss follows a Beta distribution function. P| i . a b a 1 1 b1 a b . (4). where the parameters a and b of the distribution may be computed from the expected value of the loss (Ordaz et al. 1998 a), given a specific spectral displacement (see Equation 2). a. 1 E | i E | i C 2 C 2 . (5). 1 E | i b a (6) E | i and the coefficient of variation of the loss C2(β) can be calculated as follows:. 5.
(7) 2 | i C E | i 2. In Equation 7,. (7). 2 | i is the variance of the loss at a given spectral displacement. In order to. estimate this parameter, we adopted the damage distribution proposed in ATC 13 (ATC 13 1985). Graf & Lee (2009) assume that the maximum value of the standard deviation of loss is around 0.15 at the 50% of the loss and it decreases as the damage is closer to the loss levels of 0% and 100%. Once established the expected value of the loss and the coefficient of variation, it is possible to estimate its probability distribution, given a specific spectral acceleration.. LOSS ESTIMATION FOR BENEFIT COST ANALISYS For each country and for each event included in the hazard module, the expected economic loss of each exposed element is estimated by using the vulnerability curves associated to the structural typologies. Each event has associated a specific frequency of occurrence. Thus, it is possible to express the losses in function of their annual frequency of occurrence. This information is summarized in the Loss Exceedance Curve (LEC). The LEC specifies the frequencies (also known as the exceedance rate), usually annual, of the events for which a specific loss value may be exceeded (Ordaz et al. 1998 b). The area under the LEC is known as the Average Annual Loss (AAL). The AAL is the expected value of the annual loss and represents, in a simple insurance scheme, the actuarially fair insurance premium. This metric can be obtained by integrating the LEC (Cardona et al. 2010). The exceedance rate of a given loss is obtained as. p . events. PP p | i F i i 1. A. (8). where ν(p) is the exceedance rate of the sum of the losses that may occur in all the exposed elements; FA(i) is the annual frequency of the event ; and P(P>p|i) is the probability of a loss greater than p given the occurrence of the event i. The exceedance rate ν(p) is obtained for the sum of all the potential harmful events. The inverse of ν(p) is the return period of the loss. The procedure to estimate the exceedance rate ν(p) is the following: (i) for a given event included in the hazard model, the probability distribution of the loss is estimated for each exposed element, by using equations (4), (5) and (6); (ii) the probability distribution of the sum of the losses of all exposed elements is estimated according to the loss-aggregation rules proposed by the National Commission for Insurance of Mexico (CIRCULAR S-10.4.1.1); (iii) the probability that the total loss for a hazard scenario exceeds a certain value p is estimated; (iv) the probability estimated in the previous step is multiplied by the annual frequency of occurrence of the event i. This procedure must be repeated for all the events i included in the hazard module. The LEC and the AAL can be estimated by using the software ERN-CAPRA-GIS (Cardona et al. 2010). This open source software was developed by ERN-AL consortium with support of the Interamerican Development Bank, the World Bank and the International Strategy for Disaster 6.
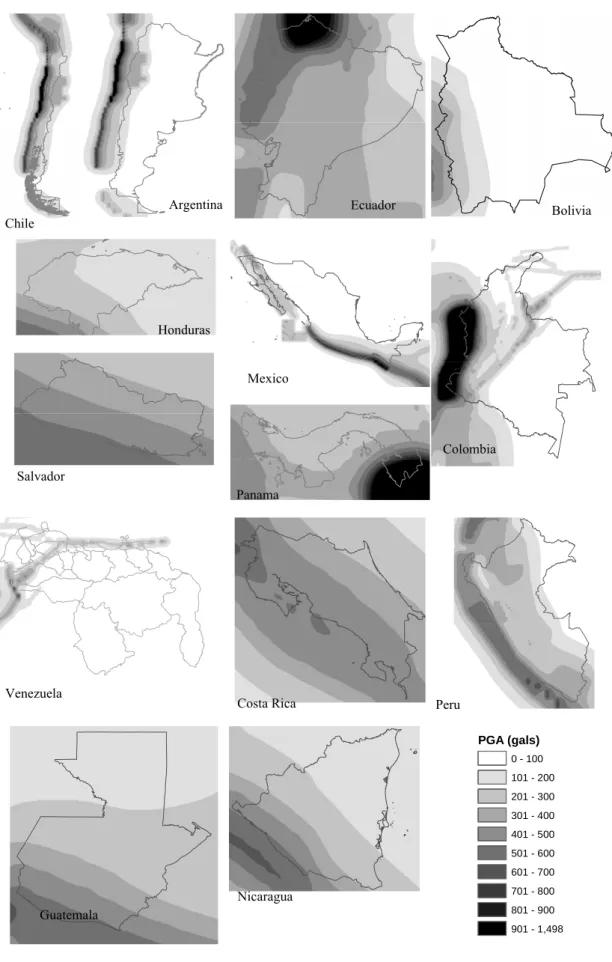
(8) Reduction.. Further. information. about. this. software. is. available. at. the. website. http://www.ecapra.org/. Once the Annual Average Loss has been obtained in the current case, as well as in the case of a hypothetical intervention, the net present value of the loss in the current (LU) and retrofitted (LR) alternative is estimated under the assumption that, in the long term, the expected losses would be equal to the sum of the AAL. In this sense, the AAL could be considered as a loss that occurs indefinitely, in perpetuity. Under this assumption, it is relevant to highlight that the present value of losses are not estimated for a given time horizon (for example 50 years), as suggested by Smyth et al. (2004a) and Li (2009).Therefore, the expected values of LU and LR included in Equation (1) may be calculated as follows:. E[ L ] . E[ ]. (9). . where E[β] is the AAL estimated for each portfolio in both the current and retrofitted cases and corresponds to the discount rate. In order to estimate the expected losses for a given time horizon, it is necessary to consider that both the expected losses and the time when they occur are random variables. Then, based on the LEC, stochastic loss events could be generated for a given time horizon T. On this basis, the present value of losses L could be obtained by following Eq (10). Nevertheless, this procedure is out of the scope of this study. T. L i e ti. (10). i 1. Where L is the present value of losses, T is the time horizon and ti is the time of occurrence of the loss event βi.. APPLICATION OF THE METHODOLOGY The proposed methodology has been applied to evaluate, at the national level, the feasibility of the seismic risk reduction of the public schools of fourteen countries of Latin America and the Caribbean. The countries included in the analysis are: Argentina (ARG), Bolivia (BOL), Chile (CHL), Colombia (COL), Costa Rica (CRI) , Ecuador (ECU), El Salvador (SLV), Guatemala (GTM), Honduras (HND), México (MEX), Nicaragua (NIC), Panamá (PAN), Peru (PER) and Venezuela (VEN).. Seismic hazard of the studied countries The geometry of the sources and their seismicity parameters have been defined according to previous studies developed for each country. The references used for the seismic hazard models, as well as the number of seismic scenarios generated are listed in Table 1. The expected spectral acceleration at the center of each municipality has been obtained by using the attenuation laws. 7.
(9) defined by Gallego (1999). Figure 1 shows the seismic hazard in each country considered in this study in terms of the Peak Ground Acceleration (PGA) for a return period of 500 years. Table 1. References used in the seismic hazard model for each country Country Argentina Chile Bolivia Ecuador Mexico Peru Colombia Costa Rica Salvador Guatemala Honduras Nicaragua Panama Venezuela. Number of seismic scenarios 32,712 24,564 43,710 31,422 104,514 50,898 55,338 18,444 21,768 24,450 26,268 26,460 24,342 19,620. Reference. ERN-AL (2009). Comité AIS-300 (1996) Benito et al. (2008) Climent et al. (2008) Escobar et al. (2008) Molina et al. (2008) Estevez & Schubert (1993). Exposed values For each country and each municipality, we estimated the total built area of schools as the product of the number of students by the average area per student. The number of students is obtained from data available in the national census. The public area of schools is estimated as a percentage of the total area. This value depends on the range of population of each municipality (see Table 2). These percentages have been obtained from the average number of pupils on roll in urban and rural areas.. Table 2. Population and percentages of public education by ranges of population Range of population High Medium Low. Public education (%). > 100,000. 50. 20,000 to 100,000. 80. < 20,000. 100. Given the scope of the study and the available information, some simplifications have been made in order to define an average built area per student at national level. These assumptions are related to educational progress indicators, public investments in education and local information about the number of students and built area of schools. From the database of the public school buildings included in the program of vulnerability assessment and seismic risk mitigation in Bogotá, it was found that the built area per student in most of the schools is ranged between 0.9 and 2.1 m2 (see Figure 2). In other sources, like the Manual for Estimating the Socio-Economic Effects of Natural Disasters (ECLAC 2003), different values for the built area per student are suggested. In the case of Argentina, the built area per student is near to 6 m2; for Peru, the classroom area per pupil is around 1.5 m2. 8.
(10) Argentina. Ecuador. Bolivia. Chile. Honduras Mexico. Colombia Salvador Panama. Venezuela. Costa Rica. Peru PGA (gals) 0 - 100 101 - 200 201 - 300 301 - 400 401 - 500 501 - 600 601 - 700. Nicaragua Guatemala. 701 - 800 801 - 900 901 - 1,498. Figure 1. Peak Ground Acceleration for a return period of 500 years. 9.
(11) In order to express the average built area per student in terms of indices of the educational progress of the countries, we considered the Educational for All Development Indicator –EDI (UNESCO 2010). Therefore, by using the indices of built area per student mentioned above and the scale of the EDI, it is possible to estimate the area per pupil under the assumption that the bigger the EDI, the wider the schools. The results of the relation between the EDI and the area per student are. 30% 25% 20% 15% 10% 5% 0% 0-0.3 0.3-0.6 0.6-0.9 0.9-1.2 1.2-1.5 1.5-1.8 1.8-2.1 2.1-2.4 2.4-2.7 2.7-3 3-3.3 3.3 -3.6 3.6-3.9 3.9-4.2 4.2-4.5 4.5-4.8 4.8-5.1 5.1-5.4 5.4-5.7 5.7-6 >6. Percentage of buildings. shown in Figure 3.. Ranges of m2 per student Figure 2. Percentage of buildings by ranges of m2 per student in public schools of Bogotá. Source: Secretaría de Educación del Distrito Capital (2004) 5.0. ARG MEX CHL. m2 per student. 4.5 4.0 3.5. VEN. 3.0. PAN. 2.5. PER. 2.0 1.5 1.0 0.5. NIC GTM. SLV. HND. COL BOL ECU. 0.0. 0.78. 0.82. 0.86. 0.9. 0.94. 0.98. Argentina Bolivia Chile Colombia Costa Rica Ecuador Guatemala Honduras Mexico Nicargua Panama Peru Salvador Venezuela. (ARG) (BOL) (CHL) (COL) (CRI) (ECU) (GTM) (HND) (MEX) (NIC) (PAN) (PER) (SLV) (VEN). EDI. Figure 3. Graphic representation of the area per students in function of the EDI In order to estimate the costs of the built area, we obtained the prices per m2 from national centers of statistics and from data included in the WHE (EERI-IAEE 2012). Nevertheless, this information is incomplete and is not always available for all countries. Therefore, it was necessary to establish a relation between the exposed values per student and the GDP per capita. Thus, the costs per m2 were adjusted according to those parameters (see Figure 4).. 10.
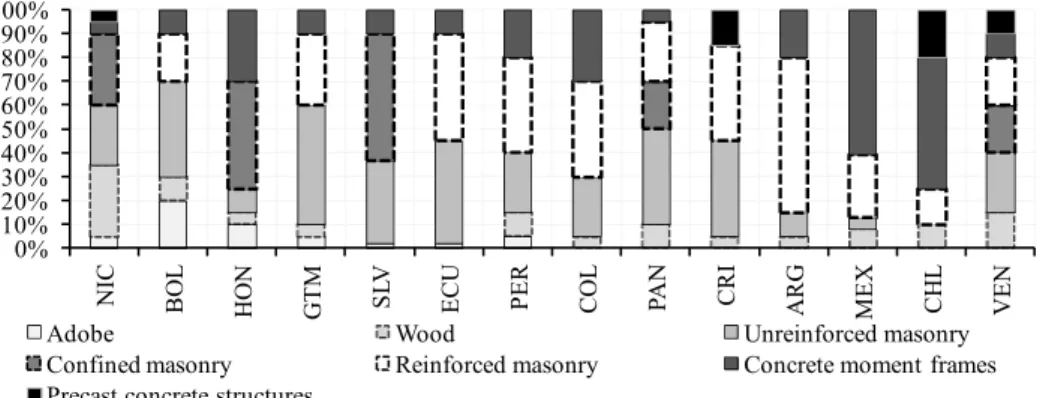
(12) Exposed value (USD) / student. 4,500 4,000 3,500 3,000 2,500 2,000 1,500 1,000 500 0. CHL. VEN. ARG MEX PAN. CRI. PER COL ECU. BOL GTM. NIC. 0. HND. 2,000. Argentina Bolivia Chile Colombia Costa Rica Ecuador Guatemala Honduras Mexico Nicargua Panama Peru Salvador Venezuela. (ARG) (BOL) (CHL) (COL) (CRI) (ECU) (GTM) (HND) (MEX) (NIC) (PAN) (PER) (SLV) (VEN). SLV. 4,000. 6,000. 8,000. 10,000. 12,000. GDP per capita (USD). Figure 4. Relation between the GDP per capita and the exposed value per student For each country, the representative structural typologies were selected according to the data available in the national census regarding the construction materials and characteristics of walls, floors and roofs. Besides, we used the information about predominant building classes and techniques provided by the WHE. We made the assumption that the school buildings were built by using the common construction techniques used in the country. Typically, school buildings are low rise, with 2 or 3 floors. The results of the exposure module are summarized in “shp” format files (shapefiles) which are compatible with geographic information systems. Those files include: i) the id of the municipalities; ii) the representative structural typologies; ii) its location; iii) the scholar built area; iv) the economic value, and v) the number of students. Figure 5 shows, the composition of the schools portfolio by structural typologies on each country. Figure 6 shows for each country, the exposed values estimated, aggregated by municipalities.. VEN. CHL. ARG. CRI. PAN. COL. PER. ECU. Wood Reinforced masonry. MEX. Adobe Confined masonry Precast concrete structures. SLV. GTM. HON. BOL. NIC. 100% 90% 80% 70% 60% 50% 40% 30% 20% 10% 0% Unreinforced masonry Concrete moment frames. Argentina (ARG); Bolivia (BOL); Chile (CHL); Colombia (COL); Costa Rica (CRI); Ecuador (ECU); Guatemala (GTM); Honduras (HND); Mexico (MEX); Nicargua(NIC); Panama (PAN); Peru (PER); Salvador (SLV); Venezuela (VEN). Figure 5. Composition of the built area by structural typologies for each country. 11.
(13) Chile. Argentina. Ecuador. Bolivia. Mexico Honduras Panama. Colombia El Salvador. Costa Rica Venezuela. Peru. Exposed value (in millions USD) 0.0 - 0.5 0.6 - 1.0 1.1 - 2.5 2.6 - 5.0 5.1 - 25.0 25.1 - 100.0 100.1 - 250.0 250.1 - 500.0 500.1 - 1000.0. Guatemala. Nicaragua. 1000.1 - 1500.0. Figure 6. Exposed value of the public schools, for each country, aggregated by municipalities. 12.
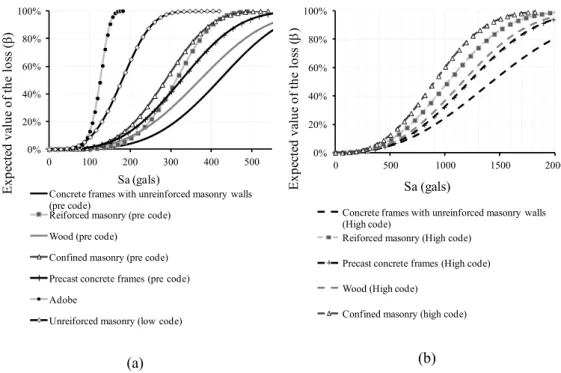
(14) Vulnerability of the schools in the current and retrofitted state Among the countries included in the analysis, there are different seismic regulations for each structural typology, as well as different safety targets for the educational infrastructure. Given the scope of the study, it is not feasible to examine in detail specific buildings, as well as the retrofitting methods and the correspondent vulnerability reduction. Therefore, we made some simplifying hypotheses in order to define the vulnerability curves for the exposed elements. The school buildings have been characterized by structural typologies with low code requirements in the current case and by high code requirements in the case of structural intervention. Then, the feasibility of the seismic risk mitigation of the schools is evaluated by assuming a set of standard structures, whose losses are estimated for all the possible ground motions, according to the correspondent seismic hazard model. For adobe and unreinforced masonry buildings, we considered that, in the retrofitted case, the buildings are replaced by new facilities made of reinforced masonry. This alternative not only improves the seismic safety, but it also represents an opportunity to upgrade the infrastructure. The references of the parameters of the structural typologies considered are shown in Table 3. The expected vulnerability curves for both the current case and the retrofitted case are shown in Figure 7.. Table 3. References of the capacity curves for the current case and the retrofitted case Structural typology Adobe. unreinforced masonry buildings Confined masonry. Current case. Retrofitted. Yamín et al. (2004), Tarque et. Facilities replaced by new. al. (2010).. reinforced masonry buildings. Hazus MH 2003 (FEMA/NIBS. Facilities replaced by new. 2003) Pre code. reinforced masonry buildings. García-Ruiz et al (2010).. Reinforced masonry buildings with precast concrete diaphragms Concrete frames with unreinforced masonry walls. Hazus MH(2003) (FEMA/NIBS 2003) Low code. Hazus MH(2003) (FEMA/NIBS 2003) High code. Precast concrete frames with concrete shear walls Wood structures. From Figure 7(a) it is possible to identify that, in the current conditions, the most vulnerable building typologies are the adobe and the unreinforced masonry buildings; the less vulnerable buildings are the concrete frames with unreinforced masonry walls. It is possible to identify from Figure 5 that the unreinforced masonry buildings are common in most of the countries included in the analysis. The greater percentages of areas built with this typology to the total built area (larger than 40%) correspond to Bolivia, Guatemala, Ecuador, Panama and Costa Rica. The percentage of areas built of adobe buildings to the total built area is relevant in Bolivia and Honduras (20% and 10% respectively). Finally, the percentage of the built areas built with concrete frames buildings to the total built area (greater than 30%) is relevant in Mexico, Chile, Colombia and Honduras. 13.
(15) 100%. 80% 60% 40% 20% 0% 0. 100. 200. 300. 400. 500. Sa (gals) Concrete frames with unreinforced masonry walls (pre code) Reiforced masonry (pre code) Wood (pre code) Confined masonry (pre code) Precast concrete frames (pre code) Adobe Unreiforced masonry (low code). (a). Expected value of the loss (). Expected value of the loss (β). 100%. 80% 60% 40% 20% 0% 0. 500. 1000. 1500. 2000. Sa (gals) Concrete frames with unreinforced masonry walls (High code) Reiforced masonry (High code) Precast concrete frames (High code) Wood (High code) Confined masonry (high code). (b). Figure 7. Vulnerability curves included in the analysis (a) current conditions; (b) after structural intervention. Retrofitting costs Retrofitting costs are related to the structural intervention adopted in order to guarantee the required level of seismic safety of the structures and, therefore, they depend on the structural system of the buildings and on their seismic design. Typical retrofitting costs are suggested in FEMA 156 (FEMA 1994b) and FEMA 157 (FEMA 1994c). In GeoHazards International - Escuela Politécnica Nacional (1995) are also given retrofitting costs per square meter for school buildings of Ecuador. According to Coca (2006), the average costs of the structural intervention of the schools in Bogotá was about 240 US$ per m2. On the other hand, retrofitting costs can be described as a percentage of the buildings value. Kappos & Dimitrakopoulos (2008) assumes that the retrofitting costs are around the 12% of the buildings value. Similar values are given in the retrofitting program of schools developed between 2007 and 2008 in Istanbul (GFRRD, 2009). Taking into account the above mentioned references, in this work we assumed the retrofitting/replacement costs as follows: i) adobe buildings are replaced by new reinforced masonry buildings; ii) for the remaining structural typologies, retrofitting costs were considered as a percentage of the replacement cost, which is considered as the 15% of the building. The discount rate used to convert the costs of losses due to future earthquakes into present monetary values is 3%. Similar values have been suggested by Kappos & Dimitrakopoulos (2008), as well as by the Benefit-Cost Model for the assessment of Seismic Rehabilitation of Federal Buildings (FEMA 1994 a).. 14.
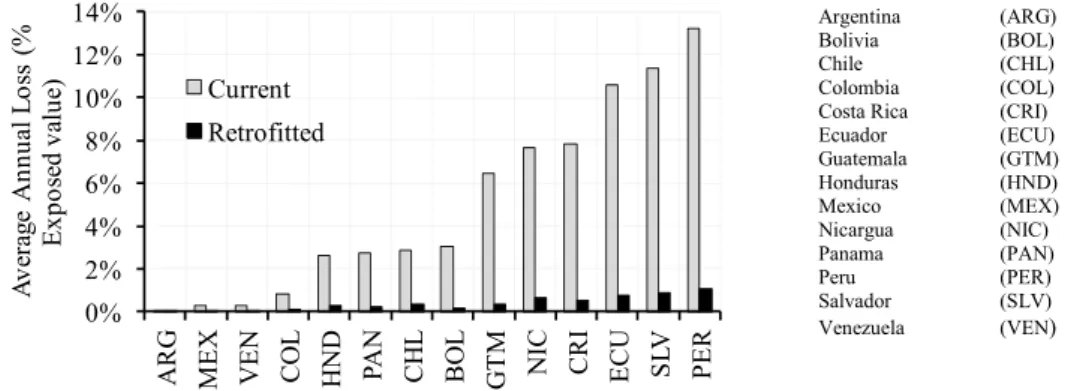
(16) RESULTS Table 4 shows a summary of the exposed values and the calculated BCA at country level. It is possible to identify in Figure 8 three categories of countries according to the estimates of the AAL for the current portfolio of schools. The lower values of the AAL (lower than 1 %) correspond to Argentina, Venezuela, Colombia and Mexico. In the case of Argentina, Colombia and Venezuela, those results reflect a lower concentration of buildings in zones of relative moderate to high seismic hazard (see figures 1 and 6). In the case of Mexico, the low estimates of the AAL are related to the composition of the schools portfolio which includes typologies of relatively low vulnerability such as reinforced concrete structures (see Figure 5). Figure 9 shows the loss. 14% 12% Current. 10%. Retrofitted. 8% 6% 4% 2%. SLV. PER. CRI. ECU. NIC. BOL. GTM. PAN. CHL. COL. HND. VEN. ARG. 0% MEX. Average Annual Loss (% Exposed value). exceedance curves estimated for each country.. Argentina Bolivia Chile Colombia Costa Rica Ecuador Guatemala Honduras Mexico Nicargua Panama Peru Salvador Venezuela. (ARG) (BOL) (CHL) (COL) (CRI) (ECU) (GTM) (HND) (MEX) (NIC) (PAN) (PER) (SLV) (VEN). Figure 8. Average Annual Loss of the educational sector by country in the current case an in the retrofitted case We obtained the highest values of the AAL (greater than 6% of the exposed value) for Peru, El Salvador, Ecuador, Costa Rica, Nicaragua, and Guatemala. These results reflects the composition of the school portfolio by structural typologies, which consists of relatively high vulnerability unreinforced masonry and adobe buildings, located in areas with relatively high seismic hazard. The estimates of the AAL for these countries are considerably high. Bolivia, Chile, Panamá, and Honduras have an estimate of the AAL around 2% of the exposed value. Those results are also related with the seismic hazard model developed for each country and with the structural typologies considered relevant for each schools portfolio. In the case of Chile, the seismic hazard is relatively high, meanwhile the school portfolio is composed by structural typologies with relatively low vulnerability such as reinforced concrete and reinforced masonry buildings (see Figure 5).. 15.
(17) Table 4. Summary of the results AAL Country. Number of. Build area. Exposed value. students. (m² x 10³). (millions $US). E(L) Current (Millions $US). Retrofitting costs. Benefit Cost Ratio. Retrofitted (‰). (Millions $US). (‰). % Exposed Current. Retrofitted. Millions USD. % GDP. value. BCR. VEN. 5,932,654. 28,131. $ 25,519. $ 73.78. 2.9‰. $ 7.10. 0.3‰. 2,489. 239. 6580. 2%. 26%. 0.34. CHL. 1,929,800. 9,999. $ 7,716. $ 219.08. 28.4‰. $ 29.37. 3.8‰. 7,390. 984. 2820. 2%. 37%. 2.27. MEX. 26,225,836. 122,785. $ 89,116. $ 248.63. 2.8‰. $ 45.77. 0.5‰. 8,389. 1,535. 40096. 4%. 45%. 0.17. ARG. 8,038,308. 42,768. $ 29,793. $ 21.34. 0.7‰. $ 4.24. 0.1‰. 718. 140. 7647. 2%. 26%. 0.08. PAN. 682,940. 2,170. $ 1,483. $ 40.43. 27.3‰. $ 3.55. 2.4‰. 1,364. 120. 670. 3%. 45%. 1.86. CRI. 1,153,291. 3,159. $ 1,952. $ 152.33. 78.1‰. $ 10.15. 5.2‰. 5,143. 343. 952. 3%. 49%. 5.04. COL. 9,170,199. 20,710. $ 11,327. $ 94.99. 8.4‰. $ 15.23. 1.3‰. 3,203. 510. 6036. 2%. 53%. 0.45. PER. 6,483,956. 18,194. $ 8,881. $ 1,170.99. 131.8‰. $ 95.33. 10.7‰. 39,503. 3,212. 2587. 2%. 29%. 14.03. ECU. 2,817,108. 4,146. $ 1,572. $ 166.36. 105.8‰. $ 12.25. 7.8‰. 5,613. 413. 662. 1%. 42%. 7.85. SLV. 1,803,495. 1,535. $ 475. $ 53.82. 113.3‰. $ 4.10. 8.6‰. 1,816. 138. 356. 2%. 75%. 4.71. GTM. 2,760,358. 2,204. $ 640. $ 41.31. 64.5‰. $ 2.24. 3.5‰. 1,394. 75. 286. 1%. 45%. 4.60. BOL. 2,286,652. 4,953. $ 929. $ 28.35. 30.5‰. $ 1.49. 1.6‰. 957. 50. 353. 2%. 38%. 2.57. HND. 2,022,766. 1,993. $ 332. $ 8.65. 26.1‰. $ 0.93. 2.8‰. 292. 31. 237. 2%. 71%. 1.10. NIC. 1,743,900. 1,909. $ 263. $ 20.19. 76.8‰. $ 1.68. 6.4‰. 682. 57. 156. 2%. 59%. 4.01. 16.
(18) 1 Chile. Exceedance rate (annual). 1.E+00 1.E-01 1.E-02 1.E-03 1.E-04 1.E-05 1.E-06. Current Retrofitted 1. Exceedance rate (annual). Costa Rica 1.E+00 1.E-01 1.E-02 1.E-03 1.E-04 1.E-05 1.E-06. 10 100 1000 10000 Loss (millions USD). Current Retrofitted 1. Exceedance rate (annual). El Salvador 1.E+00 1.E-01 1.E-02 1.E-03 1.E-04 1.E-05 1.E-06. 1. Exceedance rate (annual). Honduras 1.E+00 1.E-01 1.E-02 1.E-03 1.E-04 1.E-05 1.E-06. 10 100 1000 Loss (millions USD) Current Retrofitted. 10 100 1000 Loss (millions USD). Current Retrofitted 1. Exceedance rate (annual). Nicaragua 1.E+00 1.E-01 1.E-02 1.E-03 1.E-04 1.E-05 1.E-06. 10 100 1000 Loss (millions USD). Current Retrofitted 1. Peru. 10 100 1000 10000 Loss (millions USD). 10 100 1000 10000 Loss (millions USD). Exceedance rate (annual). 1. Exceedance rate (annual). 1.E+00 1.E-01 1.E-02 1.E-03 1.E-04 1.E-05 1.E-06 1. Colombia. 1.E+00 1.E-01 1.E-02 1.E-03 1.E-04 1.E-05 1.E-06 1. 10 100 1000 10000 Loss (millions USD). Current Retrofitted 1. 10 100 1000 Loss (millions USD). Current Retrofitted 10. 100. 1000 10000 100000. Loss (millions USD). Mexico 1.E+00 1.E-01 1.E-02 1.E-03 1.E-04 1.E-05 1.E-06. Current Retrofitted 1. Panama 1.E+00 1.E-01 1.E-02 1.E-03 1.E-04 1.E-05 1.E-06. 10 100 1000 10000 Loss (millions USD). Current Retrofitted 1. Venezuela. 10 100 1000 10000 Loss (millions USD). Current Retrofitted. Ecuador 1.E+00 1.E-01 1.E-02 1.E-03 1.E-04 1.E-05 1.E-06 Guatemala 1.E+00 1.E-01 1.E-02 1.E-03 1.E-04 1.E-05 1.E-06. 10 100 1000 Loss (millions USD). Current Retrofitted. Exceedance rate (annual). Current Retrofitted. Bolivia. Exceedance rate (annual). Exceedance rate (annual). 1.E+00 1.E-01 1.E-02 1.E-03 1.E-04 1.E-05 1.E-06. 10 100 1000 10000 Loss (millions USD). Exceedance rate (annual). 1. Argentina. Current Retrofitted. Exceedance rate (annual). Current Retrofitted. 1.E+00 1.E-01 1.E-02 1.E-03 1.E-04 1.E-05 1.E-06. Exceedance rate (annual). Exceedance rate (annual). 1.E+00 1.E-01 1.E-02 1.E-03 1.E-04 1.E-05 1.E-06. 10 100 1000 10000 Loss (millions USD). Figure 9. Loss exceedance curves estimated for each country 17.
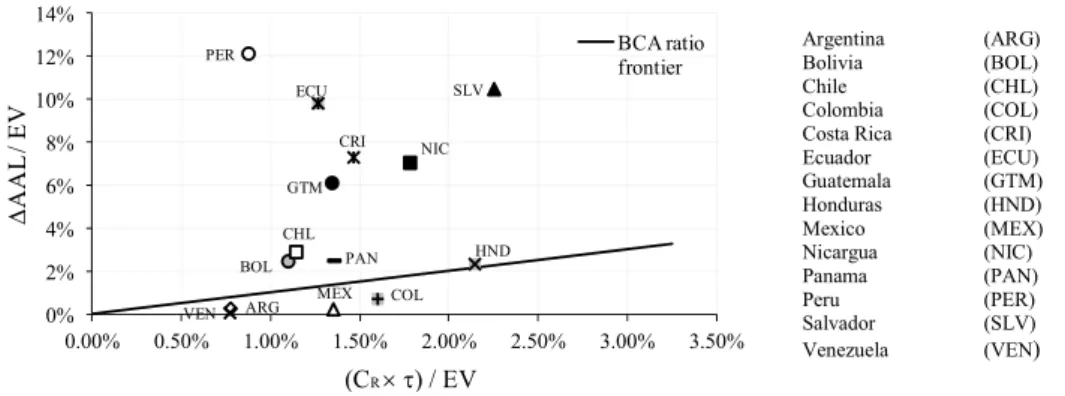
(19) The results shown in Figure 9 are useful in order to define acceptable levels of losses as well as risk transfer mechanisms. Also, these results are used in order to identify the benefits of risk mitigation alternatives. Based on these curves, it is possible to estimate the AAL for both the current and the retrofitted portfolios. Then, the benefits of the risk reduction alternatives can be estimated as the difference of the present value of the AAL between both portfolios. The wider expected reductions in losses are observed in Bolivia, Costa Rica, Ecuador, El Salvador, Guatemala, Honduras and Peru. These differences can also be observed in Figure 8. Once estimated the benefits of risk reduction activities, it is possible to establish from equations 1 and 9 the feasibility of the seismic retrofitting of the schools from a financial perspective. The benefit cost ratio given by Equation 1 is greater than 1 when the difference between the AAL in the current case and the retrofitted case, ΔAAL, is greater than the retrofitting costs multiplied by the discount rate. If those terms are normalized by the Exposed Value. EV, the threshold of the feasibility of the seismic upgrading can be described by:. AAL EV. . CR. (11). EV. The results of the BCR analysis are shown in Figure 10. In the abscissa is shown the retrofitting costs CR, multiplied by the discount rate and normalized by the exposed value EV for each country. In the ordinate is shown the difference between the AAL for the current and retrofitted portfolio of schools ΔAAL, also normalized by the exposed value. 14%. AAL / EV. 12%. BCA ratio frontier. PER. 8%. CRI. 6%. NIC. GTM. 4%. CHL BOL. 2% 0% 0.00%. SLV. ECU. 10%. VEN. 0.50%. ARG. 1.00%. HND. PAN MEX. 1.50%. COL. 2.00%. 2.50%. 3.00%. 3.50%. Argentina Bolivia Chile Colombia Costa Rica Ecuador Guatemala Honduras Mexico Nicargua Panama Peru Salvador Venezuela. (ARG) (BOL) (CHL) (COL) (CRI) (ECU) (GTM) (HND) (MEX) (NIC) (PAN) (PER) (SLV) (VEN). (CR ) / EV ΔAAL: Difference between the AAL in the current and retrofitted case. EV: exposed value. CR: Retrofitting costs. : Discount rate. Figure 10. Benefit cost results It is possible to observe in Figure 10 that the difference between the AAL of the current portfolio and the AAL of the retrofitted portfolio is not significant when compared with the retrofitting costs in the case of Venezuela, Argentina, Colombia and México; those countries are below the threshold of the BCR ratio. Therefore, in these countries, the seismic upgrading of the public school portfolio is not attractive from a financial perspective. For the remaining countries, it is feasible to develop a seismic upgrading of the schools portfolio from a financial perspective, given the expected reduction of the AAL and the estimated costs of the structural intervention. 18.
(20) The estimates of the BCR are obtained from the loss estimates derived from the model developed for the generation of the stochastic events, the vulnerability curves used, the retrofitting costs considered as well as the discount rate adopted. Regarding the loss assessment, in this proposed methodology is considered that the AAL is a loss that occurs indefinitely, in perpetuity. Therefore, the present value of the AAL and of the BCR, are not sensitive to any time horizon. Nevertheless, by generating stochastic loss events according to the LEC, it is possible to estimate the present value of losses for a given time horizon by following Eq (10). Also, it must be remarked that the estimation of the LEC includes the (random) uncertainties of both the ground motions at the building site and the expected value of losses. By following the proposed procedure, it is possible to estimate, for any seismic event, the probability of exceedance of a certain value of loss, and, by using Eq (8), the loss exceedance rate could be obtained taking into account all the seismic events. Then, regarding the random uncertainty, no confidence intervals are required. On the other hand, this article does not include considerations on the epistemic uncertainty neither for both the hazard nor for the used vulnerability models, that allows defining confidence intervals for the loss estimates. Those calculations are out of the scope of this study. Regarding the sensitivity of the BCR to the discount rate, it is possible to identify from Equation 1 and 9 that BCR/is equal to (-1/AAL/CR). In this case, it has been observed that variations of lower than 0.5% are not relevant in order to identify countries where the structural interventions are feasible, by considering as a criterion a BCR0.9. Therefore, the result of the analysis is sensitive to the discount rate. For example, if a discount rate of 12% is considered, the BCR is 4 times lower than in the case of a discount rate of 3% (see Figure 11a). Figure 11b shows. Peru Ecuador Costa Rica El Salvador Guatemala Nicaragua Bolivia Chile Panama Honduras Colombia Venezuela Mexico Argentina. 0.27. 0.93. 12% 3.5% 3% 2.5%. 1.09 1.30. Benefit-Cost ratio BCR. the BCR estimated for Honduras, by considering different values of . 2.0 1.8 1.6 1.4 1.2 1.0 0.8 0.6 0.4 0.2 0.0. (2.5%, 1.3) (3.0%, 1.08) (3.5%, 0.93). (12%, 0.27). 0% 3% 5% 8% 10% 13% 15% Discount rate . Honduras 0. 1. 2 BCR. (a). 3. 4. (b). Figure 11. (a) BCR estimated for discount rates of 2.5%, 3%, 3.5% and 12%. (b) BCR for Guatemala for several values of For the analysis of the results, countries were classified in groups defined by ranges of the AAL in the current portfolio and of the EDI (UNESCO 2010). In a similar procedure, countries were 19.
(21) classified based on the results of the AAL and the public investment in education as a percentage of the GDP. When comparing the estimates of the AAL and of EDI, the seismic risk assessment of schools acquires different meanings. It is possible to identify the following cases: I) countries with large AAL and notable advances in education; II) countries with notable advances in education and low estimates of the AAL; III) countries with low progress in education and low estimates of the AAL and IV) countries with low progress in education and high estimates of the AAL. Figure 12 classifies the countries according to the AAL and the EDI considering these four cases. The ability to finance risk reduction activities, as well as plans to recover from disasters, is also examined herein for the studied countries. At national level, the investment in education as a percentage of the GDP is considered as a reference of the resourcefulness of the educational sector, under the assumption that part of the recovery funds will be obtained from budgetary. Annual Average Loss (current portfolio ) % GDP. reallocation. 1.0% PER. 0.8%. Case I. Case IV. 0.6%. CRI. 0.4%. NIC. ECU SLV. 0.2%. BOL. GTM. 0.0% 0.78. Case III. 0.82. HND. 0.86. CHL. PAN. COL. VEN. 0.90. 0.94. MEX ARG. Case II. 0.98. Argentina Bolivia Chile Colombia Costa Rica Ecuador Guatemala Honduras Mexico Nicargua Panama Peru Salvador Venezuela. (ARG) (BOL) (CHL) (COL) (CRI) (ECU) (GTM) (HND) (MEX) (NIC) (PAN) (PER) (SLV) (VEN). Education for All Indicator (EDI). Figure 12. Average Annual Loss (AAL) and Education for All Development Index (EDI) By comparing the estimates of the AAL with the investment in education as a percentage of the GDP, it is possible to identify four different cases: I) countries with large AAL estimates and high investments in education; II) Countries with high investments in education and low estimates of the AAL; III) Countries with low investments in education and low estimates of the AAL; and IV) countries with low investments in education and high estimates of the AAL. Figure 13 shows all. Annual Average Loss (current portfolio) % GDP. these cases for the studied countries. Table 5 gives a summary of both classifications.. 1.0% PER. 0.8% Case I. Case IV. 0.6%. CRI. 0.4%. NIC. ECU SLV. 0.2% HND. 0.0% 0.0%. Case III. CHL. GTM VEN. 1.0%. 2.0%. 3.0%. PAN COL ARG. 4.0%. BOL. Case II. MEX. 5.0%. 6.0%. Argentina Bolivia Chile Colombia Costa Rica Ecuador Guatemala Honduras Mexico Nicargua Panama Peru Salvador Venezuela. (ARG) (BOL) (CHL) (COL) (CRI) (ECU) (GTM) (HND) (MEX) (NIC) (PAN) (PER) (SLV) (VEN). Investment in education (% GDP). Figure 13. Average Annual Loss (AAL) and investment in education (% GDP). 20.
(22) Regarding the capacity to develop risk reduction programs, Table 4 gives the retrofitting costs in terms of the GDP. These values range from 1 to 4%, and are closer to the total annual investment in education. When comparing these costs with the educational expenditure on capital on public institutions (see Figure 14a), it has been found that the estimated retrofitting costs are several times larger than the resources available for construction, repair, renovation or replacement of buildings and infrastructure of the educational sector (see Figure 14b). Therefore, seismic upgrading programs may represent significant efforts, which may require the definition of financing strategies, such as credits from international organisms.. Ecuador Mexico Colombia Venezuela Argentina Panama Nicaragua El Salvador Chile Guatemala Bolivia. Ecuador Mexico Colombia Venezuela Argentina Panama Nicaragua El Salvador Chile Guatemala Bolivia. 28.7 26.5 25.2 24.7 23.9 10.1. 0. 0.0% 0.2% 0.4% 0.6% 0.8% Educational expenditure on capital on public institutions (% GDP). (a). 2 4 6 8 10 Retrofitting costs / educational expenditure on capital on public institutions. (b). Figure 14. (a) Educational expenditure on capital of public institutions (%GDP); (b) Retrofitting costs / education expenditure on capital of public institutions Note: No data available for Peru, Costa Rica and Honduras. From the classification given in Table 5, it can be concluded that the countries included in cases I and IV should consider as a priority task in their development plans the investment in education and in the seismic risk reduction. Given the scope of the performed study, the details of the information and the limitations of the model, the feasibility of the seismic upgrading of schools in cities and at subnational units, such as the Case of Bogotá, or Quito, cannot be discussed using the results of this analysis.. Table 5. Country classification according to the AAL, the EDI index and the investment in education (%GDP) Case I II. AAL vs EDI Perú, Costa Rica, Ecuador México, Argentina, Chile, Panamá, Venezuela, Colombia and Bolivia. AAL vs Investment in education (%GDP) Costa Rica Bolivia, Panamá, México, Argentina, Colombia. III. Honduras and Guatemala. Chile, Venezuela, Guatemala and Honduras. IV. Nicaragua, El Salvador. Peru, El Salvador, Nicaragua and Ecuador 21.
(23) This analysis is focused on the estimation of economic losses. Nevertheless, a complete and comprehensive benefit cost analysis should include other variables such as, for instance, those related to the possible casualties to the students. Nevertheless, those consequences/losses are incommensurable with the economic losses (Hansson 2007). Therefore, the decision-making process related to risk reduction programs should be developed by taking into account also social and political aspects (Aven y Kriestensen 2005). In this regard, the use of risk indicators, following a holistic approach, is suggested (Barbat et al. 2010; Barbat et al. 2011 and Carreño et al. 2012).. CONCLUSIONS This study proposes a methodology for an estimate of the feasibility of the seismic risk reduction of a buildings portfolio at a broad scale level. The methodology consists in the following: i) the estimation of the built area and the economical value of the buildings portfolio, aggregated at a given administrative unit, and its classification into structural typologies according to the most common construction techniques of the studied territory. ii) The development of vulnerability curves for each structural typology, considering the current case, as well as for the case of a hypothetical structural intervention. Those curves provide, for a given ground motion intensity, the expected value of loss and its standard deviation. iii) The generation of a set of random seismic events according to the seismicity of the studied territory. iv) The estimation of the average annual loss in the current case and in the case of strengthening of the buildings portfolio. v) The estimation of a benefit cost ratio by comparing the expected reduction in the average annual loss with the retrofitting costs. This methodology has been applied to evaluate the feasibility of the seismic risk reduction of the built area of public schools in countries of Latin America and the Caribbean. Among the countries considered in the study, it is observed that for Venezuela, Argentina, Colombia and México, the reduction of the average annual loss is not significant when compared with the retrofitting costs. Therefore, the seismic upgrading of the public school portfolio is not attractive from a financial perspective. In those countries, loss estimates are lower due to the composition of the schools portfolio by structural typologies of relative low vulnerability such as reinforced concrete moment frames. Also, it is relevant the geographical distribution of the built area with regard to its exposition to the seismic hazard. If buildings are located in regions with moderate to low seismicity, their expected losses would be lower and those results would reduce the feasibility of the structural intervention at the national level. In the remaining countries, the benefit cost ratio is greater than 1 and, therefore, it is feasible to develop a seismic upgrading policy of the schools portfolio. In order to assign priorities among countries regarding the seismic risk of the schools, the results of the average annual loss have been compared with indicators describing the performance of the educational sector, as well as indicators of the public investments in education. The rationale of this analysis is to identify countries that may have limited resources for financing risk mitigation 22.
(24) projects and disaster recovery activities. This analysis is also considered as a first criterion allowing identifying countries in which the potential losses of the school buildings are high when compared with the investments in education and may affect the achievements of the educational goals. It must be remarked that the obtained results represent a gross estimate of the seismic risk at country level. The model used for this analysis is based on the general information regarding the number of students, the average prices of built area, the retrofitting costs, the building typologies and the vulnerability curves. Therefore, although these results are useful, they should be considered only as indicative for the prioritization and definition of more specific plans and programs for seismic risk reduction. These results are considered as inputs for policy making of international organizations interested in establishing priorities among different countries in regional context, with regard to allocating funds for programs concerning retrofitting of structures and/or infrastructures.. AKNOWLEDGMENT This work has been partially funded by the Spanish Government and with FEDER funds, through the research projects CoPASRE (CGL2011-29063), CGL2008-00869/BTE, CGL2011-23621, and by the European Commission with FEDER funds, through de research projects SEDUREC CONSOLIDER- CSD2006-00060, INTERREG: POCTEFA 2007-2013/ 73/08, MOVE- FT7ENV-2007-1-211590 and DESURBS-FP7-2011-261652.. REFERENCES ATC-13 (1985). Earthquake damage evaluation data for California. Applied Technology Council, Redwood City, California. USA Aven, T., Kristinsen, V. (2005) Perspectives on risk: review and discussion of the basis for establishing a unified and holistic approach. Reliab Eng Syst Saf 90: 1-14 Barbat, A.H., Pujades, L.G., Lantada, N., Moreno, R. (2006) Performance of buildings under earthquakes in Barcelona, Spain. Computer-Aided Civil and Infrastructure Engineering, 21, 573593 Barbat, A.H; Lagomarsino, S.; Pujades, L.G.(2007) Vulnerability assessment of dwelling buildings. Assessing and Managing Earthquake Risk, 261 - 286.Springer. Netherlands. Barbat, A.H., Pujades, L.G., Lantada, N., Moreno, R. (2008) Seismic damage evaluation in urban areas using the capacity spectrum method: application to Barcelona, Soil Dyn Earthq Eng 28: 851865 Barbat, A.H., Carreño, M.L., Pujades, L.G, Lantada, N., Cardona, O.D., Marulanda, M.C. (2010) Seismic vulnerability and risk evaluation methods for urban areas. A review with application to a pilot area. Struct Infrastruct Eng 6(12): 17-38 23.
(25) Barbat, A.H., Carreño, M.L., Cardona, O.D., Marulanda, M.C. (2011) Evaluación holística del riesgo sísmico en zonas urbanas, Revista internacional de métodos numéricos para cálculo y diseño en ingeniería, 27(1), 3-27. Benito, M.B., Lindholm, C., Camacho, E., Climent, A., Marroquin, G., Molina, E., Rojas, W.,Segura, J., Talavera, E. (2008) A new evaluation of Seismic Hazard for the Central America Region in the frame of the RESIS II Project In: 14th World Conference on Earthquake Engineering, October 12-17, 2008, Beijing, China. Bommer, J., Spence, R., Erdik, M., Tabuchi, S., Aydinoglu, N., Booth, E., 5, Del Re, D., Peterken, O (2002) Development of an earthquake loss model for Turkish catastrophe insurance. J Seismol 6: 431–446 Cardona, O.D., Ordaz, M.G., Reinoso, E., Yamin, L.E., Barbat, A.H. (2010) Comprehensive Approach for Probabilistic Risk Assessment (CAPRA): International Initiative for Disaster Risk Management Effectiveness. 14th European Conference on Earthquake Engineering (14ECEE). 30 Ago- 3 Sept, 2010, Ohrid, Macedonia Carreño, M. L., Cardona, O.D., Barbat, A.H. (2007 a) Urban seismic risk evaluation: A holistic approach. Nat Hazards 40: 137-172. Carreño M.L, Cardona, O.D., Barbat, A.H (2007 b) Disaster risk management performance index, Nat Hazards 41: 1-20. Carreño, M.L Cardona, O.D, Barbat, A.H (2010) Computational tool for post-earthquake evaluation of damage in buildings, Earthq Spect 26(1): 63–86 Carreño, M.L., Cardona, O.D., Barbat, A.H. (2012). Holistic evaluation of the seismic urban risk using the fuzzy sets theory. Bull Earthq Eng, 10(2), 547-565 CIRCULAR S-10.4.1.1 Mediante la cual se dan a conocer a las instituciones de seguros las bases técnicas que se deberán utilizar para el cálculo de la Pérdida Máxima Probable de los seguros de huracán y/u otros riesgos hidrometeorológicos. Secretaría de Hacienda y Crédito Público.Comisión Nacional de Seguros y Fianzas Climent, A., Rojas, W., Alvarado, G.E., Benito, B. (2008) Proyecto Resis II. Evaluación de la amenaza sísmica en Costa Rica. Universidad Politécnica de Madrid. Norsar. CEPREDENAC. http://www.rsn.geologia.ucr.ac.cr/Biblioteca/Amenaza_CR_08.pdf. Accessed 6 June 2012 Coca, C. (2006). Risk management and sustainability in educative sector experience of Bogota, Colombia. http://www.preventionweb.net/english/professional/trainings-events/edumaterials/v.php?id=7673. Accessed 4 May 2013 Comité AIS-300, 1996. Estudio general de amenaza sísmica de Colombia. Asociación Colombiana de Ingeniería Sísmica. Bogotá, Colombia ECLAC (2003) Handbook for Estimating the Socio-economic and Environmental Effects of Disasters. Economic Commission for Latin America and the Caribbean http://www.preventionweb.net/english/professional/publications/v.php?id=1099 Accessed 4 May 2013 EERI-IAEE (2012) World Housing Encyclopedia. Earthquake Engineering Research Institute. International Association of Earthquake Engineering. http://www.world-housing.net/. Accessed 4 May 2013. 24.
(26) ERN-AL (2009) Evaluación de riesgo específico de Bolivia, Guatemala, Jamaica y Perú. Banco Interamericano de Desarrollo Washington, D. C. Contrato BID C0009-08. ERN-AL (2010) Seismic risk assessment of schools in the Andean Region in South America and Central America. International Labor Office -ILO/ CRISIS. External collaboration contract 40062342/0. Route des Morillons 4 CH 1211 Geneva 22. Suiza. http://www.preventionweb.net/english/hyogo/gar/2011/en/bgdocs/ERN-AL_2010.pdf. Accessed 4 May 2013. Escobar, J.J.,. Molina, E., Marroquín, G., Talavera, E., Rojas, W., Climent, A., Camacho-. Astigarrabia, E., Benito, B., Lindholm, C. (2008) Proyecto Resis II. Evaluación de la amenaza sísmica en Honduras. http://www.norsar.no/images/Marketing/Projects/RESIS/Amenaza_Honduras_ES.pdf. Accessed 6 June 2012 Estevez, R., Schubert, C. (1993). Sismotectónica y prevención sísmica en los Andes venezolanos, Memorias del VIII Seminario Latinoamericano de Ingeniería Sismoresistente. Volúmen 1. Mérida. Venezuela 5-8 julio 1993. pp 55-65 Faleiro, J., Oller, S., Barbat, A.H (2008) Plastic-damage seismic model for reinforced concrete frames, Computers and Structures, 86(7-8), 581-597 FEMA (1992) A benefit/cost model for the seismic rehabilitation of buildings (FEMA 227), Vols 1, 2. VSP Associates, Sacramento, California. FEMA (1994 a). Seismic Rehabilitation of Federal Buildings: A Benefit/Cost Model. Volume 2 Supporting Documentation. (FEMA-256 I) Sept 1994 Prepared for the Federal Emergency Management Agency Under Contract No. EMW-92-6-3976 by VSP Associates, Inc. 455 University Avenue, Suite 340 Sacramento, CA 95825 June 30, 1994 FEMA (1994 b) Typical costs for seismic rehabilitation of existing buildings (FEMA 156). Second edition. Earthquake hazards reduction series 39. Issued by FEMA in furtherance of the Decade for Natural Disaster Reduction. Earthquake hazards reduction series 39. Issued by FEMA in furtherance of the Decade for Natural Disaster Reduction. http://www.fema.gov/library/viewRecord.do?id=1630. Accessed 4 May 2013. FEMA. 1994 c. Typical Costs for Seismic Rehabilitation of Existing Buildings. Second edition. Volume 2 -Supporting Documentation. (FEMA 157) http://www.fema.gov/library/viewRecord.do?id=1631. Accessed 4 May 2013. FEMA/NIBS, 2003 Multi-hazard Loss Estimation Methodology. Earthquake Model HAZUS®MH MR4 Technical Manual. Department of Homeland Security, Emergency Preparedness and Response Directorate, Mitigation Division and National Institute of Building Sciences Washington, D.C. http://www.fema.gov/library/viewRecord.do?id=3732. Accessed 4 May 2013. Ferreira M.A.; Proença J.M.; Oliveira C.S. (2008) Vulnerability Assessment in Educational Buildings–Inference of Earthquake Risk. A Methodology Based on School Damage in the July 9, 1998, Faial Earthquake in the Azores, The 14th World Conference on Earthquake Engineering, October 12-17, 2008, Beijing, China. Paper 09-01-0014. 25.
(27) Ferreira M. A.; Proença J.M. (2008) Seismic Vulnerability Assessment of the Educational System of Bucharest, The 14th World Conference on Earthquake Engineering, October 12-17, 2008, Beijing, China. Paper ID 09-01-0110 Gallego, M. (1999) Estimación del riesgo sísmico en la república de Colombia, Tesis de Maestría, División de Estudios de Posgrado, UNAM. GAR(2011) Global Assessment Report on Disaster Risk Reduction 2011. Revealing Risk, Redefining Development, Chapter 5, Investing today for a safer tomorrow. http://www.preventionweb.net/english/hyogo/gar/2011/en/bgdocs/GAR2011/GAR2011_Report_Chapter5.pdf. Accessed 5 May 2013. GeoHazards International, Escuela Politécnica Nacional, 1995 Invirtiendo en el futuro de Quito. Proyecto de Seguridad Sísmica de las edificaciones escolares de Quito, Ecuador. http://www.geohaz.org/news/images/publications/QuitoSchoolProjectSpanish.pdf. Accessed 4 May 2013. GFRRD, 2009. Guidance Notes on Safer School. Construction Global Facility for Disaster Reduction and Recovery. http://www.gfdrr.org/docs/Guidance_Notes_Safe_Schools.pdf. Accessed 4 May 2013. Graf, W.P., Lee, Y. (2009). Code-Oriented Damage Assessment for Buildings. Earthq Spect 25(1): 17–37. Grant, D.N., Bommer, J.J., Pinho, R., Calvi, G.M., Goretti, A. and Meroni, F., (2007) A prioritization scheme for seismic intervention in school buildings in Italy. Earthq Spect 23(2): 291314. Grossi, P., kunreuther, H. (2005) Catastrophe modeling: a new approach to managing risk. Kluwer Academic Publishers, Norwell, MA. Hadjian, A. (2002) A general framework for risk-consistent seismic design. Earth Eng Struct Dyn 31: 601-626. Hansson, S.O (2007) Philosophical problems in cost–benefit analysis. Econ Philos 23: 163–183 IGC (2010). “Formularis per a l’ avaluació de la vulnerabilitat sísmica de edificis essencials”. Informe IGC GS-11/2010 Jaiswal, K., Wald, D., Porter, K. (2010) A Global Building Inventory for Earthquake Loss Estimation and Risk Management. Earthq Spect 26 (3): 731–748. Kappos, A.J., Dimitrakopoulos, E.G. (2008) Feasibility of pre-earthquake strengthening of buildings based on cost-benefit and life-cycle cost analysis, with the aid of fragility curves. Nat Hazards 45(1): 33-54 Lantada, N., Pujades, L.G., Barbat, A.H. (2009) Vulnerability index and capacity spectrum based methods for urban seismic risk evaluation. A comparison. Nat Hazads 51: 501-524 Lantada , N., Irrizari, J., Barbat, A.H., Goula, X., Roca, A., Pujades, L.G (2010) Seismic hazard and risk scenarios for Barcelona, Spain, using the vulnerability index method, Bull Earthq Eng 8: 201-229. Lantada, N., Irrizari, J., Goula, X., Roca, A., Pujades, L.G, Barbat, A.H (2011) Ground-shaking scenarios and urban risk evaluation of Barcelona using the risk-UE capacity spectrum based method, Bull Earthq Eng 9: 441–466. 26.
(28) Li J., Pollard S., Kendall G., Soane E. and Davies G. (2009) Optimizing risk reduction: an Expected Utility Approach for marginal risk reduction during regulatory decision making, Reliability Engineering and System Safety, 94 (11): 1729-1734 López, O.A., Hernandez, J.J., Del Re, G., Puig, J., Espinosa, L. (2007). Reducing seismic risk of schools in Venezuela. Earthq Spect 23(4): 771-790. Mata, P., Oller, S., Barbat, A.H (2008) Dynamic analysis of beam structures considering geometric and constitutive nonlinearity. Comput Methods Appl Mech Eng 197: 857-878. Miranda, E. (1999) Approximate seismic lateral deformation demands on multistory buildings. J Struct Eng 125(4): 417-425 Molina, E., Marroquín, G., Escobar, J.J., Talavera, E., Rojas, W., Climent, A., CamachoAstigarrabia, E., Benito, B., Lindhom, C. (2008) Proyecto Resis II Evaluación de la Amenaza Sísmica en Centroamérica. http://www.rsn.geologia.ucr.ac.cr/Biblioteca/evaluacion_amenazasismica_centroamerica.pdf. Accessed 10 July 2011. Mora, M.G., Ordaz, M., Yamin, L.E., Cardona, O.D. (2011) Relaciones beneficio costo probabilistas de rehabilitación sísmica, Cuarto Congreso Nacional de Ingeniería Sísmica, Granada, Spain, 18-20 de mayo de 2011. Paper ID 60. Ordaz, M; Miranda, E; Reinoso, E and Pérez-Rocha, L.E. (1998 a) Seismic Loss Estimation Model for México City. Universidad Nacional Autónoma de México, México DF. Ordaz, M; Miranda, E; Reinoso, E and Pérez-Rocha, L.E. (1998 b) Seismic Loss Estimation Model for México City. 12 World Conference on Earthquake Engineering. Auckland, New Zealand, 30 January - Friday 4 February 2000 Paper No 1902. Ordaz, M. (2000) Metodología para la Evaluación del Riesgo Sísmico Enfocada a la Gerencia de Seguros por Terremoto. Universidad Nacional Autónoma de México, México DF. Ordaz, M., Aguilar, A., Arboleda, J. (2007) CRISIS2007. Program for computing seismic hazard. (Version 7.2). Instituto de Ingeniería. Universidad Nacional Autónoma de México. Proyectos y Diseños –P&D (2000) Evaluación preliminar de vulnerabilidad sísmica centros educativos distritales. Secretaria De Educación Distrito Capital De Santafé De Bogotá. Bogotá, Colombia. Ruiz-García, J. Terán-Gilmore, A., Zuñiga-Cuevas, O. (2010) Simplified drift-based fragility assessment of confined masonry buildings. Proceedings of the 9th U.S. National and 10th Canadian Conference on Earthquake Engineering. Compte Rendu de la 9ième Conférence Nationale Américaine et 10ième Conférence Canadienne de Génie Parasismique. July 25-29, 2010, Toronto, Ontario, Canada. Paper No 1240. Secretaría de Educación del Distrito Capital (SED), 2004. REFORZAMIENTO ESTRUCTURAL SED.xls. [Excel workbook]. Smyth, A.W., Altay, G., Deodatis, G., Erdick, M., Franco, G., Gülkan, P., Kunreuther, H., Luş, H.,. Mete, E., Seeber, N., Yüzügüllü, Ö. (2004a). Probabilistic Benefit-Cost Analysis for. Earthquake Damage Mitigation: Evaluating Measures for Apartment Houses in Turkey. Earthq Spect 20: 171-203.. 27.
(29) Smyth, A.W., Deodatis, G., Franco, G., He, Y., Gurvich, T. (2004b). Evaluating earthquake retrofitting measures for schools: a cost-benefit analysis. School Safety and Security. Keeping Schools Safe in Earthquakes. Proceedings of the ad hoc Experts’ Group Meeting on Earthquake Safety in Schools, Paris, 9 to 11 February 2004. http://www.oecd.org/document/61/0,3746,en_2649_39263294_34748797_1_1_1_1,00.html Accessed 4 May 2013. Tarque, N., Crowley, H., Pinho, R., Varum. (2010) Seismic risk assessment of adobe dwellings in Cusco, Peru, based on mechanical procedures. 14 European Conference on Earthquake Engineering (14ECEE). Ohrid. Macedonia. 30-08; 03-09 2010. Trendafiloski, G., Wyss, M., Rosset, P., Marmureanub, G. (2009) Constructing City Models to Estimate Losses Due to Earthquakes Worldwide: Application to Bucharest, Romania. Earthq Spect 25 (3): 665–685 UNESCO (2010) Reaching the marginalized. EFA Global Monitoring Report. Education For All 2010. Oxford University Press. United Nations Educational, Scientific and Cultural Organization 7, Place de Fontenoy, 75352 Paris 07 SP, France Vargas, Y.F., Pujades, L.G., Barbat, A.H., Hurtado, J.E. (2010) Probabilistic assessment of the global damage in reinforced concrete structures. 14th European Conference on Earthquake Engineering. Ohrid: 30th August – 3rd September, 2010. Vargas YF, Pujades LG, Barbat AH, Hurtado JE. (2011) Pushover analysis and incremental dynamic analysis. A probabilistic comparison. Proceeding 3rd International Conference on Computational Methods in Structural Dynamics and Earthquake Engineering, Corfu, Greece; 2011. Vielma, J.C., Barbat, A.H., Oller, S. (2010) Seismic safety of limited ductility buildings. Bull Earthq Eng 8(1): 135-155 Yakut, A., Tonguç, A., Gülkan P. (2008) A comparative seismic performance assessment and rehabilitation of existing school buildings. The 14th World Conference on Earthquake Engineering, October 12-17, 2008, Beijing, China. Yamín, L.E., Phillips, C.A., Reyes, J.C., Ruiz, D.M. (2004) Seismic behavior and rehabilitation alternatives for adobe and rammed earth buildings. 13th World Conference on Earthquake Engineering. Vancouver, B.C, Canada. August 1-6, 2004. Paper No 2942.. 28.
(30)
Figure


+7


Documento similar
Our results here also indicate that the orders of integration are higher than 1 but smaller than 2 and thus, the standard approach of taking first differences does not lead to
ABSTRACT Transformation of the Specialized Knowledge of Future Primary Teachers on Fraction Division
From the phenomenology associated with contexts (C.1), for the statement of task T 1.1 , the future teachers use their knowledge of situations of the personal
In the preparation of this report, the Venice Commission has relied on the comments of its rapporteurs; its recently adopted Report on Respect for Democracy, Human Rights and the Rule
No obstante, como esta enfermedad afecta a cada persona de manera diferente, no todas las opciones de cuidado y tratamiento pueden ser apropiadas para cada individuo.. La forma
The Dwellers in the Garden of Allah 109... The Dwellers in the Garden of Allah
that when looking at the formal and informal linguistic environments in language acquisition and learning it is necessary to consider the role of the type of
In the previous sections we have shown how astronomical alignments and solar hierophanies – with a common interest in the solstices − were substantiated in the
Díaz Soto has raised the point about banning religious garb in the ―public space.‖ He states, ―for example, in most Spanish public Universities, there is a Catholic chapel
