1 Transportation Research Record: Journal of the Transportation Research Board, No. 2382, Transportation Research Board of the National Academies, Washington, D.C., 2013, pp. 1–9.
DOI: 10.3141/2382-01
B. Muñoz, Transport Research Center, and A. Monzon, Department of Civil Engi-neering, Universidad Politécnica de Madrid, c/ Profesor Aranguren s/n, Ciudad Universitaria, 28040 Madrid, Spain. D. Lois, Department of Social Psychology, Universidad Nacional de Educación a Distancia, c/ Juan del Rosal 10, 28040 Madrid, Spain. Corresponding author: B. Muñoz, [email protected].
for daily mobility. Traditional discrete choice models are mainly based on variables such as time and cost. These variables do not suffi-ciently explain the choice of the bicycle as a mode of transportation. Some researchers have noted a significant influence of psychologi-cal factors—such as attitudes, social norms, perceived behavioral control and habits—in the decision to commute by bicycle. Bicycle commuters show more positive attitudes toward bicycle use (2–5), more perceived social norms or psychological support for using the bicycle (2, 3, 6), more positive perceived behavioral control toward bicycle use (2), and less perception of barriers (4, 6). However, hab-its reduce the influence of these constructs in the decision to use the bicycle (7). Habits of using other modes have a negative impact on bicycle use (8), while the habit of using the bicycle for noncommuting mobility increases the frequency of bicycle use for commuting trips (7, 9). In view of the limited research on the relationship between atti-tudes, other psychological constructs, and cycling (10), this research project aims to continue analyzing the relationship between psycho-logical factors and bicycle commuting by following the research work of Heinen et al. (5).
The paper is organized as follows. The theoretical framework is presented in the next section. That is followed by descriptions of the case study, data collection, and variables. Next come the results, which determine the differences between various types of users in their perceptions of cycling factors. On the basis of those factors, the main structures underlying attitudinal and other psychological variables are identified and defined. The analysis continues with an examination of the psychological factors influencing bicycle commuting through a binary logit model. The final section contains some policy recommendations and conclusions.
FRAMEWORK
The framework of this paper is the theory of planned behavior (TPB) (11), which is the best-known and most widely supported attitudinal psychological theory in most studies relating to behavioral decisions. This theory has been used in various studies on cycling (2, 5, 12) and in the field of active travel behavior (7, 13). TPB states that attitudes toward a behavior, subjective norms, and perceived behavioral con-trol combine to shape an individual’s behavioral intention and final behavior, which in the case of the current research is commuting by bicycle. These components are described by Ajzen as follows: the attitude toward a behavior is “the degree to which performance of the behavior is positively or negatively valued”; the subjective norm is “the perceived social pressure to engage or not to engage in a behav-ior”; and the perceived behavioral control (PBC) refers to “people’s
Cycling Habits and Other Psychological
Variables Affecting Commuting by Bicycle
in Madrid, Spain
Begoña Muñoz, Andres Monzon, and David Lois
To develop effective cycling policies, decision makers and administrators should know the factors influencing the use of the bicycle for daily mobil-ity. Traditional discrete choice models tend to be based on variables such as time and cost, which do not sufficiently explain the choice of the bicycle as a mode of transportation. Because psychological factors have been identified as particularly influential in the decision to commute by bicycle, this paper examines the perceptions of cycling factors and their influence on commuting by bicycle. Perceptions are measured by atti-tudes, other psychological variables, and habits. Statistical differences in the variables are established in relation to the choice of commuting mode and bicycle experience (commuter, sport–leisure, no use). Doing so enables the authors to identify the main barriers to commuting by bicycle and to make recommendations for cycling policies. Two underly-ing structures (factors) of the attitudinal variables are identified: direct benefits and long-term benefits. Three other factors are related to vari-ables of difficulty: physical conditions, external facilities, and individual capacities. The effect of attitudes and other psychological variables on people’s decision to cycle to work–place of study is tested by using a logit model. In the case study of Madrid, Spain, the decision to cycle to work– place of study is heavily influenced by cycling habits (for noncommuting trips). Because bicycle commuting is not common, attitudes and other psychological variables play a less important role in the use of bikes.
The benefits of bicycle use are undeniable, both for users (in health, flexibility, availability, cost, speed) and for society (low emissions, sustainability). As a result of these benefits, the bicycle as a trans-portation mode has become a key element of many transtrans-portation policies designed to foster sustainable development. Many countries, regions, and cities have initiated policies supporting bicycle use. In Spain, these policies include measures such as creating cycling lanes and safe bicycle parking, improving bicycle–public transportation intermodality, and public bicycle-sharing systems. These measures have fueled a positive trend in bicycle use in Spain (1). However, cycling levels are still low, especially for commuting trips.
perceptions of their ability to perform a given behavior” (14). The descriptive norms, which were included by Ajzen and Fishbein (15) in a revision of the TPB so as to complete the subjective norm, have also been incorporated into this study. They are defined as perceptions of what others are doing. Some studies have shown that habit also has a significant influence on behavior, specifically on bicycle use (7). Therefore, habit was also included as part of this research. All these elements were applied to the study of cycling behavior, as shown in Figure 1.
This study focused on the choice of commuting mode to work or study: the mode used three or more times per week. It also takes into account the subjects’ cycling experience for purposes other than commuting. As Figure 1 shows, three categories were established for the analyses: the person’s (a) use or nonuse of a bicycle for the daily commute [cycling commuter (CC) or noncycling commuter (NCC)]; (b) commuting mode choice [bicycle (CC), pedestrian (P), public transport (PT), or car–motorbike (CM)]; and (c) bicycle experience [commuter cyclist (CC), sport–leisure cyclist (SLC), or noncyclist (NC)].
Each psychological component was studied through several vari-ables. A number of variables related to attitudes and to PBC were selected after a review of the literature on the reasons that encour-age or discourencour-age cycling. The most common reasons found in the literature are these:
• Positive. Health reasons–fitness, environmental awareness, perceived cost, speed, fun, flexibility, image prestige, relaxation, availability, reliability, ease of parking, and quality of life (1, 4–6, 9, 16–18); and
• Negative. Too dangerous, lack of sufficient fitness, lack of motivation, lack of facilities at work (showers, bike racks, etc.), no bike lanes, personal safety during journey, bad weather, lack of proper lighting, distance, topography, lack of safe parking at desti-nation, lack of cycling knowledge or experience, too much traffic,
uncomfortable, difficulties with trip chaining, need to carry things, air pollution, free car parking at work, lack of time, and bad road conditions (3, 4, 6, 9, 16, 18–22).
The attitudinal questions included all the positive and some of the negative reasons. The PBC questions included negative reasons but only a limited number because of time–survey limitations. A sum-mary of the variables used in the research appears in the later section on valuation of psychological components.
METHODOLOGY
A three-step methodology was used to analyze the relationship between psychological factors and bicycle commuting. Psychologi-cal factors were measured by asking about perceptions of cycling factors. These were the variables used for the study. First, statisti-cal differences in the variables between groups were determined: between CCs (mode) and other mode commuters and between CCs (bicycle experience), SLCs, and NCs. Determining these variables enabled the authors to identify the main barriers to commuting by bicycle. Second, an explanatory factor analysis was performed to identify and define the main underlying structures among the atti-tudinal and perceived behavioral control variables. The appropriate summated scales for the rest of the variables (norms and habits) were also defined. Third, a binary logit model was constructed on the basis of the abovementioned factors and scales to determine the key psy-chological factors influencing bicycle commuting. SPSS, Version 18, was used as the statistical tool for the analyses.
Case Study
has a low cycling culture, and bicycle use in the city center is 0.6% (23). However, the local government is increasing its support for this mode and progressively building a network of bicycle lanes and bicycle parks.
Survey Description
The survey discussed in this paper was conducted as part of a munici-pal study to analyze the mobility demand and social impacts of two future cycling lanes in the city center of Madrid (24). Behavioral aspects of cycling were introduced in the survey, as shown in Figure 1.
The survey was conducted during workdays in the third week of September 2011. Surveys were short face-to-face on-street interviews taking approximately 15 min. They were conducted on four streets in the center of Madrid. Because the survey focused on residents’ mobility, tourists were excluded.
The final valid sample was 224, which is a reasonable sample size. However, it is somehow limited for a detailed analysis of the com-parison of the variables across different groups. The sample was designed according to the specific objectives of the municipal study and consisted of 40% cyclists, 20% Ps, 20% PT users, and 20% CM users. Today, the modal split in the city center of Madrid is as fol-lows: 0.6% cycling trips, 37.4% walking trips, 39.0% PT trips, and 23.0% CM trips (23). Consequently, the sample is not representative of mobility.
Perceptions of cycling factors were obtained through two types of questions: those involving attitudes and those related to the control of bicycle use [perceived behavioral control (PBC)]. The survey also included several questions related to subjective and descriptive norms and mobility habits. Also part of the survey were socio-economic questions and those on issues such as parking availability, use of a PT travel card, and perceptions of cycling facilities in Madrid. The results of the survey enabled assessment of the psychological components of cycling decisions.
Valuation of Psychological Components
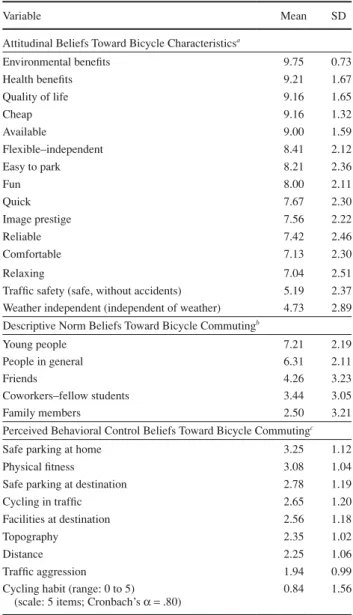
Psychological components were measured by asking about attitudi-nal beliefs, descriptive norm beliefs, and perceived behavioral control beliefs (Table 1). The subjective norm was calculated as its respective beliefs weighted by the corresponding importance (Table 2).
Cycling habit was measured by following the response frequency measure established by Verplanken et al. (25). Respondents were asked, “Which mode of transportation do you use most frequently for the following activities?” A five-item version of the original response-frequency measure was used, including five noncommuting trip purposes: shopping for daily consumer items, going shopping, accom-panying children–the elderly, going out (restaurants, cinema, etc.), and visiting family or friends. The strength of cycling habit was indexed by the number of choices of the bicycle mode.
Table 1 shows the valuation of the main variables used. All variables were treated as scalars, as the authors adopted the same distance between valuations as the hypothesis. (Mean scores are shown in parentheses for the remainder of the paper.) The appropriate sum-mated scales for the variables of subjective norm, descriptive norm, and habit have been defined, and their corresponding Cronbach’s
α coefficients have been calculated. Cronbach’s α coefficient is a weighted average of the correlations between the variables of a scale. It is used to measure the internal consistency or reliability of a scale (26). In this case, all Cronbach’s α coefficients are greater than the
TABLE 1 Psychological Components Valuation
Variable Mean SD
Attitudinal Beliefs Toward Bicycle Characteristicsa
Environmental benefits 9.75 0.73
Health benefits 9.21 1.67
Quality of life 9.16 1.65
Cheap 9.16 1.32
Available 9.00 1.59
Flexible–independent 8.41 2.12
Easy to park 8.21 2.36
Fun 8.00 2.11
Quick 7.67 2.30
Image prestige 7.56 2.22
Reliable 7.42 2.46
Comfortable 7.13 2.30
Relaxing 7.04 2.51
Traffic safety (safe, without accidents) 5.19 2.37
Weather independent (independent of weather) 4.73 2.89
Descriptive Norm Beliefs Toward Bicycle Commutingb
Young people 7.21 2.19
People in general 6.31 2.11
Friends 4.26 3.23
Coworkers–fellow students 3.44 3.05
Family members 2.50 3.21
Perceived Behavioral Control Beliefs Toward Bicycle Commutingc
Safe parking at home 3.25 1.12
Physical fitness 3.08 1.04
Safe parking at destination 2.78 1.19
Cycling in traffic 2.65 1.20
Facilities at destination 2.56 1.18
Topography 2.35 1.02
Distance 2.25 1.06
Traffic aggression 1.94 0.99
Cycling habit (range: 0 to 5)
(scale: 5 items; Cronbach’s α= .80) 0.84 1.56
NOTE: SD = standard deviation. Descriptive norm beliefs toward bicycle
commuting: mean = 4.76; SD = 1.91.
aQuestion: Considering the characteristics of the bicycle as a mode of transportation, evaluate to what extent you agree with the following (range: 0 to 10).
bQuestion: To what extent do you think bicycle use has increased in Madrid among the following groups of people (range: 0 to 10)?
cQuestion: To what extent do you consider it possible (or would it be possible) to commute by bicycle, considering the following factors (range: 1 to 4)?
suggested minimum acceptable level of 0.7 (27), indicating that internal consistency is acceptable. It is therefore acceptable to use the summated scales instead of the original variables.
the family, followed by friends and then coworkers–fellow students. In relation to the descriptive norm beliefs, the respondents consider that young people are the group that is increasing its use of the bicycle the most (7.21). In contrast, respondents’ family members are seen as the group that has increased its bicycle use the least (2.50). Safe parking at home is the perceived behavioral control factor with the highest average score (3.25), followed by physical fitness (3.08) and safe parking at destination (2.78). These results mean that respondents show fewer difficulties in relation to these factors. However, traffic aggression shows the lowest control value (1.94); hence, it is the larg-est barrier to overcome. On average, the bicycle is more frequently used for 0.84 times of the five noncommuting trip purposes described. Therefore, the cycling habit in the sample is extremely low.
EMPIRICAL APPLICATION
Descriptive Analysis
When the categories for type of commuter, mode choice, and bicycle experience are considered, the sample is distributed as follows:
• According to choice of commuting mode: – 27% CCs and
– 73% NCCs: 1. 12% Ps,
2. 39% PT [bus (8.0%), subway–railway (30.5%), and cab (0.5%)], and
3. 22% CM [car (17%) and motorbike (5%)] and
• According to bicycle experience: – 27% CC,
– 27% SLC, and – 46% NC.
Most respondents are male (59%), with the 25–34 age group most heavily represented. It is also worth noting that 16% of the sample is foreigners, mostly in the younger age groups (up to 45). Fifty-nine percent of respondents have CM availability to commute. However, only 22% of them use it for their commuting trips. The remain-ing potential CM users mainly choose PT (18%), cyclremain-ing (12%), or walking (7%). The majority of the respondents (72%) are able to ride a bicycle and have a bicycle available for their daily trips. However, only 38% of them (27% of all respondents) choose the bicycle for commuting.
Comparisons Across Groups
This section analyzes whether any statistical differences exist in the mean score of the variables between different groups. Because the authors conducted multiple comparison tests, it was necessary to use adjusted P-values. The adjusted P-value for a particular hypothesis within a collection of hypotheses is the smallest overall significance level at which the particular hypothesis would be rejected (28).
Table 3 shows that cycling commuters value all bicycle charac-teristics more positively than noncycling commuters, as expected. The
TABLE 3 Attitudinal Beliefs Toward Bicycle Characteristics, NCC Compared with Cycling Commuters
Reference
Group Aggregated Mode Choice for NCC Bicycle Use for NCC
Bicycle Characteristic CC Mean NCC Mean Sig.
a
(ref. to CC) P Mean PT Mean CM Mean Sig.
a
(ref. to CC) SLC Mean NC Mean Sig.
a
(ref. to CC)
Quick 8.85 7.23 0.000 7.73 7.40 6.66 0.000 7.85 6.85 0.00
Environmental benefits 9.84 9.71 0.092 9.58 9.82 9.60 0.128 9.79 9.67 0.15
Cheap 9.46 9.04 0.017 9.23 8.99 9.04 0.057 9.11 9.00 0.10
Available 9.39 8.86 0.025 8.69 9.05 8.62 0.070 8.92 8.82 0.07
Traffic safety 6.10 4.85 0.000 4.62 4.93 4.84 0.000 5.38 4.54 0.00
Reliable 8.77 6.91 0.000 7.00 6.92 6.86 0.000 7.77 6.40 0.00
Health benefits 9.51 9.09 0.150 9.31 9.21 8.78 0.057 9.36 8.93 0.23
Comfortable 8.23 6.71 0.000 6.81 6.99 6.18 0.000 7.70 6.12 0.00
Flexible–independent 9.33 8.07 0.000 8.12 8.48 7.32 0.000 8.59 7.75 0.00
Weather independent 6.20 4.18 0.000 4.35 4.08 4.26 0.000 5.26 3.53 0.00
Relaxing 8.20 6.61 0.000 6.50 6.78 6.36 0.000 7.77 5.91 0.00
Fun 8.92 7.65 0.000 7.35 7.85 7.46 0.000 8.57 7.10 0.00
Image prestige 7.85 7.45 0.390 7.54 7.28 7.72 0.480 7.52 7.41 0.43
Easy to park 8.54 8.08 0.037 8.19 8.17 7.86 0.000 8.77 7.67 0.16
Quality of life 9.51 9.03 0.007 8.92 9.24 8.72 0.013 9.38 8.82 0.02
NOTE: Sig. = significance; ref. = referred. Significant differences shown in gray. Sample size: CC = 61, NCC = 163, P = 26, PT = 87, CM = 50, SLC = 61, NC = 102.
aMann–Whitney (U) test when two groups and Kruskal–Wallis (H) test when three or four groups. Adjusted significance levels: p < (.05/15) = .003; p < (.10/15) = .007. TABLE 2 Subjective Norm Belief and Importance
Influencing Group Belief Importance Mean SD
Family 6.98 4.77 34.63 33.43
Friends 7.29 3.84 29.71 31.50
Coworkers–
fellow students 6.78 3.23 24.51 29.29
NOTE: Subjective norm toward bicycle commuting–aggregated value
most positive attitudinal beliefs of cycling commuters correspond to the variables environmental benefits (9.84), health benefits (9.51), and quality of life (9.51). The lowest value for cycling commuters is shown by the variable traffic safety (6.10), while, for noncycling commuters, it is the characteristic weather independent (4.18), fol-lowed by traffic safety (4.85). In relation to the noncycling commuter group, Ps and PT commuters are attitudinally close to cyclists, while the lowest values for most variables are given by CM commuters. By bicycle experience, the attitudinal beliefs of SLCs appear to be mid-way between cyclists and noncyclists. All these differences between groups are statistically significant for the variables quick, traffic safety, reliable, comfortable, flexible–independent, weather indepen-dent, relaxing, fun, and quality of life. Easy to park shows statistically significant differences only for the mode choice grouping.
As the purpose of cycling policies is to shift trips from CM to bicycle, the authors examined the differences in the factor valuation for CM and bicycle users. The variables quick, comfortable, flexible– independent, weather independent, reliable, and relaxing show the greatest differences between CCs and CM commuters. Most CM commuters do not use a bicycle at all (60%). Therefore, differ-ences between these factors are influenced by the lack of knowledge by CM commuters of the cycling experience itself (29).
Differences in average perceived social pressure (subjective norm) to commute by bicycle only appear to be statistically significant between bicycle use groups (Table 4). In relation to the descriptive norm, its corresponding scale shows statistically significant differ-ences for the three groupings. Perceptions of an increase in bicycle use can be seen to be more positive in cycling commuters, followed by PT commuters, Ps, and CM commuters. The descriptive norm is also higher for SLCs than for NCs but lower than for commuter cyclists.
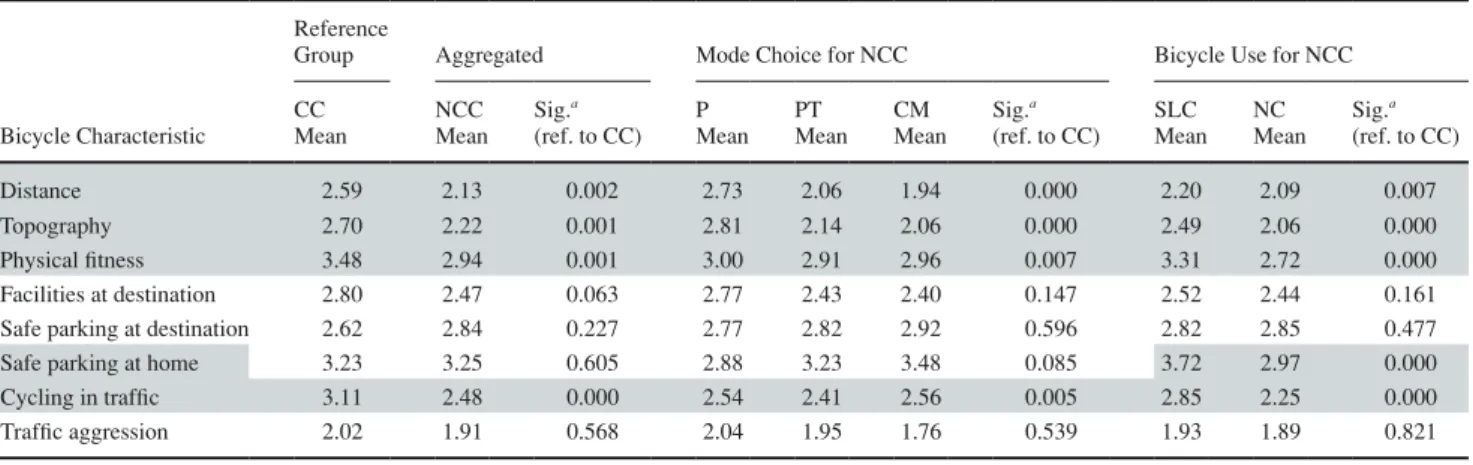
A comparison of the mean score of the perceived behavioral control beliefs toward bicycle commuting (PBC) variables between groups
shows that cycling commuters give the highest scores (Table 5). These high scores indicate that their difficulties in using the bicycle to commute are lower than the corresponding difficulties for NCCs. As for the total sample, the variables traffic aggression, distance, and topography are the greatest difficulties for both cycling commuters and NCCs. With reference to NCCs, PT commuters and CM com-muters perceive all difficulties to be more important than any other group. Therefore, in this case only, Ps appear to be close to cycling commuters. In relation to bicycle experience, the barriers decrease as cycling experience increases. All these differences between groups are statistically significant except for the variables facilities at destination, safe parking at destination, and traffic aggression.
Rating all these cycling barriers according to differences between cycling commuters and CM commuters, one can see the following:
• Cycling commuters give the highest scores to all variables, except for safe parking at home and safe parking at destination. These results show that nonusers do not perceive problems related to parking the bicycle.
• Variables such as distance, topography, cycling in traffic, and physical fitness, which are widely perceived as barriers to bicycle use, provoke fewer difficulties to cycling commuters than to NCCs. Thus, differences in these variables seem to be the consequence of ignorance about the cycling experience itself by CM commuters (29). These difficulties can therefore be overcome by the cycling experience.
• Variables that affect both types of commuters (traffic aggression, facilities at destination, safe parking at home, and safe parking at des-tination) cannot be overcome by the cycling experience. Therefore, cycling policies should focus on these variables.
When the bicycle habits for noncommuting trips between groups are compared, all differences are statistically significant (Table 6).
TABLE 4 Subjective and Descriptive Norm Toward Bicycle Commuting, NCC Compared with Cycling Commuters
Reference
Group Aggregated Mode Choice for NCC Bicycle Use for NCC
Social Group CC Mean NCC Mean Sig.
a
(ref. to CC) P Mean PT Mean CM Mean Sig.
a
(ref. to CC) SLC Mean NC Mean Sig.
a
(ref. to CC)
Subjective norm scale 32.20 28.59 0.567b 29.54 30.15 25.38 0.682b 34.75 24.90 0.066b
Family 33.02 35.23 0.739c 37.54 36.34 32.10 0.866c 41.13 31.71 0.201c
Friends 33.92 28.13 0.362c 27.85 30.07 24.90 0.620c 34.41 24.37 0.096c
Coworkers–fellow students 29.61 22.60 0.178c 23.35 24.38 19.12 0.273c 29.74 18.33 0.015c
Descriptive norm scale n= 59 n= 158 0.011b n= 25 n= 86 n= 47 0.068b n= 59 n= 99 0.002b
n= 5.30 4.56 4.58 4.66 4.38 5.03 4.29
People in general n= 59 n= 158 0.021d n= 25 n= 86 n= 47 0.130d n= 59 n= 99 0.023d
6.73 6.15 6.20 6.10 6.21 6.47 5.96
Young people n= 58 n= 158 0.351d n= 25 n= 86 n= 47 0.734d n= 59 n= 99 0.646d
7.38 7.15 7.40 7.17 6.98 7.07 7.20
Family members n= 56 n= 155 0.188d n= 25 n= 84 n= 46 0.257d n= 57 n= 98 0.007d
2.98 2.32 1.72 2.61 2.13 3.33 1.73
Friends n= 58 n= 158 0.003d n= 25 n= 86 n= 47 0.027d n= 59 n= 99 0.000d
5.24 3.90 4.24 3.86 3.79 4.85 3.33
Coworkers–fellow students n= 56 n= 157 0.104d n= 25 n= 86 n= 47 0.226d n= 59 n= 98 0.262d
4.02 3.24 3.32 3.49 2.72 3.34 3.17
NOTE: Significant differences shown in gray. Sample size: CC = 61, NCC = 163, P = 26, PT = 87, CM = 50, SLC = 61, NC = 102.
aMann–Whitney (U) test when two groups and Kruskal–Wallis (H) test when three or four groups. bSignificance levels: p < .05; p < .10.
Cycling commuters show a greater cycling habit (1.61) than NCCs (0.08). This difference indicates that cycling commuters also use this mode for noncommuting trips such as shopping, visiting friends, and so on. NCCs use the bicycle mainly for sport (which is not included in this measure of bicycle habit); hence, their bicycle habit is extremely low.
Factor Analysis
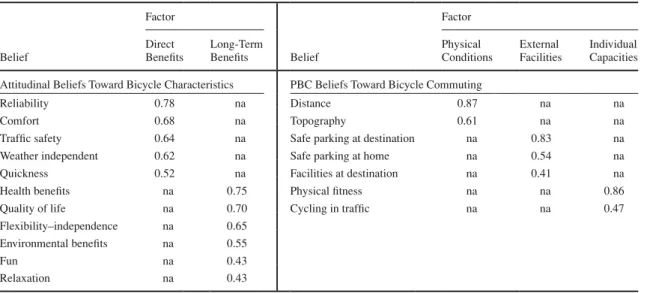
An exploratory factor analysis was used to reduce the number of attitudinal and perceived behavioral control variables and to identify their main underlying structures (factors). Variables with high cor relation are components of the same factor. Table 7 shows the association of variables and defines two factors for attitudi-nal variables and three factors for perceived behavioral control variables.
The characteristics cheap, available, image prestige, and easy to park were removed from attitudinal beliefs because of low communal-ity (<0.30). Direct and long-term benefits are the new factors identified and explain a variance of 49.18%. The importance of direct benefits comes from bicycle characteristics, such as reliable and comfortable. The second factor, long-term benefits, is mainly defined by character-istics such as health benefits and quality of life and, to a lesser extent, by flexible–independent and environmental benefits.
For perceived behavioral control beliefs, traffic aggression was removed because of low communality (<0.20). Three factors explain-ing the 49.19% variance were identified. The factor physical con-ditions is explained by the distance and topography variables. The second factor, external facilities, is linked to parking and other facili-ties. The third factor is mainly defined by the variable physical fitness and is therefore designated individual capacities.
The assumptions underlying factor analysis were previously checked (27): minimum sample size (224 > 5 p 15 items of attitudes; 224 > 5 p 8 items of PBC), and multicollinearity (Bartlett’s test sig-nificance = 0.00; measure of sampling adequacy > 0.6). The Oblimin rotation (with delta zero) was used to find the factors. Factor scores were calculated by the Anderson–Rubin method.
Explanatory Factors of Cycling Behavior
A binary logit model was used to observe the effect of attitudes and other psychological variables on the decision to commute by bicycle or to choose another mode. The dependent variable BC is obtained from the survey, and it is equal to 1 if the respondents commute daily by bicycle and 0 otherwise. The factors and scales calculated in the previous sections are the independent variables. The estimation of the discrete choice model was made by using SPSS software, seeking the model with best explanatory power. The influence of sociodemographic variables is partially incorpo-rated into the model. These variables are treated as previous ones, as influencing the formation of attitudes, social norms, and perceived behavioral control (30).
The variables of Model 1 include attitudes, norms, and perceived behavioral control. The results of this model show that direct ben-efits and individual capacities appear to influence significantly the TABLE 5 PBC Beliefs Toward Bicycle Commuting, NCC Compared with Cycling Commuters
Reference
Group Aggregated Mode Choice for NCC Bicycle Use for NCC
Bicycle Characteristic CC Mean NCC Mean Sig.
a
(ref. to CC) P Mean PT Mean CM Mean Sig.
a
(ref. to CC) SLC Mean NC Mean Sig.
a
(ref. to CC)
Distance 2.59 2.13 0.002 2.73 2.06 1.94 0.000 2.20 2.09 0.007
Topography 2.70 2.22 0.001 2.81 2.14 2.06 0.000 2.49 2.06 0.000
Physical fitness 3.48 2.94 0.001 3.00 2.91 2.96 0.007 3.31 2.72 0.000
Facilities at destination 2.80 2.47 0.063 2.77 2.43 2.40 0.147 2.52 2.44 0.161
Safe parking at destination 2.62 2.84 0.227 2.77 2.82 2.92 0.596 2.82 2.85 0.477
Safe parking at home 3.23 3.25 0.605 2.88 3.23 3.48 0.085 3.72 2.97 0.000
Cycling in traffic 3.11 2.48 0.000 2.54 2.41 2.56 0.005 2.85 2.25 0.000
Traffic aggression 2.02 1.91 0.568 2.04 1.95 1.76 0.539 1.93 1.89 0.821
NOTE: Significant differences shown in gray. Sample size: CC = 61, NCC = 163, P = 26, PT = 87, GM = 50, SLC = 61, NC = 102.
aMann–Whitney (U) test when two groups and Kruskal–Wallis (H) test when three or four groups. Adjusted significance levels: p < (.05/8) = .006; p < (.10/8) = .013.
TABLE 6 Bicycle Habit for Noncommuting Trip Purposes, Except Sport, NCC Compared with Cycling Commuters
Commute Mode Sample Size Habit
Reference group
CC 61 1.61
Aggregated
NCC 163 0.08
Sig.a (ref. to CC) na 0.00
Mode choice for NCC
P 26 0.12
PT 87 0.08
CM 50 0.06
Sig.a (ref. to CC) na 0.00
Bicycle use for NCC
SLC 61 0.21
NC 102 0.00
Sig.a (ref. to CC) na 0.00
NOTE: na = not applicable; ref. = referenced.
likelihood of cycling to work–place of study (Table 8). A positive perception of the bicycle’s direct benefits (reliable, comfortable, traffic safety, weather independent, and quick), and a positive percep-tion of individual capacities (physical fitness and cycling in traffic), positively affects the decision to cycle for commuting purposes (β= 1.23 and β= 0.42, respectively).
If the variable cycling habit is included (Model 2), the choice process is mainly influenced by current habit. Respondents with a cycling habit for purposes other than commuting (except sport) have a greater likelihood of cycling to work–place of study (β= 1.74). This variable shows the greatest odds ratio (5.68), which means that, with every unit of increase in habit, the increase in the likelihood of that person being a cycling commuter is multiplied by 5.68. The variable direct benefits loses explanatory power (β from 1.23 to 1.02), and the PBC variable individual capacities (PBC Factor 3) is not statistically significant. Because the chi-square likelihood ratio test (61.03) is more than the critical value (3.84 for p < .05), Model 2 (including habit) is an improvement over Model 1 (without habit).
CONCLUSIONS AND
POLICY RECOMMENDATIONS
This paper examined perceptions of different cycling factors and their influence on bicycle commuting. Perceptions were measured by using psychological constructs: attitudes, social norms, PBC—people’s perceptions of their ability to perform a given behavior—and habit.
First, statistical differences of the variables were determined between cycling commuters and commuters by other modes and between commuter cyclists, SLCs, and NCs. The main barriers to commuting by bicycle affecting different types of commuters were identified. These results can be used to reorient cycling policy efforts to achieve visible improvements in commuting by bicycle in Madrid.
The study confirms that cycling commuters value all cycling fac-tors more positively than NCCs (2–5). It also demonstrates that the difficulties for cycling commuters in using the bicycle to commute are lower than the corresponding difficulties for NCCs (2, 4, 6). TABLE 7 Correlations Between Factors and Attitudes, PBC Variables
Factor Factor
Belief Direct Benefits Long-Term Benefits Belief Physical Conditions External Facilities Individual Capacities
Attitudinal Beliefs Toward Bicycle Characteristics PBC Beliefs Toward Bicycle Commuting
Reliability 0.78 na Distance 0.87 na na
Comfort 0.68 na Topography 0.61 na na
Traffic safety 0.64 na Safe parking at destination na 0.83 na
Weather independent 0.62 na Safe parking at home na 0.54 na
Quickness 0.52 na Facilities at destination na 0.41 na
Health benefits na 0.75 Physical fitness na na 0.86
Quality of life na 0.70 Cycling in traffic na na 0.47
Flexibility–independence na 0.65
Environmental benefits na 0.55
Fun na 0.43
Relaxation na 0.43
NOTE: Values below 0.4 are not reported.
TABLE 8 Results of Logistic Regressions of Cycle Commuting
Model 1 Model 2
Variable β Sig. Exp(β) β Sig. Exp(β)
Attitudinal factor 1: direct benefits 1.23 0.00 3.44 1.02 0.00 2.78
Attitudinal factor 2: long-term benefits 0.31 0.23 1.37 0.05 0.85 1.05
Subjective norm 0.00 0.81 1.00 0.01 0.41 1.01
Descriptive norm 0.03 0.73 1.03 −0.01 0.97 1.00
PBC factor 1: physical conditions 0.22 0.23 1.25 0.23 0.33 1.26
PBC factor 2: external facilities −0.15 0.41 0.86 −0.13 0.58 0.88
PBC factor 3: individual capacities 0.42 0.05 1.52 0.20 0.43 1.22
Cycling habit — — — 1.74 0.00 5.68
Constant −1.62 0.00 0.20 −2.30 0.00 0.08
NOTE: — = not included. Significance levels: p = .05; p < .10. Significant variables shown in gray. Model 1: N= 217; model chi-squared = 54.81; Cox and Snell R2= .22. Model 2: N= 217; model chi-squared = 115.84;
Moreover, the findings show that increasing the cycling experience (including sport) increases the valuation of attitudinal beliefs and decreases the barriers to commuting by bicycle. CM commuters are the most strongly opposed to cycling commuters, showing the greatest differences. These differences indicate that negative per-ceptions from CM commuters (the bicycle is slow, uncomfortable, inflexible, weather dependent, unreliable, and stressful), and their barriers (distance, topography, cycling in traffic, and physical fitness), could be improved by policies that allow NCCs to experience cycling more easily, for example, measures that allow easy daily access to bicycles (public bike sharing), free availability of bicycles in com-panies for employees, tax discounts when buying a bicycle, and integration with public transportation.
Traffic safety is the worst-perceived attitudinal factor for cycling commuters and the second worst for other commuters. Moreover, all respondents show more difficulties in relation to traffic aggression (PBC item). This finding highlights a real problem in the relation-ship between bicycles and motorized traffic in the congested city center of Madrid. This paper demonstrates that this problem cannot be solved simply by increasing the cyclist commuting experience. It is also necessary to provide dedicated cycle lanes, to restrict car access, and to implement traffic calming in certain areas.
Other factors involving bicycle facilities (lack of showers or bike racks at destination, lack of safe parking at home or at destination) are also impossible to resolve through the cycling experience. These variables should therefore be included as measures in the cycling mobility strategy of local administrations and organizations.
In the case study, family is the social group with the most positive influence on the decision to commute by bicycle. Moreover, young people are seen as the group that is increasing its bicycle use the most in Madrid. Therefore, cycling publicity campaigns should have a twofold objective: to encourage families to support more bicycle use and to dispel the image of bicycles as being only for young people.
Second, two underlying structures (factors) have been identified among the attitudinal variables: direct benefits and long-term ben-efits. As for PBC variables, three other factors are relevant: physical conditions, external facilities, and individual capacities.
Third, the effects of attitudes, norms, PBC, and habit have been tested for cycling to work–place of study. Choosing the bicycle as a commuting mode is mainly defined by the existence of bicycle habit for noncommuting trips. Attitudes related to direct benefits in reliability, comfort, and time are influential on the choice of the bicycle as a commuting mode but to a lesser extent than habit. This result represents the case of a city with low bicycle use, which is in contrast with cases where cycling is a normal practice. In cycling cities, both habit and TPB factors (attitudinal direct benefits and PBC) show a significant influence on cycling commuting (5). The social and physical context, as well as the method of measuring the PBC (disaggregated in several items in the present study), might explain the different results.
Some of the aforementioned policies could foster noncommuters to start experiencing cycling and then to develop their habit for non-commuting trips and finally for non-commuting. Thus, Park et al. mention that 57% of commuter cyclists began as leisure cyclists (31). How-ever, the increase in the number of commuting trips must come from motorized trips so as to maintain high levels of Ps and PT users. When the bicycle is considered to be a real mode of transportation in the city, the importance of attitudes, norms, and PBC is likely to increase, as bicycle use is less dependent on habit.
This is the first application of the TPB model in a context with low bicycle modal share. This research can therefore be used as a case
study, because it is likely to be highly comparable to other locations with a low mode share for cycling. Moreover, this application has used disaggregated measures of subjective norm, descriptive norm, and PBC. Further development of the proposed model could be a hybrid model, including the relationship between the physiological variables and other sociodemographic and socioeconomic variables.
REFERENCES
1. Monzón, A., and G. Rondinella. PROBICI. Guía de la Movilidad Ciclista.
Métodos y Técnicas para el Fomento de la Bicicleta en Áreas Urbanas.
Instituto para la Diversificacion y Ahorro de la Energia, Madrid, Spain, 2010.
2. De Bruijn, G. J., S. P. J. Kremers, H. Schaalma, W. van Mechelen, and J. Brug. Determinants of Adolescent Bicycle Use for Transportation
and Snacking Behavior. Preventive Medicine, Vol. 40, No. 6, 2005,
pp. 658–667.
3. Dill, J., and K. Voros. Factors Affecting Bicycling Demand: Initial Survey
Findings from the Portland, Oregon, Region. In Transportation Research
Record: Journal of the Transportation Research Board, No. 2031, Trans-portation Research Board of the National Academies, Washington, D.C., 2007, pp. 9–17.
4. Gatersleben, B., and K. M. Appleton. Contemplating Cycling to Work:
Attitudes and Perceptions in Different Stages of Change. Transportation
Research Part A: Policy and Practice, Vol. 41, No. 4, 2007, pp. 302–312. 5. Heinen, E., K. Maat, and B. van Wee. The Role of Attitudes Toward
Characteristics of Bicycle Commuting on the Choice to Cycle to Work
over Various Distances. Transportation Research Part D: Transport and
Environment, Vol. 16, No. 2, 2011, pp. 102–109.
6. De Geus, B., I. De Bourdeaudhuij, C. Jannes, and R. Meeusen. Psycho-social and Environmental Factors Associated with Cycling for Transport
Among a Working Population. Health Education Research, Vol. 23,
No. 4, 2007, pp. 697–708.
7. De Bruijn, G. J., S. P. J. Kremers, A. Singh, B. Van Den Putte, and W. Van Mechelen. Adult Active Transportation: Adding Habit Strength
to the Theory of Planned Behavior. American Journal of Preventive
Medicine, Vol. 36, No. 3, 2009, pp. 189–194.
8. Verplanken, B., H. Aarts, and A. Van Knippenberg. Habit, Information
Acquisition, and the Process of Making Travel Mode Choices. European
Journal of Social Psychology, Vol. 27, No. 5, 1997, pp. 539–560. 9. Stinson, M. A., and C. R. Bhat. Frequency of Bicycle Commuting:
Internet-Based Survey Analysis. In Transportation Research Record:
Journal of the Transportation Research Board, No. 1878, Transportation Research Board of the National Academies, Washington, D.C., 2004, pp. 122–130.
10. Heinen, E., B. van Wee, and K. Maat. Commuting by Bicycle: An
Overview of the Literature. Transport Reviews, Vol. 30, No. 1, 2010,
pp. 59–96.
11. Ajzen, I. The Theory of Planned Behavior. Organizational Behavior
and Human Decision Processes, Vol. 50, No. 2, 1991, pp. 179–211. 12. Bamberg, S., and P. Schmidt. Car or Bicycle: An Empirical Test of a
Utility-Theory-Approach for Predicting the Choice Between Means of
Transportation. Kölner Zeitschrift für Soziologie und Sozialpsychologie,
Vol. 46, No. 1, 1994, pp. 80–102.
13. Burbidge, S. K., and K. G. Goulias. Active Travel Behavior.
Transpor-tation Letters: The International Journal of TransporTranspor-tation Research,
Vol. 1, No. 2, 2009, pp. 147–167.
14. Ajzen, I. http://people.umass.edu/aizen/index.html. Accessed May 8, 2012.
15. Ajzen, I., and M. Fishbein. The Influence of Attitudes on Behavior. In The Handbook of Attitudes (D. Albarracin, B. T. Johnson, and M. P. Zanna, eds.), Lawrence Erlbaum Associates, Mahwah, N.J., 2005, pp. 173–221. 16. Bergström, A., and R. Magnusson. Potential of Transferring Car Trips
to Bicycle During Winter. Transportation Research Part A: Policy and
Practice, Vol. 37, No. 8, 2003, pp. 649–666.
17. Ryley, T. Use of Non-Motorised Modes and Life Stage in Edinburgh.
Journal of Transport Geography, Vol. 14, No. 5, 2006, pp. 367–375. 18. Fernández-Heredia, Á., and A. Monzón de Cáceres. Cyclists? Travel
19. Noland, R. B., and H. Kunreuther. Short-Run and Long-Run Policies for
Increasing Bicycle Transportation for Daily Commuter Trips. Transport
Policy, Vol. 2, No. 1, 1995, pp. 67–79.
20. Wardman, M., M. Tight, and M. Page. Factors Influencing the Propensity
to Cycle to Work. Transportation Research Part A: Policy and Practice,
Vol. 41, No. 4, 2007, pp. 339–350.
21. Akar, G., and K. J. Clifton. Influence of Individual Perceptions and
Bicycle Infrastructure on Decision to Bike. In Transportation Research
Record: Journal of the Transportation Research Board, No. 2140, Trans-portation Research Board of the National Academies, Washington, D.C., 2009, pp. 165–172.
22. Lee, I., H. Park, and K. Sohn. Increasing the Number of Bicycle
Com-muters. Proceedings of the Institution of Civil Engineers: Transports,
Vol. 165, No. 1, June 2011, pp. 63–72.
23. 2° Informe de la Movilidad de la Ciudad de Madrid 2009. Fundación
Movilidad. http://www.ecomove.es/ecomove/biblioteca/fundacion_ movilidad_madrid.pdf. Accessed June 23, 2012.
24. Estudio de Evaluación de la Demanda, Impacto Social y Sobre la Movilidad Urbana Correspondiente a los Ejes de la Red Básica de Vías Ciclistas de las Calles Atocha–Mayor–Alcalá, y de La Calle Bailén y su Entorno, 2011. Accessed June 23, 2012. http://www.madrid.es/Unidades
Descentralizadas/UDCMovilidadTransportes/EspecialInformativo/ OficinaBici/IMC_2011_Atocha.pdf.
25. Verplanken, B., H. Aarts, A. Knippenberg, and C. Knippenberg. Attitude
Versus General Habit: Antecedents of Travel Mode Choice. Journal of
Applied Social Psychology, Vol. 24, No. 4, 1994, pp. 285–300. 26. Cronbach, L. J. Coefficient Alpha and the Internal Structure of Tests.
Psychometrika, Vol. 16, No. 3, 1951, pp. 297–334.
27. Hair, J., W. Black, B. Babin, R. Anderson, and R. Tatham. Multivariate
Data Analysis. Prentice Hall, Upper Saddle River, N.J., 2006.
28. Wright, S. P. Adjusted p-Values for Simultaneous Inference. Biometrics,
1992, pp. 1005–1013.
29. Rondinella, G., A. Fernandez-Heredia, and A. Monzon. Analysis of Per-ceptions of Cycling by Level of User Experience. Presented at 91st Annual Meeting of the Transportation Research Board, Washington, D.C., 2012.
30. Ajzen, I., and M. Fishbein. Understanding Attitudes and Predicting
Social Behaviour. Prentice Hall, Englewood Cliffs, N.J., 1980. 31. Park, H., Y. J. Lee, H. C. Shin, and K. Sohn. Analyzing the Time Frame for
the Transition from Leisure-Cyclist to Commuter-Cyclist. Transportation,
Vol. 38, No. 2, 2011, pp. 305–319.