arXiv:1707.03823v2 [astro-ph.SR] 8 Sep 2017
September 11, 2017
Two transitional type Ia supernovae located in the Fornax
cluster member NGC 1404: SN 2007on and SN 2011iv
⋆
C. Gall
1,2, M. D. Stritzinger
1, C. Ashall
3, E. Baron
4, C. R. Burns
5, P. Hoeflich
6, E. Y. Hsiao
6,1, P. A. Mazzali
3, M. M.
Phillips
7, A. V. Filippenko
8, J. P. Anderson
9, S. Benetti
10, P. J. Brown
11, A. Campillay
7, P. Challis
9, C. Contreras
7,1, N.
Elias de la Rosa
10, G. Folatelli
11, R. J. Foley
12, M. Fraser
13, S. Holmbo
1, G. H. Marion
14, N. Morrell
7, Y.-C. Pan
12, G.
Pignata
15,16, N. B. Suntzeff
11, F. Taddia
17, S. Torres Robledo
7, and S. Valenti
181 Department of Physics and Astronomy, Aarhus University, Ny Munkegade 120, DK-8000 Aarhus C, Denmark
2 Dark Cosmology Centre, Niels Bohr Institute, University of Copenhagen, Juliane Maries Vej 30, 2100 Copenhagen Ø, Denmark 3 Astrophysics Research Institute, Liverpool John Moores University, IC2, Liverpool Science Park, 146 Brownlow Hill, Liverpool
L3 5RF, UK
4 Homer L. Dodge Department of Physics and Astronomy, University of Oklahoma, 440 W. Brooks, Rm 100, Norman, OK
73019-2061, USA
5 Observatories of the Carnegie Institution for Science, 813 Santa Barbara St., Pasadena, CA 91101, USA 6 Department of Physics, Florida State University, Tallahassee, FL 32306, USA
7 Carnegie Observatories, Las Campanas Observatory, 601 Casilla, La Serena, Chile 8 Department of Astronomy, University of California, Berkeley, CA 94720-3411, USA 9 European Southern Observatory, Alonso de Córdova 3107, Casilla 19, Santiago, Chile 10 INAF-Osservatorio Astronomico di Padova, vicolo dell Osservatorio 5, 35122 Padova, Italy
11 George P. and Cynthia Woods Mitchell Institute for Fundamental Physics & Astronomy, Texas A&M University, Department of
Physics, 4242 TAMU, College Station, TX 77843
12 Department of Astronomy and Astrophysics, University of California, Santa Cruz, CA 95064, USA 13 School of Physics, O’Brien Centre for Science North, University College Dublin, Belfield, Dublin 4, Ireland 14 Department of Astronomy, University of Texas, Austin, TX 78712, USA
15 Departamento de Ciencias Fisicas, Universidad Andres Bello, Avda. Republica 252, Santiago, Chile 16 Millennium Institute of Astrophysics, Chile
17 The Oskar Klein Centre, Department of Astronomy, Stockholm University, AlbaNova, 10691 Stockholm, Sweden 18 Department of Physics, University of California, Davis, CA 95616, USA
Received; accepted
ABSTRACT
We present an analysis of ultraviolet (UV) to near-infrared observations of the fast-declining Type Ia supernovae (SNe Ia) 2007on and 2011iv, hosted by the Fornax cluster member NGC 1404. TheB-band light curves of SN 2007on and SN 2011iv are characterised by∆m15(B) decline-rate values of 1.96 mag and 1.77 mag, respectively. Although they have similar decline rates, their peakB- and H-band magnitudes differ by∼ 0.60 mag and∼ 0.35 mag, respectively. After correcting for the luminosity vs. decline rate and
the luminosity vs. colour relations, the peak B-band and H-band light curves provide distances that differ by∼ 14% and∼ 9%,
respectively. These findings serve as a cautionary tale for the use of transitional SNe Ia located in early-type hosts in the quest to measure cosmological parameters. Interestingly, even though SN 2011iv is brighter and bluer at early times, by three weeks past maximum and extending over several months, itsB−Vcolour is 0.12 mag redder than that of SN 2007on. To reconcile this unusual behaviour, we turn to guidance from a suite of spherical one-dimensional Chandrasekhar-mass delayed-detonation explosion models. In this context,56Ni production depends on both the so-called transition density and the central density of the progenitor white dwarf.
To first order, the transition density drives the luminosity–width relation, while the central density is an important second-order parameter. Within this context, the differences in theB−Vcolor evolution along the Lira regime suggests the progenitor of SN 2011iv had a higher central density than SN 2007on.
Key words. supernovae: general — supernovae: individual: SN 2007on, SN 2011iv — ISM: dust, extinction
⋆ This work is based in part on observations made at the Las
Cam-panas Observatory, including the 6.5 m Magellan Telescope. It is also based in part on spectra collected at the European Organiza-tion for Astronomical Research in the Southern Hemisphere, Chile (ESO Programmes 184.D-1151, 184.D-1152, 088.D-0222, 184.D-1140, 080.A-0516, 080.C-0833); the 8.1 m Gemini-S Telescope (Program GS-2011B-Q-1); the Nordic Optical Telescope (Program 44-024); and the NASA/ESAHubble Space Telescope(GO-12592), obtained at the Space Telescope Science Institute (STScI), which is operated by the
Association of Universities for Research in Astronomy, Inc., under Na-tional Aeronautics and Space Administration (NASA) contract NAS 5-26555 (Programs GO-12298, GO-12582, GO-12592, GO-13286, and GO-13646). Swift spectroscopic observations were performed under program GI-5080130. Some of the data presented herein were obtained at the W. M. Keck Observatory, which is operated as a scientific part-nership among the California Institute of Technology, the University of California, and NASA; the observatory was made possible by the gen-erous financial support of the W. M. Keck Foundation.
1. Introduction
Type Ia supernovae are fundamental extragalactic distance indi-cators used to map out the expansion history of the Universe. In doing so, they provide an accurate estimate of the Hub-ble constant (Riess et al. 2016) and a means to study the na-ture of dark energy (e.g., Suzuki et al. 2012; Betoule et al. 2014; Narayan et al. 2016). Although details on their origin remain a mystery, SNe Ia have long been considered to arise from the ther-monuclear disruption of carbon-oxygen white dwarfs in binary star systems (Hoyle & Fowler 1960).
Today, SN Ia cosmology is no longer limited by sample size but rather by a subtle matrix of systematic errors. In or-der for future SN Ia experiments to differentiate between vari-ous static and/or time-dependent types of dark energy, models will require an improvement in the precision of SN Ia peak lu-minosity measurements to∼ 1% out toz≈ 1.0 (Albrecht et al. 2006). Contemporary SN Ia experiments achieve a precision of ∼ 5% (Barone-Nugent et al. 2012; Kelly et al. 2015). To reach percent-level distances will require a rest-frame near-infrared (NIR) SN Ia sample located in the Hubble flow where relative peculiar motions are small (Folatelli et al. 2010; Mandel et al. 2011), along with improved photometric calibrations and (ul-timately) a deeper theoretical understanding of the progenitors and explosion mechanism than currently exists.
Current efforts to improve upon the most dominant sys-tematics are focusing on the construction of homogeneous samples of low-redshift SNe Ia (e.g., Hamuy et al. 2006; Ganeshalingam et al. 2010; Stritzinger et al. 2011b), improve-ments in photometric calibration techniques (e.g., Rheault et al. 2010; Stubbs & Brown 2015), and an expanded understanding of SN Ia intrinsic colours and dust corrections (e.g., Folatelli et al. 2010; Mandel et al. 2011; Burns et al. 2014). Additional efforts to further understand SN Ia progenitor systems and their explo-sion physics are being made through, amongst others, focused studies of their ultraviolet (UV; e.g., Foley et al. 2016) and NIR properties (e.g., Hsiao et al. 2013; Diamond et al. 2015), as well as studies probing their immediate circumstellar environments (e.g., Sternberg et al. 2011; Pan et al. 2015).
Over the past 30 years, significant observational efforts have revealed the existence of multiple subclasses of SNe Ia. The first clear indication of departure from homogeneity arrived with the study of the low-luminosity SN 1986G, located in Centaurus A (e.g., Branch 1987; Phillips et al. 1987; Ashall et al. 2016b). Five years later, with the discovery of both the high-luminosity SN 1991T (Filippenko et al. 1992b; Ruiz-Lapuente et al. 1992; Phillips et al. 1992) and the low-luminosity SN 1991bg (Filippenko et al. 1992a; Leibundgut et al. 1993; Turatto et al. 1996), it became obvious that SNe Ia exhibit significant diver-sity (see, e.g., Filippenko 1997).
iPTF 13ebh (Hsiao et al. 2015), and SN 2015bp (Srivastav et al. 2017).
In this paper, we focus on the Type Ia SN 2007on and SN 2011iv, both located in the Fornax cluster member NGC 1404. Within the context of the light-curve luminosity vs. width relation characterised by the light-curve decline-rate pa-rameter∆m15(B) (Phillips 1993), these two objects are located
at the faint end of the SN Ia luminosity distribution. However, with∆m15(B) measured values of∼ 1.7–2.0 mag, along with a number of other photometric and spectroscopic properties as discussed below, SN 2007on and SN 2011iv are most akin to the transitional SN Ia iPTF 13ebh (Hsiao et al. 2015). As both SN 2007on and SN 2011iv were hosted by the same galaxy, they offer a rare opportunity to test the precision of transitional SNe Ia as distance indicators.
Here, comprehensive observations (Sect. 2) of SN 2007on and SN 2011iv are presented and studied with the intent to gain a better understanding on the nature of transitional SNe Ia and their progenitors. In Sect. 3, a detailed analysis of the photo-metric dataset is presented, including a study of their light-curve behaviour, theirB−V colour evolution, estimates of their host-galaxy reddening, as well as their 56Ni masses derived from
constructed bolometric (UV/optical/IR, hereafter UVOIR) light curves. In addition, given that both objects are very similar and located in the same galaxy, they provide an excellent opportu-nity to test the methods used to estimate their distance (Sect. 4). A detailed spectral analysis including modelling of the opti-cal maximum-light spectra of both SNe Ia is then presented in Sect. 5, followed by a discussion in Sect. 6. Our conclusions are summarised in Sect. 7.
1.1. Supernovae SN 2007on and SN 2011iv
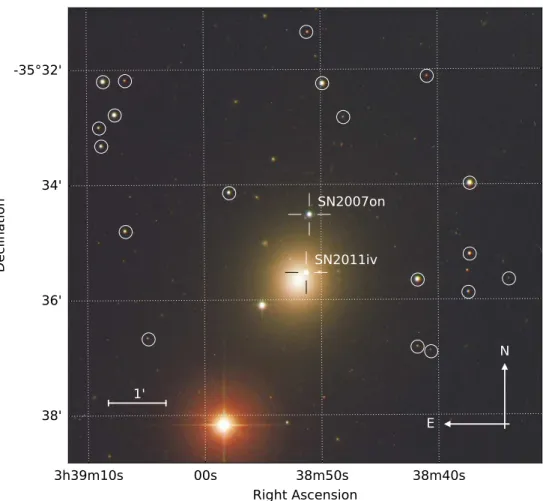
SN 2007on and SN 2011iv occurred in the Fornax clus-ter member and early-type (E1) elliptical galaxy NGC 1404 (Corwin et al. 1994), and their location along with a number of local sequence stars is presented in Figure 1. Both SNe Ia are northwest of the centre of NGC 1404 within the projected bow-shock region of the galaxy, which itself is on an infall course di-rected toward the central galaxy of the Fornax cluster, NGC 1399 (e.g., Machacek et al. 2005). Interestingly, NGC 1404 has the lowest dust to stellar flux ratio of galaxies in theKINGFISH sur-vey (Skibba et al. 2011), suggesting the absence of significant amounts of dust.
ness fluctuation (SBF) distances ranging from about 15.7 Mpc up to 22.2 Mpc (e.g., Tonry 1991; Blakeslee et al. 2009; Liu et al. 2002); as well as among others: Fundamental Plane, Planetary Nebula Luminosity Function, and Tully Fisher dis-tance estimates (see NED). Here we adopt a disdis-tance of 17.9± 2.9 Mpc (corresponding to a distance modulus ofµ = 31.27± 0.20 mag), which is consistent with the Advanced Camera for Surveys (ACSs) Fornax Cluster Survey estimate based on the half-light radii of Globular clusters (Masters et al. 2010), though with a more conservative uncertainty.
2. Observations
Detailed optical and NIR light curves of SN 2007on ob-tained by the first phase of the Carnegie Supernova Project (CSP-I, 2004–2009; Hamuy et al. 2006) were published by Stritzinger et al. (2011b), while visual-wavelength spectra ob-tained at early and late times are presented by Folatelli et al. (2013) and Maeda et al. (2010). Here we complement these ob-servations with two previously unpublished visual-wavelength spectra at +11 d and +73 d obtained with the ESO-NTT (+ EMMI: ESO Multi-Mode Instrument) and two NIR spectra with the ESO-NTT(+SOFI: Son of ISAAC). Furthermore, we present recalibrations of the spectra and updated photometry of SN 2007on computed using a more accurate measurement of the local-sequence photometry, as well a vastly improved reduction of the late-phase Gemini-South spectrum of SN 2007on.
Over the course of a second instalment of the CSP, referred to as CSP-II (2011–2015), detailed optical and NIR follow-up imaging and spectroscopy were obtained for SN 2011iv, ex-tending from−9 d to+260 d relative to the epoch of B-band maximum. Combining the CSP-II observations with five epochs of UV-optical spectroscopy obtained with the UltraViolet Opti-cal Telescope (UVOT) aboard theSwiftsatellite (Burrows et al. 2005; Roming et al. 2005) and seven epochs of Hubble Space Telescope (HST) (+ STIS: Space Telescope Imaging Spectro-graph) UV/visual-wavelength spectroscopy, and a large num-ber of additional visual-wavelength and NIR spectra obtained through various facilities, yields the most detailed datasets yet obtained for a transitional SN Ia.
2.1. Ultraviolet, optical and NIR imaging
UVuvw2-,uvm2-, anduvw1-band imaging of both SN 2007on and SN 2011iv were obtained withSwift(+UVOT). Photome-try of SN 2007on and SN 2011iv was computed following the method described in detail by Brown et al. (2014), who use the calibration published by Breeveld et al. (2011). TheSwiftUVOT images and photometry are also available as part of the Swift Optical Ultraviolet Supernova Archive (SOUSA; Brown et al. 2014). In the process of computing definitive photometry, sci-ence images of SN 2011iv were used for host-galaxy subtrac-tion of SN 2007on’s science images, while science images of SN 2007on were used for host-galaxy subtraction of SN 2011iv’s science images. Definitive UVOTuvw2-,uvm2-, anduvw1-band photometry is provided in Table 1; we note that the photometry of SN 2007on presented here supersedes the photometry pub-lished by Milne et al. (2010).
OpticalugriBV-band imaging of SN 2007on and SN 2011iv was obtained with the Henrietta Swope 1.0 m telescope (+ SITe3 direct CCD camera) located at the Las Campanas Ob-servatory (LCO). The NIR Y JH-band imaging of SN 2007on was obtained with the Swope (+RetroCam) and the Irénée du Pont 2.5 m (+WIRC: Wide Field Infrared Camera) telescopes
(Stritzinger et al. 2011b), while in the case of SN 2011iv all NIR Y JH-band imaging was taken with RetroCam attached to the Irénée du Pont telescope.
The reduction procedure applied to all imaging data is de-scribed in detail in the final CSP-I SN Ia data release (Krisciu-nas et al., in prep.). In brief, point-spread function (PSF) pho-tometry is computed differentially to a local sequence of stars in the field of NGC 1404. The optical local sequence is calibrated relative to Landolt (1992) (BV) and Smith et al. (2002) (ugri) standard-star fields observed over multiple photometric nights. The NIR J-band andH-band local sequences were calibrated relative to the Persson et al. (1998) standard stars, while theY -band local sequence was calibrated relative to standardY-band magnitudes computed using a combination of stellar atmosphere models (Castelli & Kurucz 2003) with theJ−Kscolours of the
Persson et al. standard-star catalog (Hamuy et al. 2006). Absolute optical photometry in the standard photometric system and NIR photometry in the natural photometric sys-tem of the local sequences used to compute photometry of SN 2007on and SN 2011iv are provided in Table 2 and Table 3, respectively. The accompanying uncertainties corresponding to the weighted average of the instrumental errors obtained over the various nights in which photometric standard fields were ob-served.
Prior to computing photometry of the SNe Ia, host-galaxy template subtraction was performed on each science image. Deep host-galaxy template images were obtained with the du Pont telescope under excellent seeing conditions well after the SNe Ia faded beyond the detection limit. With galaxy-subtracted science images in hand, final optical and NIR photometry of SN 2007on and SN 2011iv was computed on the CSP natu-ralsystem. The optical and NIR photometry of SN 2007on and SN 2011iv is provided in Table 4 and Table 5, respectively.2The
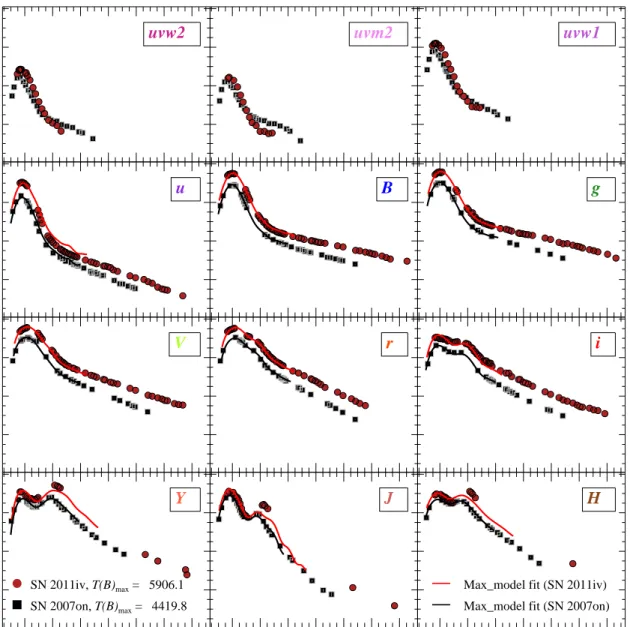
associated uncertainty of each photometric data point is com-puted by adding in quadrature of the instrumental error and the nightly zero-point error. FinalSwift UV and CSP optical and NIR light curves of SN 2007on and SN 2011iv are presented in Figure 2, including best-fit template light curves computed by
SNooPy(Burns et al. 2011).
2.2. Ultraviolet, visual-wavelength, and NIR spectroscopic observations
Multiple epochs of spectroscopy were obtained of SN 2007on and SN 2011iv with a variety of facilities; details summarising these observations are provided in Table 6 and Table 7, respec-tively.
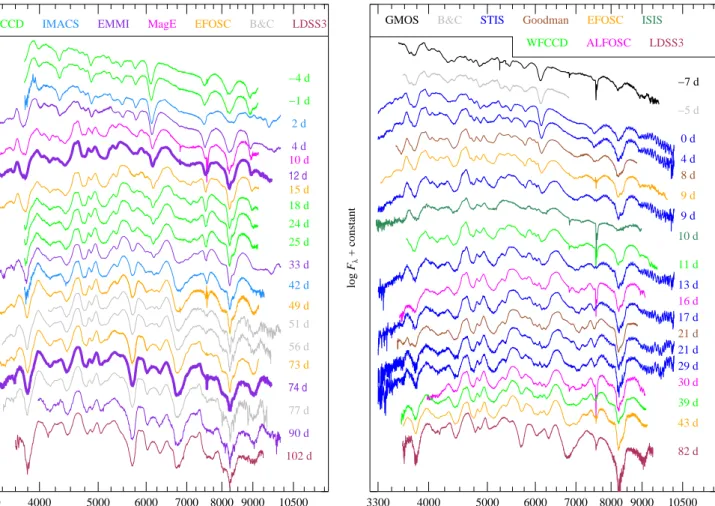
The spectroscopic time-series of SN 2007on consists of 23 epochs ranging from−4.0 d to +380 d. The early-phase spec-tra were published by Folatelli et al. (2013), while Maeda et al. (2010) presented the two oldest nebular-phase spectra. In dition to these, presented here for the first time are two ad-ditional epochs of spectra obtained with the NTT (+EMMI). These observations were conducted between+12 d and+74 d, and the data were reduced following standard procedures within the IRAF3environment. Additionally, we present two epochs of
2 Definitive photometry of the local sequence stars and the
SNe Ia is also available electronically on the CSP webpage
http://csp.obs.carnegiescience.edu/data/
3 IRAF is distributed by the National Optical Astronomy
Observato-ries, which are operated by the Association of Universities for Research in Astronomy, Inc., under cooperative agreement with the US National Science Foundation.
NIR spectroscopy also obtained with the NTT (+SOFI), and these data were reduced as described by Smartt et al. (2015).
In the case of SN 2011iv, a total of 23 epochs of visual-wavelength spectroscopy was obtained between −7 d and +276 d. In addition, twelve epochs of UV spectroscopy were procured, yielding one of the most comprehensive UV datasets yet obtained for a fast-declining SN Ia. This includes five epochs (−5 d to +1 d) taken with Swift (+UVOT; wavelength range 0.19–0.68µm) and seven epochs (ranging from−0.4 d to+29 d) taken with HST (+ STIS; wavelength range 0.18–1.023 µm; GO-12592). Additionally, 16 epochs of NIR spectroscopy of SN 2011iv were obtained between−2 d and+141 d.
Spectral data were reduced in the standard manner. Swift spectra were reduced as described by Pan et al. (in prep.),HST data reductions follow the prescription of Foley et al. (2012b), and the ground-based visual-wavelength data were reduced fol-lowing the methods described by Hamuy et al. (2006). NIR spec-troscopy obtained by the Magellan 6.5 m Baade telescope (+ FIRE; Folded Port Infrared Echellette) was reduced using the
FIREHORSEsoftware package developed by Rob Simcoe (see
Hsiao et al. 2013), while data taken with the VLT (+ISAAC: In-frared Spectrometer And Array Camera) and the NTT (+SOFI) were reduced as described by Smartt et al. (2015).
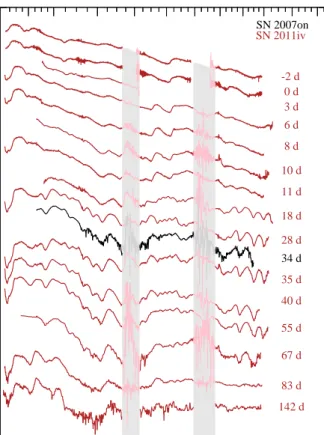
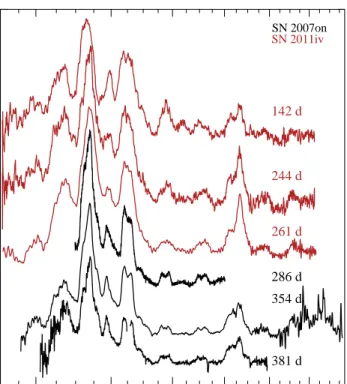
The UV spectroscopic time-series of SN 2011iv is plotted in Fig. 3 and the visual-wavelength time-series of SN 2007on and SN 2011iv are presented in Fig. 4. Figure 5 displays the NIR spectra of SN 2011iv, as well as a spectrum of SN 2007on. Finally, the late-phase visual-wavelength spectra of both SNe Ia are presented in Figure 6.
3. Photometric Analysis
3.1. Light curves
The optical light curves of both objects are well sampled around the primary maximum, and high-cadence photometry extends to ∼+80 d for SN 2007on and∼+120 d for SN 2011iv. The NIR light curves of SN 2007on are also densely sampled within the first three months of its evolution. However, the NIR light curves of SN 2011iv mainly cover the rise and fall around the primary (peak) maximum, with the secondary maximum only partially covered within a few days of its peak value. Additionally, indi-vidual NIR photometric points were obtained between+80 d and +120 d.
The optical light curves of SN 2007on and SN 2011iv ex-hibit, compared to normal SNe Ia, a relatively quick decline from maximum light. In the case of the riY JH-band light curves, a transition to a secondary maximum around 20 d past the primary maximum is apparent, which is followed by a linear decline in brightness extending to late phases (e.g., Leloudas et al. 2009).
tude in each passband,mX (whereX=u,g,r,i,B,V,Y,J,H
cor-rected for time dilation, Galactic reddening, and K corrections) we useSNooPy’s “max model” (see Stritzinger et al. 2010, Eq.
5), adopting the colour-stretch parameter,sBV.4For reasons
out-lined by Burns et al. (2014),sBVis preferred over∆m15to obtain
the aforementioned light-curve parameters in the case of fast-declining SNe Ia. The results are summarised in Table 8.
Figure 2 compares the resulting best template light-curve fits to the optical and NIR light curves. With ansBVvalue of 0.57±
0.04 for SN 2007on and 0.64±0.04 for SN 2011iv, both objects are found to evolve photometrically like fast-declining SNe Ia (i.e.,sBV.0.7 and/or∆m15&1.7 mag). This is confirmed from
direct Gaussian process spline fits to the B-band light curves of each object, yielding∆m15(B) values of 1.96±0.01 mag for
SN 2007on and 1.77±0.01 mag for SN 2011iv. The measured light-curve parameters for SN 2007on and SN 2011iv compare well with other works in the literature (e.g., Stritzinger et al. 2011b; Foley et al. 2012b; Burns et al. 2014); although specific light-curve parameter values vary, both SNe Ia are undoubtedly identified as subluminous.
Examination of the NIR light curves of both SNe Ia reveals that they peak prior to the epoch of B-band maximum. This, together with the presence of a secondary maximum, are key photometric characteristics of a normal SN Ia (Krisciunas et al. 2009). In contrast, fast-declining SN 1991bg-like SNe Ia only exhibit a single NIR maximum that peaks after the time of B-band maximum. In summary, the measured sBV values and
the spectral characteristics discussed below, indicate SN 2007on and SN 2011iv are both similar to SN 2003gs (Krisciunas et al. 2009), SN 2003hv (Leloudas et al. 2009), and iPTF 13ebh (Hsiao et al. 2015), all of which are transitional SNe Ia.
Figure 7 displays the luminosity vs. decline-rate relation parametrised by∆m15(left) andsBV(right) for an extended
sam-ple of SNe Ia observed by the CSP-I (e.g., Contreras et al. 2010; Stritzinger et al. 2011b) as well as the fast-declining SN 1986G (Phillips et al. 1987) and SN 1991bg (Filippenko et al. 1992a; Leibundgut et al. 1993; Turatto et al. 1996). Both SN 2007on and SN 2011iv are brighter than expected for typical fast-declining SNe Ia and are therefore located closer to the faint end of the luminosity decline-rate relation of normal SNe Ia.
3.2.B−V and ultraviolet colour evolution
linear decline from red to blue colours, again over the period ∼+30 d to +90 d.
AroundB-band maximum and until the SNe Ia reach their respective maximumB−V value, the colours vary in the sense that more-luminous SNe Ia exhibit bluer colours. This effect is likely tied to the56Ni production, the mixing of56Ni, and hence
the ionisation state of the ejecta (Kasen & Woosley 2007). Quan-tifying theB−V colours at maximum light (+0 d), we find val-ues ranging from∼ −0.07±0.01 mag for SN 2006dd, to be-tween∼0.01±0.01 and 0.08±0.01 mag for the transitional ob-jects, to∼0.73±0.01 mag for the SN 1991bg-like SN 2006mr. As the SNe Ia evolve beyond maximum light, the colour differ-ences become even more discrepant (see Fig. 8). The sublumi-nous SN 2006mr reaches its reddestB−V colour value already at about+10 d, while the other objects peak later, around+20 d. Beginning around+20 d and extending to beyond +85 d, the B−V colours of SN 2007on are∼0.12±0.01 mag bluer than the colours of SN 2011iv, despite SN 2007on being fainter atB -band maximum. In Sect. 6.2 we speculate that this difference is due to intrinsic variations between the progenitor’s central den-sities, and is not related to any effects of dust.
To further assess the colour evolution of SN 2007on and SN 2011iv, we examine their UV colours. We choose to use the Swift uvm2 band because it gives the highest contrast to the op-tical bands. This is because it has a sharper cutoff at the long-wavelength end of its passband as compared with theSwift uvw1 anduvw2 bands. It is therefore more sensitive to UV effects (e.g., Brown et al. 2015). Displayed in Fig. 9 are theSwift uvm2–CSP Vcolours (left panel), the CSPu−Bcolours (middle panel), and the CSPu−Vcolours (right panel) of SN 2007on and SN 2011iv. At early epochs, where there are concurrent observations begin-ning around−3 d, the UV colours (uvm2−V,u−V) of SN 2007on and SN 2011iv are quite similar, suggesting that the two objects have nearly the same conditions in their outer layers (∼ 10−3–
10−2M
⊙; see Appendix E). As the SNe Ia evolve, the UV colours
of SN 2011iv become redder at epochs past +10 d, resembling theB−Vcolour evolution.
3.3. Host-galaxy reddening
According to the NASA/IPAC Extragalactic Database (NED), the Schlafly & Finkbeiner (2011) recalibration of the Schlegel et al. (1998) dust maps suggests that the Galactic extinction component in the direction of NGC 1404 is AMWV = 0.031 mag. Adopting a Fitzpatrick (1999) reddening law characterised by RV = 3.1, this corresponds to a negligible
E(B−V)MWvalue of 0.01 mag.
Figure 10 (top panel) displays high-resolution visual-wavelength spectra of SN 2007on and SN 2011iv zoomed in on the wavelength region where NaID absorption is expected. The +5 d spectrum of SN 2007on (Sternberg et al. 2014) was obtained with the Keck-I telescope (+HIRES: High Resolution Echelle Spectrometer; Vogt et al. (1994)), and the+55 d spec-trum of SN 2011iv was obtained with the Magellan Clay tele-scope (+MIKE: Magellan Inamori Kyocera Echelle). The spec-tra of both SNe Ia exhibit very weak Galactic NaID absorption, which is consistent with the Schlegel et al. (1998) dust maps. On the other hand, no NaI D absorption components associ-ated with the host galaxy are detected, suggesting minimal to no host-galaxy reddening. An examination of the UV spectra of SN 2011iv (bottom panel of Fig. 10) reveals several narrow in-terstellar absorption lines including FeII λλ2344, 2374, 2382, 2586, and 2600, and MgIIλλ2796, 2803. Close inspection of these absorption features show that they are not associated with
material located at the redshift of the host galaxy, but rather orig-inate from material within the Milky Way located along the line of sight to NGC 1404.
Estimates of host reddening for SN 2007on and SN 2011iv are made by comparing the observed peak colours to the intrinsic peak colours as defined by a large sample of minimally reddened SNe Ia (Burns et al. 2014). UsingSNooPy’s “EBV_method2”
(see, e.g., Stritzinger et al. 2010, Eq. 6), we compute template light-curve fits that imply host-galaxy colour excess values of E(B−V)07onhost =−0.06±0.01 (random)±0.06 (systematic) mag andE(B−V)11iv
host = −0.02±0.01 (random)±0.06 (systematic)
mag, both consistent with minimal to no host reddening. Host-reddening estimates may also be obtained using the Lira relation (Lira 1996). The Lira relation is based on the empir-ical trend that theB−Vcolours of normal, minimally reddened SNe Ia evolve uniformly from+30 d to+90 d with a linear slope, and it has been found to also apply to a sample of fast-declining SNe Ia (e.g., Taubenberger et al. 2008). However, Burns et al. (2014) suggest a parameterisation of the Lira law using the colour-stretch parameter,sBV, to account for a potentially steeper
B−Vslope such as exhibited by SN 1991bg-like SNe Ia. Here we adopt the Lira-relation as parameterised by Folatelli et al. (2010), which is represented by a dashed red line in Figure 8. Comparing the offset of the observed B−V colour evolution to that of the Lira relation between+30 d and+90 d, we obtain host-galaxy colour-excess values ofE(B−V)07onLira =−0.025±0.01 (random)±0.04 (systematic) mag andE(B−V)11ivLira =0.1±0.01 (random)±0.04 (systematic) mag. In what follows, SN 2007on and SN 2011iv are assumed to have zero host-galaxy extinction.
3.4. Bolometric light curves and56Ni estimates
The exquisite observational datasets of SN 2007on and SN 2011iv enable us to construct comprehensive bolometric (UVOIR) light curves with the use of the bolometric function contained within SNooPy. The function has several different
ways to construct the bolometric light curve. In our case we adopted the so-called SED (spectral energy distribution) method. In this method the uBgVriY JH-band light curves were first fit with Gaussian process spline functions. The resultant spline functions were then used to estimate the colors of the SN on the same phases of the Hsiao et al. (2007) spectral templates5.
The spectral templates were then multiplied by an appropriate b-spline function, which ensured their synthetic colors match the observed colors. Next, flux bluewards of the atmospheric cutoff (≈3050 Å) of the spectral templates was estimated by interpo-lating to theuvm2 flux point. The total flux was then obtained by integrating from the effective wavelength of theuvm2 pass-band (≈2250 Å) to the red edge of theH band (≈18,800 Å). Finally the integrated flux was de-reddened and placed on the absolute luminosity scale using the adopted distance discussed in Sect. 1.1.
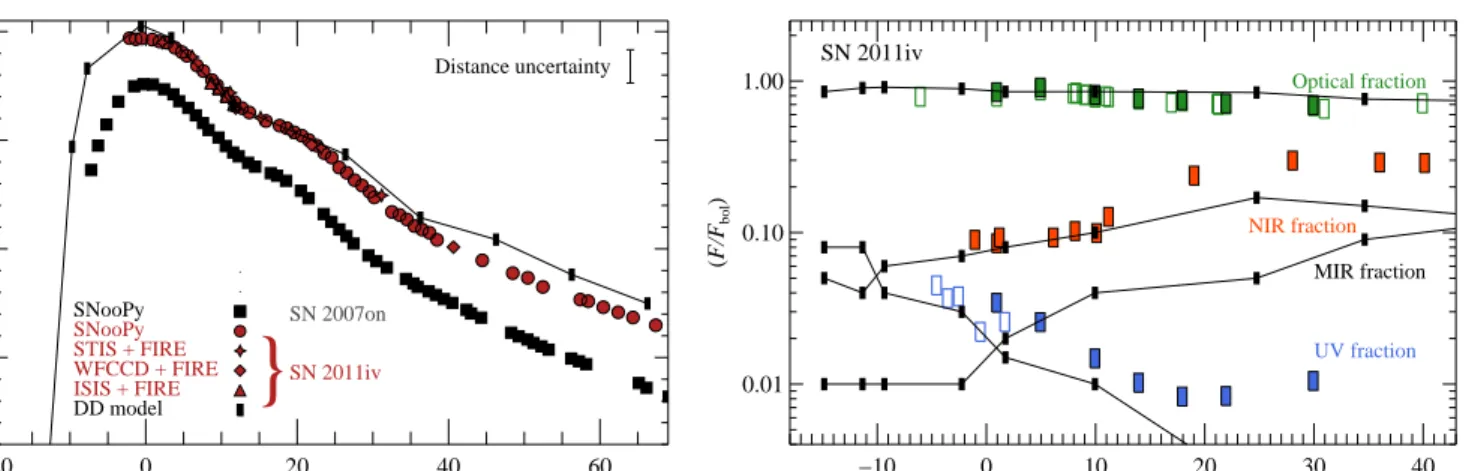
Figure 11 (left panel) displays the definitive bolometric light curves of SN 2007on and SN 2011iv and the corresponding luminosity values are listed in Table 10 and Table 11, respec-tively. The plot also shows an indication of the uncertainty in the bolometric luminosity adopting an uncertainty in the adopted distance modulus of±0.20 mag. Additionally, for SN 2011iv there are a handful of spectrophotometric bolometric points con-structed by integrating the SN Ia flux from combined UV,
opti-5 SNooPy has an updated set of spectral templates extending from
op-tical to NIR wavelengths.
cal, and NIR spectra; these are reported in Table 12. Given that the NIR spectra include the additional wavelength region cor-responding to the Ks band, the spectrophotometric bolometric
points tend to have an ever-increasing amount of luminosity rel-ative to maximum as compared to the bolometric points obtained from the photometry. The time dependence of the difference be-tween the photometric vs. spectrophotometric bolometric points reflects the increasing fraction of flux emitted at red wavelengths as the SED evolves. Also plotted in the left panel of Fig. 11 is the bolometric light curve corresponding to the best-fit DD model of SN 2011iv presented below (see Sect. 6.2 and Appendix D).
The bolometric light curves indicate that SN 2011iv is more luminous than SN 2007on at all epochs. Quantitatively, the peak luminosity obtained for SN 2007on isLmaxbol = (5.05±0.8)×1042 erg s−1, and for SN 2011iv it is Lmax
bol = (9.03±0.9)×1042 erg
s−1. The peak luminosities are used to estimate the ejected56Ni
abundance through application of Arnett’s rule (Arnett 1982). Following the method described by Stritzinger & Leibundgut (2005), and adopting the same rise time as employed for mod-elling the maximum-light optical spectra (Sect. 5.2, Fig. 15),
56Ni yields of 0.24±0.05 M
⊙and 0.43±0.06 M⊙are computed
for SN 2007on and SN 2011iv, respectively.
Given the broad wavelength coverage obtained for SN 2011iv, we show in Figure 11 (right panel) the frac-tion of the total bolometric flux in the UV, optical, and NIR regimes estimated using observed spectroscopy Clearly, the contribution from optical wavelengths (3050–8630 Å) domi-nates the total flux at all phases. At maximum brightness, the fraction of flux blueward of the atmospheric cutoff is less than 10%, while in the NIR extending from 9000 Å out to 24,900 Å, it accounts for about 10%. By a month past maximum the UV fraction drops to less than 1%, while the NIR contribution increases to about 30%. Also plotted is the fraction of flux distributed among the different wavelength regimes for the best-fit DD model of SN 2011iv, including the fraction of flux in the mid-IR (MIR).
4. Type Ia supernova distance to NGC 1404
Equipped with the optical and NIR light curves of SN 2007on and SN 2011iv, we can use them to independently ascertain the distance to their host galaxy, NGC 1404. We focus our efforts on determining the relativedifferencebetween the distances in-ferred from SN 2007on and SN 2011iv, rather than on their ab-solute distances.Assuming SN 2007on and SN 2011iv are indeed located in NGC 1404, two factors are key for explaining the difference in their observed flux: extinction owing to dust and the lumi-nosity vs. decline-rate relation (Phillips et al. 1999). To
investi-using the NIR bands. This is demonstrated in Figure 12, which shows the probability distribution of the differences in distance moduli computed for theB- andH-band peak luminosities of our two SNe after applying the luminosity vs. colour and luminosity vs. decline-rate corrections. The probability distributions of the difference in distance moduli is narrower in theHband because the corrected NIR luminosities are less sensitive to errors in the extinction correction. Quantitatively, theB-band distance modu-lus of SN 2007on is (µ0−5log10·h73)=31.37±0.024 (random)
mag, where h73 = H0/(73 km s−1 Mpc−1), and the H-band dis-tance modulus is (µ0−5log10·h73)=31.31±0.030 (random) mag.
For SN 2011iv, on the other hand, theB-band distance modulus is (µ0−5log10·h73)=31.07±0.021 mag and theH-band distance
modulus is (µ0−5log10·h73)=31.11±0.023 mag. These values
yield differences of∆µ=0.30±0.02 mag and∆µ=0.20±0.01 mag in theBband andHband, respectively (see Fig. 12). These comparisons correspond to∼14% and∼9% differences in dis-tance.
5. Spectral analysis
5.1. HST ultraviolet spectroscopy
5.1.1. Observations and spectral comparison
The UV spectrum of a SN Ia is shaped by a complex set of pro-cesses, including significant line-blanketing driven by Fe-group elements at various ionisation states (see, e.g., Mazzali 2000). The UV spectral region therefore offers an opportunity to study the56Ni and Fe-group element content located in the outer layers
of the expanding ejecta (e.g., Hoeflich et al. 1998; Lentz et al. 2000; Timmes et al. 2003; Sauer et al. 2008; Walker et al. 2012). Given the limited observational coverage to date of the UV portion of SNe Ia, we have undertaken a detailed examination of our UV spectroscopic time-series (Sect. 2.2). From Figure 3, it is evident that SN 2011iv is rich in prominent P-Cygni features, including those located at 2300 Å, 2500 Å, 2650 Å, 3000 Å, and 3200 Å, which are typically caused by Mg II, Fe II, and other Fe-group elements. The early-epoch (+0 d to+9 d) spectra also exhibit a conspicuous feature around 1900 Å. A similar feature typically attributed to FeII or CoII is also present in the nor-mal Type Ia SN 1992A (Kirshner et al. 1993) and SN 2011fe (Mazzali et al. 2014), as well as in the Type II-P SN 1999em (Bufano et al. 2009) and the Type IIb SN 2001ig (Ben-Ami et al. 2015).
Detailed modelling of SN Ia spectra points to a rather complex interplay between various physical parameters. This includes ejecta stratification (mixing), metallicity, modification of den-sity structures due to pulsations (Gerardy et al. 2004), spectral line formation and ionisation states (e.g., Hoeflich et al. 1998; Lentz et al. 2000; Mazzali et al. 2014; Sauer et al. 2008), as well as geometric and viewing-angle effects that may alter the UV flux level (e.g., Kromer & Sim 2009). In the remainder of this section, we quantify the similarities and differences between the UV properties of SN 2011iv and other normal SNe Ia.
5.1.2. UV pseudo-equivalent width
To quantify the UV spectral properties of the two prominent ab-sorption features indicated in Fig. 3 (left panel), measurements are made of their pseudo-equivalent width (pEW), which is a common method to quantify spectral properties of SNe Ia at optical wavelengths (e.g., Folatelli 2004; Garavini et al. 2007; Folatelli et al. 2013). Parameters that define the two UV pEW indicators considered here were obtained following the prescrip-tion of Garavini et al. (2007) and are summarised in Table 9. In short, the two pEW indicators are defined from the blue to the red maximum of an absorption trough.
Based on this definition, Figure 13 shows the resulting temporal evolution of the derived UV pEWs for SN 2011iv, as well as for the comparison SNe (SN 1992A, SN 2011fe, and SN 2013dy), chosen as they are representatives of normal SNe Ia with excellent UV data. Interestingly, the pEW values of SN 2011iv resemble those of SN 2011fe, while the pEW values of SN 1992A evolve similar to those of SN 2013dy. The pEW values of pW02 appear to increase until around+10 d past max-imum light, whereafter the pEW steadily declines in a similar fashion for the considered SNe Ia.
5.1.3. The 3000Åfeature
Features at longer wavelength (i.e., & 2800 Å) are formed well within the SN ejecta and are products of nuclear burn-ing (e.g., Branch & Venkatakrishna 1986; Kirshner et al. 1993; Sauer et al. 2008). Conspicuous features in this region are those around 3000 Å and 3250 Å, which are blends of FeIIor CoII (e.g., Branch & Venkatakrishna 1986). Comparing the 3000 Å absorption feature of the maximum-light spectrum of SN 2011iv (Fig. 3) with that of other SNe Ia reveals noticeable differences in its shape. SN 2011iv and SN 2011fe exhibit a broad “W-shaped” absorption trough, while in the case of SN 2013dy this feature is “V-shaped.” A V-shaped feature is also present in SN 1992A (Kirshner et al. 1993). We measured the pEW of the entire 3000 Å feature for epochs around maximum light in a similar fashion as for the other UV features and find values of about 40 Å, in agreement with measurements in the literature (e.g., Foley et al. 2008).
5.1.4. No evidence of SN Ia ejecta and circumstellar interaction.
UV observations have been used in the past to provide con-straints on interaction between the expanding SN Ia ejecta and circumstellar material (CSM). In Appendix E we discuss our ef-forts to search for evidence of interaction between the ejecta of SN 2011iv and any possibly CSM. In short, our efforts yield no evidence of interaction in the case of SN 2011iv.
5.2. Optical spectral comparison of early epochs and spectral synthesis
Unlike the UV spectral range that is distinguished by significant line blending of various Fe-group elements in the outermost lay-ers, the visual-wavelength range is characterised by a variety of broad P-Cygni profiles from single elements (see, e.g., Fig. 4). The study of these features and their temporal evolution can pro-vide clues regarding SN Ia progenitors and an avenue to con-strain the explosion physics.
Figure 14 presents a comparison between visual-wavelength spectra of SN 2007on and SN 2011iv taken around−5 d and +4 d, along with identifications for all of the prominent spectral features. Overall, the spectra are similar, and all of the main ions that characterise a SN Ia are present. However, as highlighted by the shaded regions in Fig. 14, notable spectral differences are evident at 4300–4500 Å and 4700–5200 Å. Additionally, there are some small differences in the blueshifts of the absorption minimum of the SiIIλ6355 line.
To facilitate the identification of the various spectral fea-tures observed in the early epochs of SN 2007on and SN 2011iv, and in particular, in the first two shaded regions of Figure 14, we turn to spectral synthesis modelling using well-established techniques applied to the study of numerous SNe Ia includ-ing the normal SN 2011fe (Mazzali et al. 2014) and SN 2014J (Ashall et al. 2014). Synthetic spectra are computed based on the W7 density profile (Nomoto et al. 1984), allowing for con-sistency between line identification with other models. We note that the majority of SN Ia explosion models produce similar-looking density profiles in the regions where the maximum-light spectrum is formed; the main differences are in the outermost velocities. Therefore, the results presented below are indepen-dent of whether we use a W7 density profile or that associated with our best-fit DD explosion models (see Sect. 6.2).
Our spectral synthesis calculates the radiation field above a blackbody photosphere, with element abundances, luminosity, and photospheric velocity varied to produce a best-fit spectrum (Mazzali 2000). The code uses the density profile of the “fast deflagration” single-degenerate W7 model (Nomoto et al. 1984; Iwamoto et al. 1999).
Figure 15 shows the synthetic spectral models computed for the −1.0 d spectrum of SN 2007on and the spectrum of SN 2011iv taken at maximum light. The model parameters for the premaximum spectrum of SN 2007on imply a photospheric velocityvph=9500 km s−1, a photospheric blackbody
tempera-tureTph=10,600 K, a bolometric luminosityLbol=4.80×1042 erg s−1, and a rise time to maximumt
rise=17.4 d. In the case of
the synthetic spectrum of SN 2011iv, the model parameters are vph=9500 km s−1,Tph =10,700 K,Lbol =7.03×1042erg s−1,
andtrise=17.9 d.
The models consist of spectral features attributed to many of the same ions found in the spectra of normal SNe Ia (see Fig. 15), and some of the features are produced by the blending of several ions. Prominent spectral features are attributed to var-ious ions of intermediate-mass elements including CaII H&K, SiIIλλ3856, 4130, 5972, 6355, SIIλλ5449, 5623, and the CaII NIR triplet. The prevalent feature seen around 7500 Å is domi-nated by a blend of OIλ7773, which is a characteristic of sub-luminous SN 1991bg-like SNe Ia (e.g., Garnavich et al. 2004; Taubenberger et al. 2008; Ashall et al. 2016b).
The spectral feature located at 4300–4500 Å in SN 2011iv is broader than in SN 2007on (see first shaded region in Fig. 14). The synthetic spectra of SN 2011iv have a more significant
tribution of SiIIIλ4553 and FeIIIλ4420, whereas in the case of SN 2007on this region is dominated by MgIIλ4481.
Moving to longer wavelengths, our models indicate that the prominent feature in SN 2011iv at 4700–5000 Å is formed from a blend of various SiIIand FeIIIlines, with the strongest contri-butions from SiIIλ5055 and FeIIIλ5156, and it contains only a small contribution of FeIIand SII. In the case of SN 2007on, this region in the synthetic spectrum is formed by SiIIλ5055, with some contribution from SIIλ5032 and FeIIλ5169. The dif-ferences between the spectra of SN 2007on and SN 2011iv are attributed to the latter being intrinsically hotter, which translates into it having ejecta characterised by a higher ionisation state. A full detailed spectral analysis using the abundance tomography technique will be presented in an forthcoming paper (Ashall et al., in prep.).
5.3. NIR Spectroscopy
At early epochs, the NIR spectra (see Fig. 5) of SN 2011iv are rather smooth, exhibiting only a handful of features, including the MgIIλ9218 line and an absorption dip at∼1.6µm, which is associated with the H-band break. As the spectrum evolves with time, a multitude of features attributed to Fe-group elements (such as FeII, CoII, and NiII) emerge and dominate the spec-trum, particularly at the wavelength regions corresponding to the HandKsbands. The prominent feature at∼9000 Å may be
at-tributed to a blend of MgIIλλ9218, 9244, as was identified in the transitional iPTF13ebh (Hsiao et al. 2015). At epochs beyond +10 d, the latter feature becomes broader and even more promi-nent, together with a feature located around∼ 9800 Å. These absorption troughs are likely the result of line blanketing of a large number of MgII, CaII, CoII, and FeIIlines (Hoeflich et al. 2002).
Hsiao et al. (2015) provided a detailed study of theH-band break observed in SN 2011iv, which is located right between the two major telluric regions in the NIR. In summary, the profile of theH-band break of SN 2011iv evolves differently than, say, that of iPTF13ebh, despite both objects being very similar otherwise (see Hsiao et al. 2015). The feature is weaker in strength com-pared to normal SNe Ia (see Hsiao et al. 2015, Fig. 15), though the peak of the H-band break ratio of SN 2011iv appears to fit into the correlation with the light-curve decline rate,∆m15, and
the colour-stretch parameter,sBV(Hsiao et al. 2013).
The velocities of the NIR MgIIλ9218 (Sect. B.2, Fig. B.2) feature appear to decrease consistently in SN 2011iv and are similar to those observed in the fast-declining SN 1991bg and
5.4. Nebular spectroscopy
The late-phase visual-wavelength spectra of SN 2007on and SN 2011iv provide an opportunity to assess the inner regions of SNe Ia located at the faint end of the luminosity vs. decline-rate relation. Figure 6 displays the nebular spectra of SN 2007on taken on +286 d, +353 d, and +380 d, as well as those of SN 2011iv taken on +142 d, +244 d, and+260 d. Late-phase spectra of both SNe are characterised by emission features formed by numerous blended, mostly forbidden emission lines. The strongest emission feature is around 4800 Å followed by those in the ranges 4000–4500 Å, 5100–5400 Å, and 7000–8000 Å. The 4800 Å feature is dominated by FeIIIwith weak contri-butions of FeII, while the 5000–5500 Å feature is dominated by FeIIwith contributions of FeIII(Axelrod 1980). Close inspec-tion of the spectra of SN 2007on at+353 d and+380 d reveal the existence of double-peak profiles, which were first noted by Dong et al. (2015), leading them to suggest a bi-modal56Ni
dis-tribution possibly linked to a non-standard explosion scenario. A detailed spectral synthesis study exploring this option for SN 2007on and SN 2011iv will be presented in a forthcoming publication (Mazzali et al., in preparation).
Preliminary modelling of the nebular spectra has been accomplished with a non-local-thermodynamic-equilibrium (NLTE) SN nebular code (Mazzali et al. 2007). Spectral synthe-sis suggests56Ni masses of 0.19 M
⊙produced in SN 2007on and
0.41 M⊙in SN 2011iv. These values are within∼23% and 5%
of the values computed from the peak of the UVOIR light curves of SN 2007on and SN 2011iv, respectively. We note that the two different methods to estimate the56Ni mass have an expected
scatter of∼20% (see Stritzinger et al. 2006).
6. Discussion
6.1. SN 2007on and SN 2011iv: transitional SNe Ia
lumi-iPTF13ebh (Hsiao et al. 2015), and 2007on, and the sublumi-nous Type Ia SNe 1986G (Cristiani et al. 1992) and 1991bg (Turatto et al. 1996). Examination of the spectral sequence re-veals that the normal and transitional objects exhibit spectral features related to the transition of doubly to singly ionised Fe-group elements, while the subluminous objects exhibit TiII. The strength of these features and how they vary can be understood to first order by a range in photospheric temperatures (Nugent et al. 1995). Within this framework, TiIIfeatures are present in sublu-minous SNe Ia characterised by cooler photospheres, while FeII features appear with increased temperature and luminosity, fol-lowed by even higher ionisation driven by increased tempera-tures and the emergence of FeIII. This is consistent with the lu-minosity vs. decline-rate relation (e.g., Hoeflich et al. 1996), and as explained below, it is linked to the amount of56Ni produced
during the explosion.
6.2. Model comparison
To gain a theoretically based understanding of the key dif-ferences between SN 2007on and SN 2011iv we seek guid-ance from a suite of spherical one-dimensional (1-D) delayed-detonation (DD) explosion models of Chandrasekhar-mass (MCh ≈ 1.4 M⊙) carbon-oxygen white dwarfs (Hoeflich et al.
2002). Spherical 1-D models are used as current 3-D hydrody-namical models predict significant mixing throughout the enve-lope which is inconsistent with observations (see Appendix C for discussion).
In standard DD models, a larger amount of 56Ni is
pro-duced during the detonation burning phase compared to the de-flagration burning phase (Khokhlov 1991). During the deflagra-tion phase, 0.25 to 0.30M⊙of carbon-oxygen is required to be
burned to lift the white dwarf from its gravitational potential. In spherically symmetric explosion models, this amount is con-veniently parameterised by the transition density (hereafterρtr),
which marks the density of the burning material when the lami-nar burning flame transitions from traveling at less than the local sound speed (a deflagration) to faster than the local sound speed (a detonation). During the deflagration phase, burning reaches nuclear statistical equilibrium (NSE), leading to the production of mostly iron-group elements. The abundances of isotopes de-pends on the level of neutronisation, which is specified by the electron to baryon fraction:Ye =Yp/(Yp+Yn). With increasing
central density (hereafterρc), electron capture shifts NSE away
from the production of radioactive56Ni and toward the
produc-tion of stable Fe-group elements (e.g.,58Ni). Therefore, with
in-creasingρc, the abundance of stable Fe-group elements increases
relative to56Ni, and inevitably produces a central hole in the56Ni
distribution.6
During the deflagration phase, depending on ρc,56Ni
pro-duction can range from very little up to ∼ 0.3 M⊙ (e.g., Nomoto et al. 1984; Brachwitz et al. 2000; Hoeflich et al. 2002; Diamond et al. 2015). During the detonation phase, depending on the value ofρtr,56Ni production can range from very little to
∼0.6 M⊙(Hoeflich et al. 2002). Therefore, the total production
6 Central density plays an influential role in the production of
radioac-tive56Ni; increased values lead to electron-capture rates that shift the
synthesis of elements in nuclear statistical equilibrium (NSE) away from56Ni and toward stable iron-group elements. In high-metallicity
white dwarfs, settling of22Ne in the core can also shift the NSE
abun-dances away from56Ni in the central regions, but this requires very long
evolutionary times on the order of 5+billion years (Bravo et al. 2011). Since the amount of22Ne is relatively limited, the size of the56Ni hole
is expected to account for≤0.05 M⊙(Bildsten & Hall 2001).
of56Ni in DD models can range from very little up to∼0.9 M
⊙,
with a varying distribution of56Ni within the expanding ejecta.
While in normal SNe Ia the total56Ni mass is dominated by
con-tributions from both the deflagration and detonation phases, in subluminous SNe Ia the 56Ni is produced primarily during the
deflagration phase, leading to a56Ni distribution more centrally
condensed and influenced byρc.
Within this well-established framework, the higher peak lu-minosity (and hence slower decline rate) of SN 2011iv compared to SN 2007on is attributed to having produced more56Ni, and
this in turn produced the bluer colours exhibited by SN 2011iv at early times (see Fig. 8). The dependence of temperature and lu-minosity on the56Ni mass was described decades ago by Arnett
(1982), and this relationship also drives the spectroscopic se-quence plotted in Fig. 17 (see also Nugent et al. 1995). Specif-ically, objects with smaller amounts of 56Ni will have
lower-temperature photospheres leading to the presence of TiIIlines, while higher56Ni mass objects will have hotter photospheres and
therefore higher-ionisation conditions leading to the presence of FeIIand/or FeIIIfeatures.
As demonstrated in Fig. 8, despite SN 2011iv being brighter and bluer than SN 2007on at early epochs, between +20 d and+85 d SN 2011iv appears∼ 0.12±0.01 mag redder than SN 2007on, and this behaviour is confirmed by the UV vs. opti-cal colour (see Fig. 9). This rather perplexing behaviour can be explained by the progenitor white dwarf of SN 2011iv having a largerρccompared to SN 2007on. As discussed above,
increas-ingρcleads to the production of more stable Fe-group elements
at the expense of radioactive56Ni. Less56Ni is produced in the
deflagration phase owing to the higher value ofρc. In turn, this
leads to less centrally condensed56Ni, less heating of the central
regions of the ejecta, and (consequently) redder colours at late times.
To demonstrate the influence ρc has on the B−V colour
evolution, plotted in the inset of Figure 8 is the B−V colour evolution of SN 2007on and SN 2011iv compared to that corre-sponding to the best-fit DD models (see Appendix D). At early times the models match the colours quite well, while at later times the models are steeper than observed in SN 2007on and SN 2011iv. This is largely due to forbidden lines become in-creasingly important, and the processes associated with these transitions are difficult to model because of a lack of atomic data (see, e.g., Höflich 1995; Dessart et al. 2014; Baron et al. 2015; Telesco et al. 2015; Friesen et al. 2014, 2017). Nonetheless the best-fit DD models demonstrate that with increasedρcone
ob-tains redderB−Vcolours along the Lira relation, while models with reducedρcexhibit bluerB−Vcolours. Assuming a
canon-ical value ofρc= 2×10⁹g cm−3 for SN 2011iv, aB−V color offset of 0.12 mag between models during the phases coinci-dent with the Lira relation corresponds to a model withρc= 1×
109g cm−3for SN 2007on. As shown in Hoeflich et al. (2017),
the offset is relatively stable over the period of the Lira relation for models of different brightness. We note that a similar result was also found from the detailed analysis of the low-luminosity SN 1986G (Ashall et al. 2016b).
6.3. Variations in luminosity
Tentative evidence exists that SNe Ia residing in early-type galaxies exhibit smaller Hubble scatter than SNe Ia hosted in late-type galaxies (Sullivan et al. 2003). This is thought to be driven by (i) the progenitor stars being older and spanning a smaller mass range, and (ii) dust extinction being less signif-icant in early-type hosts compared with late-type hosts. Some
high-redshift experiments have therefore been designed to target early-type galaxies in distant clusters.
With SN 2007on and SN 20011iv being both located in the same galaxy, they offer a rare opportunity to test the as-sertion that SNe Ia located in early-type hosts provide mini-mal dispersion in their peak luminosities. However, as we have shown in Sect. 4, even after correcting for colour stretch and colour (extinction), both objects exhibit significantly different peak absolute magnitudes. This is in contrast to the three normal (∆m15(B)≈1.1–1.2 mag) SNe Ia hosted in the early-type galaxy
Fornax A, whose distances were found to be consistent at the 3% level (Stritzinger et al. 2010). Therefore, the significant discrep-ancy between the distances of SN 2007on and SN 2011iv serves as a cautionary tale for the use of transitional SNe Ia located in early-type hosts in the quest to measure cosmological parame-ters. The implications of this finding are important in cosmology; for example, more than half of the SNe Ia used by Suzuki et al. (2012) to constrain the high-redshift (z > 1) end of their Hub-ble diagram are fast-declining SNe (i.e., objects best described by the SALT parameterx1 <−1, or equivalently∆m15(B)>1.4 mag).
As described above, within the context of the DDMCh
mod-els employed in this study, the56Ni production depends both on
ρcandρtr. Whileρtr is the primary driver of the luminosity vs.
decline-rate relation,ρc plays an important role for the
faster-declining SNe Ia which produce smaller amounts of radioactive
56Ni as compared to normal-luminosity SNe Ia. In SNe with the
same∆m15(B) (so-called “twins”), this secondary parameter can lead to changes in the peak brightness of 0.05 mag for normal-brightness SNe Ia, and by up to 0.7 mag in the case of twin sub-luminous SNe Ia (Hoeflich et al. 2017).
Höflich et al. (2010) studied the variation in brightness be-tween the peak and the tail (roughly the brightness at day+40) caused by variations in progenitor mass, metallicity, accretion rate, ˙M, and central density. The effects of variations inρc are
further elucidated in Figure 7 of Hoeflich et al. (2017), which shows the variation of heating from gamma-ray deposition as a function of central concentration of radioactive nickel. This more central heating in lower-ρcSNe leads to a hotter central region
and therefore bluer colours, with a variation in B−V of up to 0.2 mag. SNe of comparable central densities have similar Lira relations. The differences in SN 2007on and SN 2011iv lead to expected variations inρcof a factor of∼2 (see Sect. 6.2). For
this density variation, we expect SN 2007on would be brighter at maximum by about 0.18 mag than a model with the sameρc
of SN 2011iv. These modifications bring the distance of both SNe to within∼0.1 mag. In light of these results, our findings suggest that observations extended to at least+40 days are re-quired to break the degeneracy betweenρc and the luminosity
vs. decline-rate relation in fast-declining SNe Ia. Consequently,
– The transitional Type Ia SNe 2007on and 2011iv exhibit spectral and light-curve properties consistent with being an extension of the normal SN Ia population, and are not consistent with the observed properties of subluminous SN 1991bg-like SNe Ia.
– The difference in their peak luminosities is caused by differ-ences in their56Ni production. This drives the differences in
their B−Vcolours around maximum brightness, as well as subtle differences in their spectroscopic properties.
– The B−V colour evolution of SN 2011iv is found to tran-sition from being bluer to redder than SN 2007on between maximum brightness and several weeks later. We suggest that this behaviour is linked to the progenitor of SN 2011iv having a higherρcthan the progenitor of SN 2007on. With a
higherρc, SN 2011iv produced more stable58Ni in the
cen-tre of its ejecta, leading to the formation of a central hole in the distribution of56Ni. This ultimately leads to less
en-ergy deposition in the central region of the ejecta and hence the redder colours observed in SN 2011iv as compared with SN 2007on along the Lira relation. The colour difference of ∼ 0.12 mag suggests that ρc in SN 2011iv was a factor of
two larger than in SN 2007on.
– An analysis of the B- and H-band distance estimates of SN 2007on and SN 2011iv reveals relative differences be-tween the two objects of ∼ 14% and ∼ 9%, respectively. These differences serve as a warning in the use of transi-tional SNe Ia in future efforts to measure cosmological pa-rameters. New observational campaigns centred around low-luminosity SNe Ia should place an effort on obtaining data extending out to 2–3 months past maximum light, in order to account for luminosity discrepancies related toρcdifferences
in their progenitors.
Acknowledgements. We thank J. Silverman for useful discussions pertaining to
References
Albrecht, A., Bernstein, G., Cahn, R., et al. 2006, ArXiv Astrophysics e-prints Arnett, W. D. 1982, ApJ, 253, 785
Ashall, C., Mazzali, P., Bersier, D., et al. 2014, MNRAS, 445, 4427
Ashall, C., Mazzali, P., Sasdelli, M., & Prentice, S. J. 2016a, MNRAS, 460, 3529 Ashall, C., Mazzali, P. A., Pian, E., & James, P. A. 2016b, MNRAS, 463, 1891 Axelrod, T. S. 1980, PhD thesis, California Univ., Santa Cruz.
Baron, E., Hoeflich, P., Friesen, B., et al. 2015, MNRAS, 454, 2549
Barone-Nugent, R. L., Lidman, C., Wyithe, J. S. B., et al. 2012, MNRAS, 425, 1007
Ben-Ami, S., Hachinger, S., Gal-Yam, A., et al. 2015, ApJ, 803, 40 Betoule, M., Kessler, R., Guy, J., et al. 2014, A&A, 568, A22 Bildsten, L. & Hall, D. M. 2001, ApJ, 549, L219
Blakeslee, J. P., Jordán, A., Mei, S., et al. 2009, ApJ, 694, 556 Blondin, S., Matheson, T., Kirshner, R. P., et al. 2012, AJ, 143, 126 Brachwitz, F., Dean, D. J., Hix, W. R., et al. 2000, ApJ, 536, 934 Branch, D. 1987, ApJ, 316, L81
Branch, D., Dang, L. C., Hall, N., et al. 2006, PASP, 118, 560 Branch, D. & Venkatakrishna, K. L. 1986, ApJ, 306, L21
Bravo, E., Althaus, L. G., García-Berro, E., & Domínguez, I. 2011, A&A, 526, A26
Breeveld, A. A., Landsman, W., Holland, S. T., et al. 2011, in American Insti-tute of Physics Conference Series, Vol. 1358, American InstiInsti-tute of Physics Conference Series, ed. J. E. McEnery, J. L. Racusin, & N. Gehrels, 373–376 Brown, P. J., Baron, E., Milne, P., Roming, P. W. A., & Wang, L. 2015, ApJ, 809,
37
Brown, P. J., Breeveld, A. A., Holland, S., Kuin, P., & Pritchard, T. 2014, Ap&SS, 354, 89
Bufano, F., Immler, S., Turatto, M., et al. 2009, ApJ, 700, 1456 Burns, C. R., Stritzinger, M., Phillips, M. M., et al. 2014, ApJ, 789, 32 Burns, C. R., Stritzinger, M., Phillips, M. M., et al. 2011, AJ, 141, 19 Burrows, D. N., Hill, J. E., Nousek, J. A., et al. 2005, Space Sci. Rev., 120, 165 Calder, A. C., Plewa, T., Vladimirova, N., Lamb, D. Q., & Truran, J. W. 2004,
ArXiv Astrophysics e-prints
Castelli, F. & Kurucz, R. L. 2003, in IAU Symposium, Vol. 210, Modelling of Stellar Atmospheres, ed. N. Piskunov, W. W. Weiss, & D. F. Gray, A20 Ciaraldi-Schoolmann, F., Seitenzahl, I. R., & Röpke, F. K. 2013, A&A, 559,
A117
Contreras, C., Hamuy, M., Phillips, M. M., et al. 2010, AJ, 139, 519 Corwin, Jr., H. G., Buta, R. J., & de Vaucouleurs, G. 1994, AJ, 108, 2128 Cristiani, S., Cappellaro, E., Turatto, M., et al. 1992, A&A, 259, 63
Dessart, L., Hillier, D. J., Blondin, S., & Khokhlov, A. 2014, MNRAS, 441, 3249 Diamond, T. R., Hoeflich, P., & Gerardy, C. L. 2015, ApJ, 806, 107
Domínguez, I., Höflich, P., & Straniero, O. 2001, Nuclear Physics A, 688, 21 Dong, S., Katz, B., Kushnir, D., & Prieto, J. L. 2015, MNRAS, 454, L61 Drescher, C., Parker, S., Brimacombe, J., Noguchi, T., & Nakano, S. 2011,
Cen-tral Bureau Electronic Telegrams, 2940, 1
Fesen, R., Hoeflich, P., & Hamilton, A. 2016, in Supernova Remnants: An Odyssey in Space after Stellar Death, 115
Fesen, R. A., Hoeflich, P. A., Hamilton, A. J. S., et al. 2007, ApJ, 658, 396 Fesen, R. A., Höflich, P. A., & Hamilton, A. J. S. 2015, ApJ, 804, 140 Filippenko, A. V. 1997, ARA&A, 35, 309
Filippenko, A. V., Richmond, M. W., Branch, D., et al. 1992a, AJ, 104, 1543 Filippenko, A. V., Richmond, M. W., Matheson, T., et al. 1992b, ApJ, 384, L15 Fink, M., Kromer, M., Seitenzahl, I. R., et al. 2014, MNRAS, 438, 1762 Fitzpatrick, E. L. 1999, PASP, 111, 63
Folatelli, G. 2004, New A Rev., 48, 623
Folatelli, G., Morrell, N., Phillips, M. M., et al. 2013, ApJ, 773, 53 Folatelli, G., Phillips, M. M., Burns, C. R., et al. 2010, AJ, 139, 120 Foley, R. J., Challis, P. J., Filippenko, A. V., et al. 2012a, ApJ, 744, 38 Foley, R. J., Filippenko, A. V., & Jha, S. W. 2008, ApJ, 686, 117 Foley, R. J., Kromer, M., Howie Marion, G., et al. 2012b, ApJ, 753, L5 Foley, R. J., Pan, Y.-C., Brown, P., et al. 2016, MNRAS, 461, 1308 Friesen, B., Baron, E., Parrent, J. T., et al. 2017, MNRAS Friesen, B., Baron, E., Wisniewski, J. P., et al. 2014, ApJ, 792, 120
Gal-Yam, A., Simon, J., Klotz, A., & Rosolowsky, E. 2007, The Astronomer’s Telegram, 1263, 1
Gamezo, V. N., Khokhlov, A. M., & Oran, E. S. 2005a, ApJ, 623, 337 Gamezo, V. N., Khokhlov, A. M., & Oran, E. S. 2005b, ApJ, 623, 337 Gamezo, V. N., Khokhlov, A. M., Oran, E. S., Chtchelkanova, A. Y., &
Rosen-berg, R. O. 2003a, Science, 299, 77
Gamezo, V. N., Khokhlov, A. M., Oran, E. S., Chtchelkanova, A. Y., & Rosen-berg, R. O. 2003b, Science, 299, 77
Ganeshalingam, M., Li, W., Filippenko, A. V., et al. 2010, ApJS, 190, 418 Garavini, G., Folatelli, G., Nobili, S., et al. 2007, A&A, 470, 411
Garnavich, P. M., Bonanos, A. Z., Krisciunas, K., et al. 2004, ApJ, 613, 1120 Gerardy, C. L., Hoeflich, P., Fesen, R. A., et al. 2004, ApJ, 607, 391
Graham, A. W., Colless, M. M., Busarello, G., Zaggia, S., & Longo, G. 1998, A&AS, 133, 325
Hachinger, S., Mazzali, P. A., & Benetti, S. 2006, MNRAS, 370, 299
Hachinger, S., Mazzali, P. A., Tanaka, M., Hillebrandt, W., & Benetti, S. 2008, MNRAS, 389, 1087
Hamuy, M., Folatelli, G., Morrell, N. I., et al. 2006, PASP, 118, 2 Hoeflich, P. 2006, Nuclear Physics A, 777, 579
Hoeflich, P., Gerardy, C. L., Fesen, R. A., & Sakai, S. 2002, ApJ, 568, 791 Hoeflich, P., Hsiao, E. Y., Ashall, C., et al. 2017, ApJ, 846, 58
Hoeflich, P., Khokhlov, A., Wheeler, J. C., et al. 1996, ApJ, 472, L81 Hoeflich, P., Wheeler, J. C., & Thielemann, F. K. 1998, ApJ, 495, 617 Höflich, P. 1995, ApJ, 443, 89
Höflich, P. 2006, Nuclear Physics A, 777, 579
Höflich, P., Gerardy, C. L., Nomoto, K., et al. 2004, ApJ, 617, 1258 Höflich, P., Krisciunas, K., Khokhlov, A. M., et al. 2010, ApJ, 710, 444 Hoyle, F. & Fowler, W. A. 1960, ApJ, 132, 565
Hristov, B., Collins, D. C., Hoeflich, P., & Weatherford, C. 2016, in American Astronomical Society Meeting Abstracts, Vol. 227, American Astronomical Society Meeting Abstracts, 237.16
Hsiao, E. Y., Burns, C. R., Contreras, C., et al. 2015, A&A, 578, A9 Hsiao, E. Y., Conley, A., Howell, D. A., et al. 2007, ApJ, 663, 1187 Hsiao, E. Y., Marion, G. H., Phillips, M. M., et al. 2013, ApJ, 766, 72 Iwamoto, K., Brachwitz, F., Nomoto, K., et al. 1999, ApJS, 125, 439 Kasen, D. & Woosley, S. E. 2007, ApJ, 656, 661
Kelly, P. L., Filippenko, A. V., Burke, D. L., et al. 2015, Science, 347, 1459 Khokhlov, A. M. 1991, A&A, 245, 114
Khokhlov, A. M. 2000, ArXiv Astrophysics e-prints
Khokhlov, A. M., Oran, E. S., & Wheeler, J. C. 1997, ApJ, 478, 678 Kirshner, R. P., Jeffery, D. J., Leibundgut, B., et al. 1993, ApJ, 415, 589 Krisciunas, K., Marion, G. H., Suntzeff, N. B., et al. 2009, AJ, 138, 1584 Kromer, M. & Sim, S. A. 2009, MNRAS, 398, 1809
Landolt, A. U. 1992, AJ, 104, 372
Leibundgut, B., Kirshner, R. P., Phillips, M. M., et al. 1993, AJ, 105, 301 Leloudas, G., Stritzinger, M. D., Sollerman, J., et al. 2009, A&A, 505, 265 Lentz, E. J., Baron, E., Branch, D., Hauschildt, P. H., & Nugent, P. E. 2000, ApJ,
530, 966
Lira, P. 1996, Master’s thesis, MS thesis. Univ. Chile (1996)
Lisewski, A. M., Hillebrandt, W., Woosley, S. E., Niemeyer, J. C., & Kerstein, A. R. 2000, ApJ, 537, 405
Liu, M. C., Graham, J. R., & Charlot, S. 2002, ApJ, 564, 216 Livne, E. 1999, ApJ, 527, L97
Livne, E. & Arnett, D. 1995, ApJ, 452, 62
Livne, E., Asida, S., & Hoeflich, P. 2005, ApJ, 632, 443
Loewenstein, M., Mushotzky, R. F., Tamura, T., et al. 1994, ApJ, 436, L75 Machacek, M., Dosaj, A., Forman, W., et al. 2005, ApJ, 621, 663 Maeda, K., Benetti, S., Stritzinger, M., et al. 2010, Nature, 466, 82 Mandel, K. S., Narayan, G., & Kirshner, R. P. 2011, ApJ, 731, 120 Masters, K. L., Jordán, A., Côté, P., et al. 2010, ApJ, 715, 1419 Mazzali, P. A. 2000, A&A, 363, 705
Mazzali, P. A., Foley, R. J., Deng, J., et al. 2007, ApJ, 661, 892
Mazzali, P. A., Sullivan, M., Hachinger, S., et al. 2014, MNRAS, 439, 1959 Milne, P. A., Brown, P. J., Roming, P. W. A., et al. 2010, ApJ, 721, 1627 Morrell, N., Folatelli, G., & Stritzinger, M. 2007, Central Bureau Electronic
Telegrams, 1131, 1
Motohara, K., Maeda, K., Gerardy, C. L., et al. 2006, ApJ, 652, L101 Narayan, G., Rest, A., Tucker, B. E., et al. 2016, ApJS, 224, 3 Niemeyer, J., Hillebrandt, W., & E., W. S. 1996, ApJ, 471 Niemeyer, J. C. & Hillebrandt, W. 1995a, ApJ, 452, 779 Niemeyer, J. C. & Hillebrandt, W. 1995b, ApJ, 452, 769
Noguchi, T., Nakano, S., Chen, J., et al. 2011, Central Bureau Electronic Tele-grams, 2940, 1
Nomoto, K., Thielemann, F.-K., & Yokoi, K. 1984, ApJ, 286, 644
Nugent, P., Phillips, M., Baron, E., Branch, D., & Hauschildt, P. 1995, ApJ, 455, L147
Nugent, P. E., Sullivan, M., Cenko, S. B., et al. 2011, Nature, 480, 344 Pan, Y.-C., Foley, R. J., Kromer, M., et al. 2015, MNRAS, 452, 4307 Pastorello, A., Mazzali, P. A., Pignata, G., et al. 2007, MNRAS, 377, 1531 Penney, R. & Hoeflich, P. 2014, ApJ, 795, 84
Persson, S. E., Murphy, D. C., Krzeminski, W., Roth, M., & Rieke, M. J. 1998, AJ, 116, 2475
Phillips, M. M. 1993, ApJ, 413, L105
Phillips, M. M., Lira, P., Suntzeff, N. B., et al. 1999, AJ, 118, 1766 Phillips, M. M., Phillips, A. C., Heathcote, S. R., et al. 1987, PASP, 99, 592 Phillips, M. M., Simon, J. D., Morrell, N., et al. 2013, ApJ, 779, 38 Phillips, M. M., Wells, L. A., Suntzeff, N. B., et al. 1992, AJ, 103, 1632 Plewa, T., Calder, A. C., & Lamb, D. Q. 2004, ApJ, 612, L37
Pollas, C. & Klotz, A. 2007, Central Bureau Electronic Telegrams, 1121, 1 Reinecke, M., Hillebrandt, W., & Niemeyer, J. C. 1999, A&A, 347, 739 Remming, I. S. & Khokhlov, A. M. 2014, ApJ, 794, 87
Rheault, J.-P., DePoy, D. L., Behm, T. W., et al. 2010, in Proc. SPIE, Vol. 7735, Ground-based and Airborne Instrumentation for Astronomy III, 773564 Riess, A. G., Macri, L. M., Hoffmann, S. L., et al. 2016, ArXiv e-prints
Roelofs, G., Bassa, C., Voss, R., & Nelemans, G. 2008, MNRAS, 391, 290 Roming, P. W. A., Kennedy, T. E., Mason, K. O., et al. 2005, Space Sci. Rev.,
120, 95
Röpke, F. K., Hillebrandt, W., Niemeyer, J. C., & Woosley, S. E. 2006, A&A, 448, 1
Ruiz-Lapuente, P., Cappellaro, E., Turatto, M., et al. 1992, ApJ, 387, L33 Sauer, D. N., Mazzali, P. A., Blondin, S., et al. 2008, MNRAS, 391, 1605 Schlafly, E. F. & Finkbeiner, D. P. 2011, ApJ, 737, 103
Schlegel, D. J., Finkbeiner, D. P., & Davis, M. 1998, ApJ, 500, 525 Skibba, R. A., Engelbracht, C. W., Dale, D., et al. 2011, ApJ, 738, 89 Smartt, S. J., Valenti, S., Fraser, M., et al. 2015, A&A, 579, A40 Smith, J. A., Tucker, D. L., Kent, S., et al. 2002, AJ, 123, 2121
Srivastav, S., Anupama, G. C., Sahu, D. K., & Ravikumar, C. D. 2017, MNRAS, 466, 2436
Steer, I., Madore, B. F., Mazzarella, J. M., et al. 2017, AJ, 153, 37 Sternberg, A., Gal-Yam, A., Simon, J. D., et al. 2011, Science, 333, 856 Sternberg, A., Gal-Yam, A., Simon, J. D., et al. 2014, MNRAS, 443, 1849 Stritzinger, M., Burns, C. R., Phillips, M. M., et al. 2010, AJ, 140, 2036 Stritzinger, M. & Leibundgut, B. 2005, A&A, 431, 423
Stritzinger, M., Mazzali, P. A., Sollerman, J., & Benetti, S. 2006, A&A, 460, 793 Stritzinger, M., Morrell, N., & Foley, R. J. 2011a, Central Bureau Electronic
Telegrams, 2940, 3
Stritzinger, M. D., Phillips, M. M., Boldt, L. N., et al. 2011b, AJ, 142, 156 Stritzinger, M. D., Valenti, S., Hoeflich, P., et al. 2015, A&A, 573, A2 Stubbs, C. W. & Brown, Y. J. 2015, Modern Physics Letters A, 30, 1530030 Sullivan, M., Ellis, R. S., Aldering, G., et al. 2003, MNRAS, 340, 1057 Suzuki, N., Rubin, D., Lidman, C., et al. 2012, ApJ, 746, 85
Taubenberger, S., Hachinger, S., Pignata, G., et al. 2008, MNRAS, 385, 75 Telesco, C. M., Höflich, P., Li, D., et al. 2015, ApJ, 798, 93
Timmes, F. X., Brown, E. F., & Truran, J. W. 2003, ApJ, 590, L83 Tonry, J. L. 1991, ApJ, 373, L1
Turatto, M., Benetti, S., Cappellaro, E., et al. 1996, MNRAS, 283, 1 Uenishi, T., Nomoto, K., & Hachisu, I. 2003, Nuclear Physics A, 718, 623 Vogt, S. S., Allen, S. L., Bigelow, B. C., et al. 1994, in Proc. SPIE, Vol. 2198,
Instrumentation in Astronomy VIII, ed. D. L. Crawford & E. R. Craine, 362 Voss, R. & Nelemans, G. 2008, Nature, 451, 802
Walker, E. S., Hachinger, S., Mazzali, P. A., et al. 2012, MNRAS, 427, 103 Yoon, S.-C. & Langer, N. 2004, in Cosmic explosions in three dimensions, ed.
P. Hoeflich, P. Kumar, & J. C. Wheeler, 94
Yoon, S.-C., Langer, N., & Scheithauer, S. 2004, A&A, 425, 217
SN2011iv
SN2007on
1'
N
E
3h39m10s
00s
38m50s
38m40s
-35°32'
34'
36'
38'
Right Ascension
De
cli
na
tio
n
Fig. 1: Composite image of NGC 1404 with the positions of SN 2007on, SN 2011iv, and a number of local sequences stars indicated.