Multidestination travel: a critical theoretical approach and empirical evidence for the case of Brazil
166
0
0
Texto completo
(2)
(3) Tesis Doctoral. Título: MULTIDESTINATION TRAVEL: A CRITICAL THEORETICAL APPROACH AND EMPIRICAL EVIDENCE FOR THE CASE OF BRAZIL. Autor: Glauber Eduardo de Oliveira Santos. Directores: Vicente Ramos Mir. Javier Rey-Maquieira Palmer. _____________________________. _____________________________. Programa Oficial: Economía del Turismo y del Medio Ambiente Universitat de les Illes Balears 2012.
(4) ii.
(5) Acknowledgements. I would like to express my gratitude to my supervisors, Vicente Ramos Mir and Javier Rey-Maquieira Palmer, whose support, insights, criticisms and guidance were essential to the development of this thesis. I also recognize the important role played by the professors of the Master in Tourism and Environmental Economics of the University of the Balearic Islands. Their lectures and ideas were of great value to my professional and personal development. I acknowledge the financial support I received from the “Càtedra Sol Meliá d’Estudis Turistics” and the leave of absence conceded by the Federal Institute of Education, Science and Technology of São Paulo. I also acknowledge the provision of data from the Foundation Institute of Economic Research and the Tourism Ministry of Brazil. I am profoundly indebted of Professor Wilson Abrahão Rabahy, who introduced me to the study of tourism economics and provided me enormous support since then. Finally, my special thanks to my wife, parents and friend for their patience and encouragement.. iii.
(6) iv.
(7) Abstract. Multidestination tourism trips (MTTs) can be defined as a single tourism trip in which more than one destination is visited. Regarding the academic literature on MTTs, three main lacks are studied in this thesis. First, economic theoretical models of tourist choices developed hitherto are insufficient to explain MTTs consumption. On one hand, traditional microeconomic models of tourist choices, such as Morley (1992) and Stabler, Papatheodorou and Sinclair (2010), were developed within the single destination paradigm, overlooking the possibility of tourists choosing to visit multiple destinations in a single trip. On the other hand, available economic theoretical models of consumer choices within the MTT paradigm, such as Rugg (1973) and Tussyadiah, Kono and Morisugi (2006), were based on the Lancaster (1966) characteristics theory. However, two important criticisms can be made to this approach. Lancaster’s theory does not allow for the consideration of singularities, overlooking the importance of uniqueness of tourist destinations. Besides, Lancaster’s theory seems to add unnecessary issues to the discussion. Characteristics are argued to be an unrequired concept to explain why people have interest in visiting more than one destination in a single trip. Therefore, an alternative theoretical model for consumers’ choices in the MTT paradigm based on the traditional economic theory is presented in this thesis. Some particularities of the traditional model regarding MTT are discussed, such as the proper shape of utility functions, special transport costs and the existence of two budget constraints. The model shows that the MTT paradigm may unfold special demand effects as compared with the single destination paradigm. Negative income effects may be experienced by destinations considered as normal goods, and positive price effects may be experience by non-Giffen destinations. Second, despite of the relatively large theoretical literature on the determinants of MTTs consumption, a few studies had analysed this topic from an empirical perspective. The most relevant studies in this field are those conducted by Tideswell and Faulkner (1999, 2003) and Nicolau and Más (2005). This thesis develops an empirical analysis of the individual determinants of MTTs consumption, assessing theoretical propositions and empirical findings of previous studies. Inbound tourism in Brazil is. v.
(8) empirically studied. The earlier set of explanatory variables is extended to include some additional determinants, such as education level, type of accommodation and season. The time evolution of the dependent variable is also assessed. A censored zero-inflated negative binomial model is employed in order to overcome some econometric deficiencies of previous studies. The findings enlighten theoretical conflicting arguments proposed in the literature, especially those regarding the effect of monetary and time constraints. A qualitative difference between single and multiple destination trips was found. Hence, tourists’ decisions to take single or multiple destination trips are shown to be different and somehow detached from the decision of how many destinations to visit. Third, tourists’ lengths of stay at different locations of a multidestination trip are studied. The determinants of this variable was examined through a shared heterogeneity duration model where the set of independent variables included individuals’ characteristics, travels’ attributes, characteristics and identification of visited destinations and a set of dummy variables to capture variations over time. Five main conclusions were derived. First, several relevant empirical evidences about the effects of explanatory variables were provided. Some findings of earlier studies were confirmed and some were contradicted. Some examples of diverging results are those regarding the estimated effects of income, party size and previous visits to the destination. Income was not found to be a significant determinant of tourists’ length of stay within the MTTs paradigm in the Brazilian case. The length of stay was found to follow a convex function of party size. Tourists who visit Brazil for the first time are expected to stay shorter than those who are repeating their visits, while additional previous trips for repeaters have a negative effect on the expected length of stay. Second, the increasing trend of international tourists’ lengths of stay at Brazilian destinations was proved to be caused by changes in the composition of the inbound tourism flow. Third, the average length of stay was found to vary across regions and states, pointing out destinations that might be used as benchmarks for tourism management. Tourists’ length of stay was also found to vary according to some destinations’ characteristics. Fourth, positively skewed density distributions of tourists’ length of stay were found to be appropriate. Finally, shared heterogeneity across observations statistically improves the explanatory capacity of duration models when multidestination tourism trips data is analysed.. vi.
(9) Resumen. Los viajes de turismo a multidestinos (MTTs) pueden ser definidos como un viaje en que se visita más de un destino. La presente tesis estudia tres omisiones principales de la literatura académica sobre MTTs. En primer lugar, los modelos económicos teóricos de las elecciones de los turistas desarrollados hasta ahora son insuficientes para explicar el consumo de MTTs. De un lado, los modelos microeconómicos teóricos de las elecciones de los turistas, como Morley (1992) y Stabler, Papatheodorou y Sinclair (2010), se basan en el paradigma de viajes a destinos únicos, pasando por alto la posibilidad de que los turistas visiten múltiples destinos en un único viaje. De otro lado, los modelos económicos teóricos de las elecciones de los turistas basados en el paradigma de MTTs, como Rugg (1973) y Tussyadiah, Kono y Morisugi (2006), están basados en la teoría de las características de Lancaster (1966). Dos importantes críticas pueden ser hechas a ese enfoque. La teoría de Lancaster no permite la consideración de singularidades, pasando por alto la importancia de las peculiaridades de los destinos turísticos. Además, la teoría de Lancaster parece añadir problemas innecesarios a la discusión. Las características no son un concepto necesario para explicar por qué las personas tienen interés en visitar más de un destino en un viaje. Así, en esta tesis se desarrolla un modelo teórico alternativo de las elecciones de los turistas en el paradigma de MTTs y con base en la teoría económica tradicional. Algunas particularidades del enfoque económico tradicional aplicado a las MTTs son discutidas, como la forma adecuada de las funciones de utilidad, especificidades de los costes de transporte y la existencia de dos restricciones presupuestarias. El modelo revela que el paradigma de MTTs puede presentar efectos especiales en la demanda comparado al paradigma de viajes a destinos únicos. Efectos renta negativos pueden ocurrir para destinos considerados como bienes normales, y efectos positivos del precio pueden ocurrir para destinos que no son bienes de Giffen. En segundo lugar, a pesar de que la literatura teórica sobre los determinantes del consumo de MTTs es relativamente extensa, pocos estudios examinaron ese tema desde una perspectiva empírica. Los estudios más relevantes en ese campo son Tideswell y Faulkner (1999, 2003) y Nicolau y Más (2005). La presente tesis desarrolla un estudio empírico de los determinantes individuales del consumo de MTTs, examinando proposiciones teóricas y resultados empíricos de estudios anteriores. El turismo receptivo internacional de Brasil es estudiado empíricamente. El conjunto de variables explicativas utilizado por estudios anteriores es ampliado para incluir determinantes adicionales, como el nivel de educación, el tipo de alojamiento y la. vii.
(10) estación del año. La evolución de la variable dependiente en el tiempo también es examinada. Un modelo binomial negativo cero-inflado censurado es utilizado para superar algunas deficiencias econométricas de estudios anteriores. Los resultados aclaran argumentos teóricos conflictivos propuestos en la literatura, especialmente los relacionados al efecto de las restricciones presupuestarias de renta y tiempo. Se halla una diferencia cualitativa entre viajes de destinos únicos y viajes multidestino. Por tanto, se evidencia que la decisión de los turistas de consumir uno u otro tipo de viaje es diferente, y en cierto modo independiente de la decisión de cuantos destinos visitar. En tercer lugar, se estudia el tiempo de estancia de los turistas en diferentes localidades en viajes de multidestino. Los determinantes de esa variable son estudiados por medio de un modelo de duración con heterogeneidad compartida donde el conjunto de variables independientes incluye características de los individuos, atributos del viaje, características y la identidad de la destinación y un conjunto de variables dummy para captar variaciones temporales. Cinco conclusiones principales son alcanzadas. Primero, son obtenidas diversas evidencias empíricas sobre los efectos de variables explicativas. Algunos resultados de estudios anteriores son confirmados y otros son desmentidos. Algunos ejemplos de resultados novedosos son los relacionados con los efectos de la renta, tamaño del grupo de viaje y viajes anteriores al destino. El efecto de la renta sobre la duración de la estancia de los turistas en los destinos dentro del paradigma de MTTs fue estimado como no significante para el caso brasileño. Los resultados muestran que la duración de la estancia sigue una función convexa del tamaño del grupo de viaje. Es esperado que los turistas que visitan Brasil por la primera vez tengan estancias más cortas que los que repiten la visita al país. Visitas anteriores adicionales para los turistas que ya han visitado Brasil tienen un efecto negativo sobre la duración esperada de la estancia. En segundo lugar, se comprobó que la tendencia creciente de la duración de la estancia de turistas internacionales en los destinos brasileños fue causada por variaciones en la composición del flujo receptivo internacional de turistas. En tercer lugar, se comprobó que la duración media de la estancia varía entre regiones y estados. Eso permite la identificación de destinos que pueden ser considerados benchmarks para la gestión del turismo en otros destinos. También se comprobó que la duración de la estancia de los turistas varía según las características de los destinos. En cuarto lugar, se verifico que las distribuciones de densidad de la duración de la estancia de los turistas con asimetría positiva son las más adecuadas. Finalmente, se comprobó que la heterogeneidad compartida entre observaciones mejora estadísticamente la capacidad explicativa de los modelos de duración cuando se utilizan datos de MTTs.. viii.
(11) Table of Contents. 1 INTRODUCTION.................................................................................................................. 1 1.1 Research objectives............................................................................................................. 6 1.2 Previous literature on MTTs ............................................................................................ 8 1.2.1 Descriptive studies ............................................................................................................................ 8 1.2.2 Cumulative attraction ................................................................................................................... 12 1.2.3 Theoretical approaches................................................................................................................ 13 1.2.4 Empirical modelling studies ....................................................................................................... 16. 1.3 Previous literature on tourists’ length of stay ....................................................... 17 1.4 Data source for empirical studies ............................................................................... 24 1.5 Inbound tourism in Brazil ............................................................................................. 26 2 A MICROECONOMIC MODEL OF MULTIDESTINATION TOURISM TRIPS ...... 37 2.1 Description of the model .....................................¡Error! Marcador no definido. 2.2 Transport alternatives .........................................¡Error! Marcador no definido. 2.3 Particularities of preferences ............................¡Error! Marcador no definido. 2.4 Particularities of budget constraints ..............¡Error! Marcador no definido. 2.5 Simplified two-destination model ...................¡Error! Marcador no definido. 2.6 Simplified model solution ...................................¡Error! Marcador no definido. 2.6.1 Changes in the budget restriction .............................¡Error! Marcador no definido. 2.6.2 Trip specific problems .....................................................¡Error! Marcador no definido. 2.6.3 Critical points (CPs) .........................................................¡Error! Marcador no definido. 2.6.4 Tourism budget changes................................................¡Error! Marcador no definido. 2.6.5 Transport generalized cost changes ........................¡Error! Marcador no definido. 2.6.6 Cost of stay changes .........................................................¡Error! Marcador no definido.. 2.7 Conclusion ................................................................¡Error! Marcador no definido. 3 DETERMINANTS OF MULTIDESTINATION TOURISM TRIPS IN BRAZIL ....... 69 3.1 Determinants of MTTs consumption ........................................................................ 71 3.1.1 Transport costs................................................................................................................................. 71 3.1.2 Budget restrictions ......................................................................................................................... 72 3.1.3 Preferences ......................................................................................................................................... 74. 3.2 Modelling consumers’ choices of MTTs ................................................................... 78. ix.
(12) 3.2.1 Estimation method .........................................................................................................................81 3.2.2 Results...................................................................................................................................................83. 3.3 Conclusion ............................................................................................................................ 91 4 LENGTH OF STAY AT MULTIPLE DESTINATIONS OF A TOURISM TRIP ........ 97 4.1 Previous modelling studies about tourists’ length of stay ............................. 102 4.2 Duration models and tourists’ length of stay ...................................................... 107 4.2.1 Heterogeneity in duration models ........................................................................................ 113 4.2.2 Advantages and disadvantages of duration models .................................................... 116 4.2.3 Tourists’ length of stay with duration models ................................................................ 117. 4.3 Determinants of tourists’ length of stay ................................................................ 122 4.3.1 Individuals’ characteristics ...................................................................................................... 123 4.3.2 Travel characteristics................................................................................................................. 127 4.3.3 Destination characteristics and tourists perceptions ................................................. 130 4.3.4 Prices and expenditure .............................................................................................................. 132. 4.4 Empirical analysis of tourists’ length of stay in Brazil ..................................... 134 4.5 Conclusion ......................................................................................................................... 150 5 CONCLUSION .................................................................................................................. 159 APPENDIX ............................................................................................................................ 165 Appendix 1: Number of destinations visited by other relevant variables ........ 165 Appendix 2: BITS’ questionnaire ...................................................................................... 169 Appendix 3: Estimated parameters of tourists’ length of stay for states .......... 171 Appendix 4: Estimated parameters of tourists’ length of stay for states .......... 173. x.
(13) List of Tables. Table 1: Summary of modelling studies on tourists’ length of stay .......................................... 19 Table 2: Sample size of the BITS by year ............................................................................................. 25 Table 3: Brazilian inbound tourist flows according to the origin (2011) ............................... 27 Table 4: Distribution of inbound trips by number of destinations visited ............................. 29 Table 5: Summary of possible discrete jumps in the consumption of xd¡Error! Marcador no definido. Table 6: Distribution of tourists according to the number of destinations visited ............. 79 Table 7: Coefficients estimates ................................................................................................................ 84 Table 8: Summary statistics of estimated models......................................................................... 141 Table 9: Model estimates – Individuals’ characteristics ............................................................. 142 Table 10: Model estimates – Trips’ attributes ................................................................................ 145 Table 11: Model estimates – Destinations, year and constants ............................................... 149. xi.
(14) xii.
(15) List of Figures. Figure 1: International tourist arrivals from 1950 to 2011 ........................................................... 2 Figure 2: Schematic representations of Oppermann’s itinerary patterns ................................ 9 Figure 3: Representation of the characteristics approach............................................................ 14 Figure 4: Gateways surveyed by the BITS ........................................................................................... 25 Figure 5: Evolution of international tourism receipts in Brazil.................................................. 28 Figure 6: Concave indifference curves...................................... ¡Error! Marcador no definido. Figure 7: Convex indifference curves allowing for corner solutions¡Error! Marcador no definido. Figure 8: Total tourism consumption utility function with discrete jumps................. ¡Error! Marcador no definido. Figure 9: Effective consumption set given two resources constraints¡Error!. Marcador. no definido. Figure 10: Effective budget constraint when budget lines cross¡Error!. Marcador. no. definido. Figure 11: Budget constraint with transport costs.............. ¡Error! Marcador no definido. Figure 12: Alternative transport network configurations ¡Error! Marcador no definido. Figure 13: Increase of the tourism budget .............................. ¡Error! Marcador no definido. Figure 14: Decrease of the cost of stay at destination 1 .... ¡Error! Marcador no definido. Figure 15: Negative additional transport generalized cost required to visit a second destination ..................................................................... ¡Error! Marcador no definido. Figure 16: Tourism budget increase at a CP1 ........................ ¡Error! Marcador no definido. Figure 17: Tourism budget increase at a CP2 ........................ ¡Error! Marcador no definido. Figure 18: Tourism budget increase at a CP4 ........................ ¡Error! Marcador no definido. Figure 19: Demand for xd and m as functions of VMTT ........ ¡Error! Marcador no definido. Figure 20: Cost of stay at destination 1 increase at a CP1 ¡Error! Marcador no definido. Figure 21: Cost of stay at destination 1 increase at a CP2 ¡Error! Marcador no definido. Figure 22: Cost of stay at destination 1 increase at a CP3 ¡Error! Marcador no definido. Figure 23: Cost of stay at destination 1 increase at a CP4 ¡Error! Marcador no definido. Figure 24: Summary of CPs and outcomes following continuous decreases of p1 .... ¡Error! Marcador no definido.. xiii.
(16) Figure 25: Possible demand functions for xd and m with respect to p1¡Error! Marcador no definido. Figure 26: Average length of stay evolution of inbound tourists in Brazil and at Brazilian destinations............................................................................................................................. 100 Figure 27: Survival distribution of tourists in Brazilian destinations ................................... 135 Figure 28: Hazard distribution of tourists in Brazilian destinations ..................................... 136. xiv.
(17) xv.
(18)
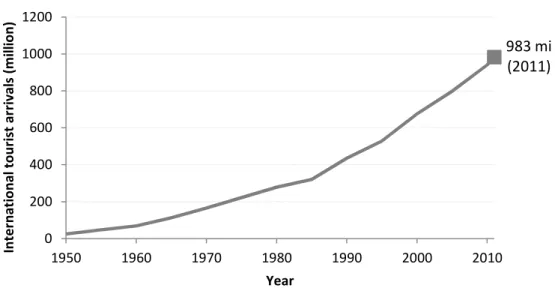
(19) 1 Introduction. Tourism has become one of the largest economic activities worldwide. According to the World Tourism Organization (2012), the overall number of international tourist arrivals increased from 25 million in 1950 to 983 million in 2011, as shown in Figure 1. The average annual growth rate during this period was 6.2%. The largest international destination region is Europe, followed by Asia and the Pacific. Americas are the third largest destination region. The overall international tourism receipts exceed US$ 1 trillion in 2011. Tourism exports account for about 30% of world’s service exports and 6% of overall exports of goods and services. Tourism is the fourth largest exporting sector in the world after fuel, chemicals and automotive products.. 1.
(20) International tourist arrivals (million). Figure 1: International tourist arrivals from 1950 to 2011 1200. 983 mi (2011). 1000 800 600 400 200 0 1950. 1960. 1970. 1980. 1990. 2000. 2010. Year Source: World Tourism Organization (2006, 2012). These figures highlight the economic importance of international tourism. However, this is only one part of the whole tourism sector. Domestic tourism generates the largest share of tourism income in several countries. For example, more than 80% of total internal tourism consumption is domestic in countries such as China, India, Japan, Mexico, Netherlands, Philippines and United States (World Tourism Organization, 2010). Therefore, the economic importance of the tourism sector goes far beyond international tourism. The prominent relevance of the tourism sector has created a strong competitive environment among tourism companies and destinations. The need for efficient governance has increased substantially, and managers are required to search for improved policies and strategies. These needs favoured tourism applied research and the increasing interest on a deeper understanding of tourism as a complex social and economic phenomenon. The set of tourism research subjects is large and heterogeneous. One of the most studied subjects in this field is tourism demand, which have been analysed through a vast number of perspectives, including psychology, anthropology, sociology and economics. In tourism economics, demand modelling is one of the most important topics of research. The prominence of tourism demand modelling among economic studies is evidenced, for instance, by the number of submitted papers to the Tourism Economics. 2.
(21) Chapter 1: Introduction. journal. According to Wanhill (2011), 19% of all submitted papers are focused on demand modelling. Another evidence is the large number of papers published in different academic journals. According to the literature review on tourism demand conducted by Li, Song and Witt (2005) and Song and Li (2008), almost five hundred studies on this topic were published from 1960 to 2007. The main aspects remarked in these reviews are: The economic consumer theory is usually adopted as the theoretical framework underpinning tourism demand modelling studies. Tourism demand has been usually measured by arrivals or tourist expenditure. Some studies have differentiated tourism demand by purpose of the trip and transport mode. Different types of data are used in these studies, including both aggregate and individual data, cross section and time series, revealed and stated preferences, primary and secondary databases. Time series methodology has mainly employed yearly, quarterly and monthly data. Explanatory studies have employed a wide sort of independent variables. The most usual independent variables are income, relative prices, substitute prices, travel costs, exchange rates, dummies and deterministic trends. Most studies are geographically concentrated on Europe, United States, Asia and Pacific. Statistical and econometric techniques employed are also diverse and fast evolving. Tourism demand studies have provided detailed explanations and accurate forecasts. Consistency and explanatory power of statistical models improved considerably over the last decades. The relationships between tourism demand and a large set of relevant variables were empirically tested. These achievements have provided an enormous support for the management of tourism firms and destinations. According to Song, Witt and Li (2009, p. 1) Tourism demand is the foundation on which all tourism-related business decisions ultimately rest. Companies such as airlines, tour operators, hotels,. 3.
(22) cruise ship lines, and many recreation facility providers and shop owners are interested in the demand for their products by tourists. The success of many businesses depends largely or totally on the state of tourism demand, and ultimate management failure is quite often due to the failure to meet market demand.. However, some aspects of tourism demand have been insufficiently studied in the academic literature. An important topic that has not received appropriate attention is multidestination tourism trips (MTTs), which can be defined as a single tourism trip in which more than one destination is visited. MTT is opposed to a single destination tourism trip, in which only one destination is visited. Following the UNWTO’s recommendations for tourism statistics, a tourism trip may be defined as a trip to destinations outside traveller’s usual environment, for less than a year, for any main purpose other than to be employed by a resident entity in the destination (United Nations, 2010). According to these recommendations, visitation is defined as the stay in a place during a tourism trip. Destination may be defined as the place visited. Operational definitions of all these concepts are usually necessary to conduct empirical analysis. Time duration of a visit is an important aspect to be considered in these definitions. How short a stop may last for it to be considered a visit? The minimum length of the stay required by operational definitions of a visit has varied from a few moments up to an overnight. Another pertinent aspect to be considered is the geographical definition of a destination. How large is the geographical limits of a destination? In practice, the operationally defined size of a destination has varied from large areas, such as countries, to small locations, such as towns. The UNWTO defines that “a trip is made up of visits to different places” (United Nations, 2010, p. 10). In fact, this definition does not leave space for a single destination tourism trip since a visit supposes a stop, and a tourist may stop in a single location during his or her trip. A more adequate definition would be that “a trip may be made up of visits to different places”, indicating that single and multiple destination trips are possible alternatives. This imprecision in the UNWTO definitions is a preliminary evidence of the lack of attention given to MTTs.. 4.
(23) Chapter 1: Introduction. Besides, it is interesting to note that the UNWTO proposes that “a tourism trip is characterized by its main destination, among other characteristics” (United Nations, 2010, p. 13). Main destination is understood as “the place visited that is central to the decision to take the trip” (United Nations, 2010, p. 14). This trip characterization perspective clearly minimizes the importance of MTTs and does not recognize the complex nature of this type of tourism trips. Statistical information about MTTs is very scarce. Official tourism statistics usually do not record any information about this topic because destination management organizations are typically not interested on tourists’ visits to other destinations (Leiper, 1989). Even when the destination management organization is responsible for a whole region or country, including more than one destination, it usually does not produce statistics concerning MTTs within its own region or country. However, it is possible to find some data capturing the occurrence of MTT in international tourist survey reports from countries where tourism statistics are best developed. For example, MTTs account for 33% of inbound tourism in the United States, while the average number of destinations visited is two (U.S. Department of Commerce, 2011). For the outbound American tourism, the average number of countries visited is 1.3 (U.S. Department of Commerce, 2010). In Canada, the average number of provinces visited by inbound tourists is 1.14 (Canadian Tourism Commission, 2011). In New Zealand, considering only the top ten destinations and grouping all the remaining destinations in a eleventh category, the average number of destinations visited by inbound tourists is 2.1. Besides, 35% of these tourists visit other countries in the same trip to New Zealand (Tourism Strategy Group, 2011). In Australia, MTTs represent 53% of total inbound tourism and the average number of destinations visited by international tourists is 3.2 (Tourism Research Australia, 2008). Finally, according to Oppermann (1995), 41.6% of inbound tourists in Malaysia visit more than one city, while 52.6% visit other countries in the same trip. The remaining of this chapter is organized as follows. Section 1.1 presents the research objectives of this thesis and the content of the next chapters. Then, a general literature review of the topics developed in the following chapters is presented. Section 1.2 reviews the previous literature on MTTs, while Section 1.3 focuses on studies about. 5.
(24) tourists’ length of stay as a general literature review for Chapter 4. The data source used at the empirical chapters 3 and 4 is presented in detail at Section 1.4. Finally, a brief overlook of inbound tourism in Brazil is presented at Section 1.5.. 1.1 Research objectives The general objective of this thesis is to enlarge the understanding of multidestination tourism trips. The general relevance of MTTs and the lack of knowledge about this topic are the capital justifications for this work. The substantial incidence of MTTs in Brazil provides further support to the proposal of this study. Three main lacks of the academic literature on MTTs are studied in this thesis. First, economic theoretical models of tourist choices developed hitherto are insufficient to explain MTTs consumption. On one hand, traditional microeconomic theory of consumer choices, such as Morley (1992) and Stabler, Papatheodorou and Sinclair (2010), were developed within the single destination paradigm, overlooking the possibility of tourists choosing to visit multiple destinations in a single trip. On the other hand, available economic theoretical models of consumer choices within the MTT paradigm, such as Rugg (1973) and Tussyadiah, Kono and Morisugi (2006), were based on the Lancaster (1966) characteristics theory. However, two important criticisms can be made to this approach. First, although some characteristics are clearly common among different destinations, other relevant aspects are site specific. Lancaster’s theory does not allow for the consideration of singularities, overlooking the importance of uniqueness of tourist destinations. Second, it is not clear why one should consider Lancaster’s theory in the first place since MTT choices can be explained by a simpler and more common approach – the traditional economics’ consumer theory. Lancaster’s theory seems to add unnecessary issues to the discussion. Characteristics are argued to be an unrequired concept to explain why people have interest in visiting more than one destination in a single trip. The consideration of characteristics in the MTT choice model only makes it pointlessly complex. Finally, the resulting complexity apparently prevented these researchers to account for some important aspects of consumers’ choices in the MTTs paradigm. An alternative theoretical model for consumers’ choices. 6.
(25) Chapter 1: Introduction. in the MTT paradigm based on the traditional economic theory is presented in Chapter 21. Second, despite of the relatively large theoretical literature on the determinants of MTTs consumption, few studies had analysed this topic from an empirical perspective. The most relevant studies in this field are those conducted by Tideswell and Faulkner (1999, 2003) and Nicolau and Más (2005). The objective of the study presented in Chapter 3 is to further develop the analysis of the individual determinants of MTTs consumption, assessing theoretical propositions and empirical findings of previous studies. Inbound tourism in Brazil is empirically studied. The earlier set of explanatory variables is extended to include some additional determinants, such as education level, type of accommodation and season. The time evolution of the dependent variable is also assessed. Finally, count data models are employed, overcoming some deficiencies of previous studies and providing better estimates. The family of models used also allows for the analysis of potential qualitative differences between single and multiple destination trips. Third, MTTs introduce an interesting additional issue on the modelling process of tourists’ length of stay. When the durations of the stays at different destinations in the same trip are regarded, correlation among observations arises. Therefore, the usual modelling techniques are no longer valid. In the fourth chapter, tourists’ length of stay is modelled using shared heterogeneity duration models which takes proper account of this particular characteristic of data. To our knowledge, this study is the first one to use shared heterogeneity duration models in the tourism context. Besides, differences between the length of stay at the destination and in the destination region are an important issue arising from this perspective. Different specific models are assessed in order to find the best fitting one. The empirical study conducted at Chapter 4 also expands the set of explanatory variables used by earlier studies. Besides, it analyses the recent evolution of the tourists’ average length of stay in Brazil. Interestingly, this variable has presented an increasing trend in Brazil, an unexpected reality when compared to most countries. The causes of this trend are carefully analysed.. 1 The content of Chapter 2 corresponds to the complete version of the work published as a condensed article in Santos, Ramos, & Rey-Maquieira (2011).. 7.
(26) 1.2 Previous literature on MTTs Academic research about multidestination tourism emerged in different areas and has distinct approaches. Four main approaches might be identified, as discussed in the following.. 1.2.1 Descriptive studies MTTs were described in several different ways throughout the academic literature. Initial qualitative descriptions of the MTTs phenomenon were usually done by geographical studies (for example Pearce, 1990, 1995, 1999). Exploratory quantitative analysis of MTTs employed different measures, such as the number of tourists visiting more than one destination (e.g., Hu & Morrison, 2002; Hunt & Crompton, 2008; McKercher, 2001; Oppermann, 1995; Tideswell & Faulkner, 1999; Tourism Research Australia, 2008; Wall, 1978), the distribution of tourists according to the number of destinations visited (Hwang & Fesenmaier, 2003; Lew & McKercher, 2002; Parroco, Vaccina, Cantis, & Ferrante, 2012; U.S. Department of Commerce, 2011), and the average number of destinations visited (Hwang & Fesenmaier, 2003; Hwang, Gretzel, & Fesenmaier, 2006; Oppermann, 1992; Tideswell & Faulkner, 1999, 2003, U.S. Department of Commerce). Relatively detailed descriptions of MTTs have outlined the inventory of destinations visited (e.g., Baxter & Ewing, 1981; Hunt & Crompton, 2008; Wall, 1978) and the most frequent combinations of destinations (Hwang et al., 2006; Lew & McKercher, 2002; Oppermann, 1992; Parroco et al., 2012). Leiper (1989) proposed a specific index to describe MTTs patterns that may overcome usual lack of raw data. The Main Destination Ratio proposed is calculated by combining data collected separately at the origin and the destination. This index refers to the flow between origin and destination, and reveals the percentage of tourists from a given origin for whom a visited place is the main destination of their trips. It can be calculated by comparing departure statistics where tourists declare which is the main destination of their trips, with arrivals statistics collected at the destination. Several authors studied spatial patterns of multidestination tourism by describing itinerary types. Each study presents a different set of patterns to describe the. 8.
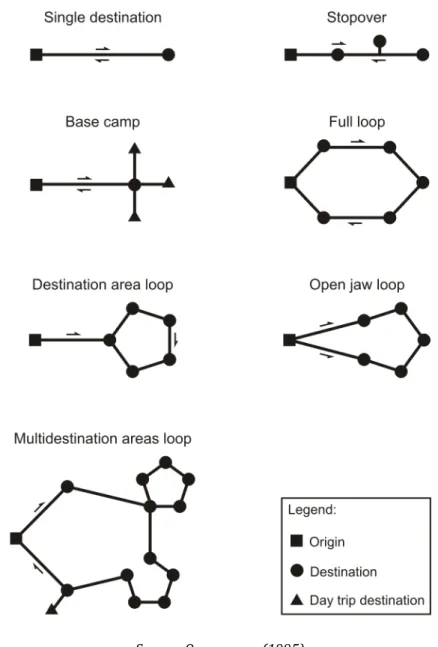
(27) Chapter 1: Introduction. most frequent itineraries. Flognfeldt (1992) described three itinerary patterns of tourists in Norway. Mings and McHugh (1992) identified four patterns among tourists visiting the Yellowstone National Park in the United States. Lue, Crompton and Fesenmaier (1993), which is perhaps the most influential paper on MTTs, proposed a model of five itineraries in a theoretical study. Oppermann (1995) studied inbound tourism in Malaysia, adopting the model of Lue et al. (1993) and proposing two more itinerary patterns, as presented in Figure 2. These patterns are more clearly defined by Lew and McKercher (2002) as follows: Figure 2: Schematic representations of Oppermann’s itinerary patterns. Source: Oppermann (1995). 9.
(28) Single destination: same route to and from destination with no stopovers or destination area day trips. Stopover: same route to and from destination with stopovers. Base camp: same route to and from destination with side day trips departing from it. Full loop: full circular route starting and ending at the origin with stopover destinations. Destination area loop: same route to and from destination area with a full circle route in the destination region. Open jaw loop: different routes to and from a destination area with a partial circular route at the destination area. Multidestination areas loop: full circular route with day trips or separate circular trips departing from stopover destinations. Despite of Lew and McKercher’s (2002) effort to integrate previously described itinerary patterns, further operational definitions may be required for practical use. Concepts such as destination, destination area, stopover and route may need further specifications. For example, although destinations were frequently defined as cities or towns (for example Flognfeldt, 1992; Hwang & Fesenmaier, 2003; Hwang et al., 2006; Jeng & Fesenmaier, 1998; Koo, Woo, & Dwyer, 2009), other geographical definitions were employed, such provinces (Tourism Research Australia, 2008), states (U.S. Department of Commerce, 2011) and countries (Lew & McKercher, 2002). Moreover, the set of previously described itinerary patters is incomplete, providing no proper classification for fuzzy or redundant itineraries. Thus, further classifications may be needed for specific applications. Besides theoretical discussions, several empirical studies on tourist itineraries were published. Travel itinerary patterns in Branson (USA) were empirically analysed by Stewart and Vogt (1997). Hwang and Fesenmaier (2003) studied domestic tourism itinerary patterns in the same country. Yang, Hui-Min and Ryan (2009) studied stated preferences of Chinese tourists with respect to itineraries in South-Western USA. Taplin and McGinley (2000) analysed car travel itineraries departing from Perth (Australia) using a linear program. Zillinger (2007) provided detailed descriptions of MTTs of. 10.
(29) Chapter 1: Introduction. German tourists in Sweden through the analysis of travel diaries where individual spatiotemporal travel patterns were registered. Wu and Carson (2008) used a Geographic Information System (GIS) to study spatiotemporal characteristics of MTTs in South Australia, providing one of the most detailed descriptions of this phenomenon. GIS was also used to describe survey collected data about travel itineraries at the Loch Lomond and Trossachs National Park in Scotland (Connell & Page, 2008). Lew and McKercher (2002) argue that the identification of the itinerary pattern is less relevant to destination management organizations than information about the relative position of the destination within the itinerary. The authors present definitions for five types of destinations according to their relative position within the travel itinerary, proposing that each one requires different services and infrastructure. A gateway destination is the first site visited at the beginning of a multiple destination itinerary. Egress destination is the last one in the itinerary, being visited just before the tourist returns home. Touring destinations are the ones in the middle of the trip. Finally, the hub is defined as any destination visited at least twice during the trip. It is argued that transport facilities and services requirements are usually exceptional in hub destinations, good in gateways and egress destinations and just ordinary in touring and single destinations. Single destinations need a larger, more complete and more diversified mix of attractions and activities than the other ones. Finally, gateway and egress destinations have important roles in relation to psychological experiences, providing the feeling of transition between home and away, and also working as cushions for cultural-shocks. The performance of Hong Kong in different positions is empirically studied by these authors. Some studies described spatial patterns of multidestination tourism through social network measures, describing the structure of relations between social entities through the calculation of indicators about the whole network and the position of individuals in the network structure. Oppermann (1992) presented the number of connections between destinations as an elementary network centrality measure to analyse tourism in Malaysia. Hwang et al. (2006) studied several network measures and their relationships with variables such as origin markets, previous trips to the destination, transportation system and geographical situation of destinations. Shih. 11.
(30) (2006) applied social network measures to self-driving tourists in Nantou, Taiwan. These studies proposed some policy implications that could be derived from social network measures. However, no empirical results were used to validate these propositions.. 1.2.2 Cumulative attraction The concept of cumulative attraction was proposed by Nelson (1958, p. 58), and it states that “a given number of stores dealing in the same merchandise will do more business if they are located adjacent or in proximity to each other than if they are widely scattered”. Cumulative attraction is intimately linked to the concept of cluster, particularly to the idea of spatial agglomeration benefits related to the attraction of consumers (Porter, 1990). In economic terms, cumulative attraction means that some businesses, even in the same sector, may be gross complements rather than substitutes because of spatial matters. In the tourism context, Lue et al. (1993) argue that cumulative attraction may happen to businesses or destinations located in proximity or in a spatial sequence to each other. Destinations are said to display cumulative attraction if the sum of their demands is greater when they are closely located than when they are distant from each other (Jeng & Fesenmaier 1998). According to Papatheodorou (1999), on one hand, two close destinations compete for tourists as standard substitutes. But on the other hand, the attraction of multidestination tourists by one destination may increase the number of tourists on the other site, resulting in some degree of complementarity. The net effect is a priori ambiguous; positive net effects might happen in some cases, while in other instances negative net effects might be the actual outcome. Several empirical studies discuss cumulative attraction in the tourism context. Crompton and Gitelson (1979) were pioneers in this field by studying cumulative attraction between commercial leisure enterprises. Lue, Crompton and Stewart (1996) used an experimental approach to search for evidence of cumulative attraction among tourist destinations. This article was strongly criticized by Beaman, Jeng and Fesenmaier (1997), who argued that the previous research confused cumulative attraction arising. 12.
(31) Chapter 1: Introduction. from multiple destinations and from destinations’ attributes. Jeng and Fesenmaier (1998) also adopted an experimental approach in order to analyse the cumulative attraction among European cities in the MTT context. . Hunt and Crompton (2008) tried to measure the degree of cumulative attraction among different tourist attractions of the same city using the original scale proposed by Nelson (1958), which is measured in percentage of shared tourists. Finally, Weidenfeld, Butler and Williams (2010) deeply analysed the relationship between the nature of the tourism product, spatial clustering and cumulative attraction among attractions using in-depth interviews with tourist attraction managers and a tourist survey.. 1.2.3 Theoretical approaches Some studies proposed comprehensive theoretical backgrounds for the individual choice process regarding MTTs based on the economic theory. The application of Lancaster’s (1966) characteristics approach to consumer theory provides a formalized and comprehensive approach to multidestination tourism trips choice. Several studies applied this approach to tourism consumption (e.g., Morley 1992; Papatheodorou 2001, 2006; Seddighi and Theocharous 2002), but only two of them analyse multidestination trips (Rugg 1973; Tussyadiah et al., 2006). Rugg (1973) proposed a model of tourism demand by stating that tourists maximize their utility derived from characteristics of the destinations visited. This consumption is determined by convex preferences, as well as monetary and time budget restrictions. Accordingly, the problem faced by potential tourism consumers is to maximize = subject to = .. ≥. +. ≥ . , ,. ,. .. + . ,. , , ≥0. 13.
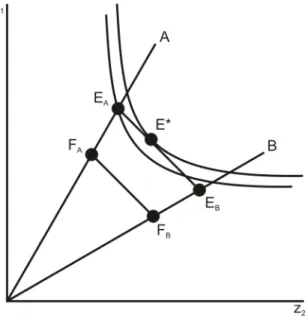
(32) where z represents characteristics’ quantities, b describes the production of characteristics by each destination, d is the time spent in each destination, pd and pt are destination and transport prices, respectively, m is a permutation vector of zeros and ones identifying trips between pairs of locations, c is a vector of ones, and t represents transport time between locations. Bold characters are used to identify vectors. For illustration purposes, consider a case in which there are two characteristics, z1 and z2, such as in Figure 3. Rays A and B represent the production of characteristics by two different destinations. Given prices and available monetary resources, it is possible to calculate the maximum amount of time that the tourist may spend in each destination. If this time is actually spent in a single destination, the tourist obtains quantities of characteristics represented by points EA or EB, respectively related to the consumption of destination A or B. Assuming zero transport costs between both destinations, the segment joining these two points represents the maximum obtainable amount of characteristics if the tourist visits both destinations in the same trip. Assuming convex preferences such as those represented in Figure 3, the optimum combination E* is chosen by the consumer. Figure 3: Representation of the characteristics approach. Rugg’s model is also adapted for cases with positive costs of transport between destinations. In these circumstances, visiting a second destination in the same trip. 14.
(33) Chapter 1: Introduction. implies some additional expenditure. In Figure 3, the point FA represents the quantity of characteristics obtained when the tourist goes to both destinations, spending all available time in destination A. The interpretation of point FB is symmetric. The segment linking FA and FB represents the maximum obtainable amount of characteristics if the tourist visits both destinations. Note that, in this case, points EA and EB are still achievable if the individual travels to a single destination. In the example provided by Figure 3, the tourist chooses to travel only to destination A. Tussyadiah et al. (2006) adds to Rugg’s model the case of a stopover destination that does not require any route change. According to these authors, this case represents no extra cost of transport and it does not change the budget restriction. Their representation of the stopover case is identical to the one where zero transport cost between destinations is assumed. However, this is not correct, since the inexistence of transport costs associated with stopover itineraries happens only in one direction. If no route change is required, the visit to a stopover destination implies no extra transport cost. Nonetheless, when the stopover destination is already being visited, a visit to the furthest destination still requires additional efforts. Tussyadiah et al. (2006) improve Rugg’s model by introducing a conservation law to ensure that transport is consumed in pairs of journeys for each destination, that is, every inwards journey implies the consumption of one outwards journey. This restriction arises from the definition of tourism activity and mathematically ensures that if a tourist visits one location, he also leaves this location after some time. A restriction ignored by both studies is that the time spent at the destination is necessarily zero when no inwards journey to that particular destination is consumed. The characteristics approach to demand presents two major limitations. First, it is difficult to objectively measure many relevant characteristics. Secondly, the characteristics approach is unable to deal properly with exclusive characteristics of products. However, tourism destinations always have some degree of uniqueness, and just a subset of all existent characteristics is present in different places. These criticisms are some of the main arguments in support of the development of the theoretical model of MTTs consumption presented in Chapter 2.. 15.
(34) 1.2.4 Empirical modelling studies There are a few modelling studies about MTTs. Tideswell and Faulkner (1999) modelled the number of overnight destinations visited by international tourists in Queensland, Australia. They used a linear regression model with seven independent variables: party size, distance from country of origin to the destination region, number of different purposes of travel, number of different sources used to obtain information about the Queensland, and three dummy variables identifying the use of own or rented vehicles, the business and conference purpose of travel, and the visiting friends and relatives purpose of travel. Tideswell and Faulkner (2003) analysed the consumption of MTTs in Australia. A linear regression was used to model the number of regions visited. Eleven independent variables were tested. Three non-significant variables were omitted in the final model: party size, the proportion of time away from home spent in Australia, and the use of travel package. The eight significant variables were distance from country of origin to Australia, length of stay in the destination country, number of different purposes of travel, number of different sources used to obtain information about Australia, and four dummy variables indicating use of own or rented vehicles, repeat visit to Australia, group tour, the visiting friends and relatives purpose of travel. Both studies by Tideswell and Faulkner (1999, 2003) can be criticized by the use of an inappropriate modelling technique. The linear regression model adopted by these studies supposes that the dependent variable is normally distributed. Empirical evidence has shown that this is not the case of the number of destinations visited in a trip. Besides, linear regression models are able to provide negative estimates of the dependent variable, which would be an absurd outcome for the number of destinations visited. Nicolau and Más (2005) used a random coefficients logit model to predict the dichotomous decision of taking a single or a multiple destination tourism trip. This prediction was made jointly with predictions about taking a vacation or not and visiting foreign or domestic destinations. Independent variables used to predict the choice of MTTs included organization through travel agents, interest in new places and cultural. 16.
(35) Chapter 1: Introduction. interest. It is relevant to stress that dichotomous dependent variable used is not as informative as the variable number of destinations visited used by Tideswell and Faulkner (1999, 2003). More recently, two modelling studies approached MTTs by different perspectives. Koo et al (2009) adopted an experimental design to model the choice of different transport alternatives to visit the North Queensland region in Australia. Alternatives included car, rental car, bus or coach, train and four different air transport options. The multidestination nature of the trip was used as an explanatory variable in order to capture how the visitation of more than one location influences the utility of each transport alternative. It was shown that the utility of air transport is lower for MTTs than for single destination trips. Finally, Wu, Zhang and Fujiwara (2012) developed a study about tourist destination choices within the MTTs paradigm. These authors took the interdependency across different destinations into consideration by using a universal logit model to explain tourists’ destination choices. The probability of choosing one specific destination was modelled as a function of the characteristics of other destinations and their distances. The effect of other destinations over the choice of a given destination was shown to be significant. This finding evidenced the interdependency among different destinations of a MTT. They concluded that “it is inadequate to analyse destination choice separately and independently without considering the interrelationships that may exist among choices and future dependency should be incorporated into choice analysis” (Wu et al., 2012, p. 128).. 1.3 Previous literature on tourists’ length of stay As explained at Section 1.1, the last chapter of this thesis deals with the analysis of tourists’ length of stay within the MTT paradigm, uncovering potential misleading conclusions obtained when this variable is examined under the single destination paradigm. This section presents an overview of the study of tourists’ length of stay, while the modelling particularities are discussed at Chapter 4.. 17.
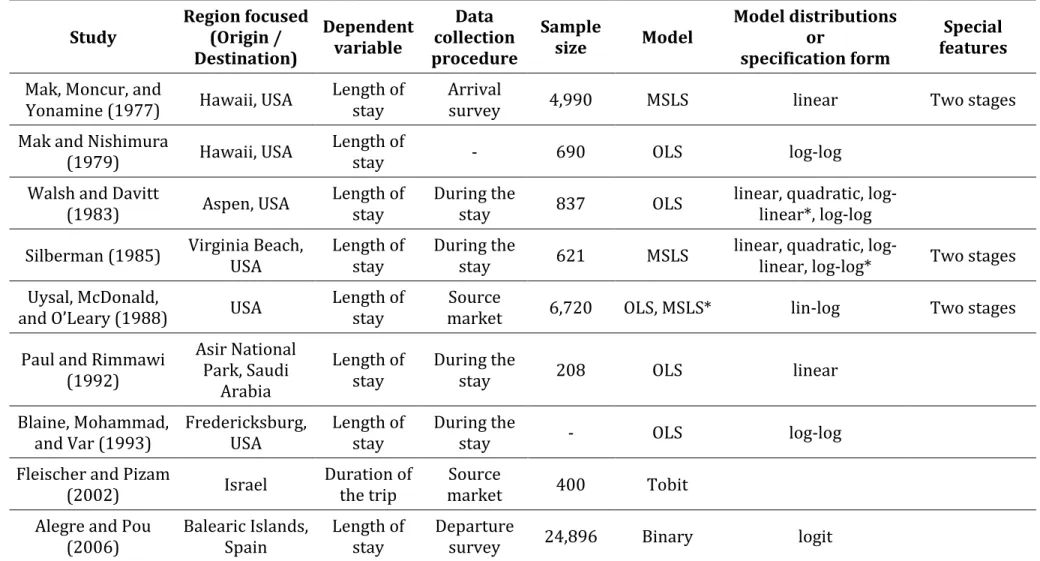
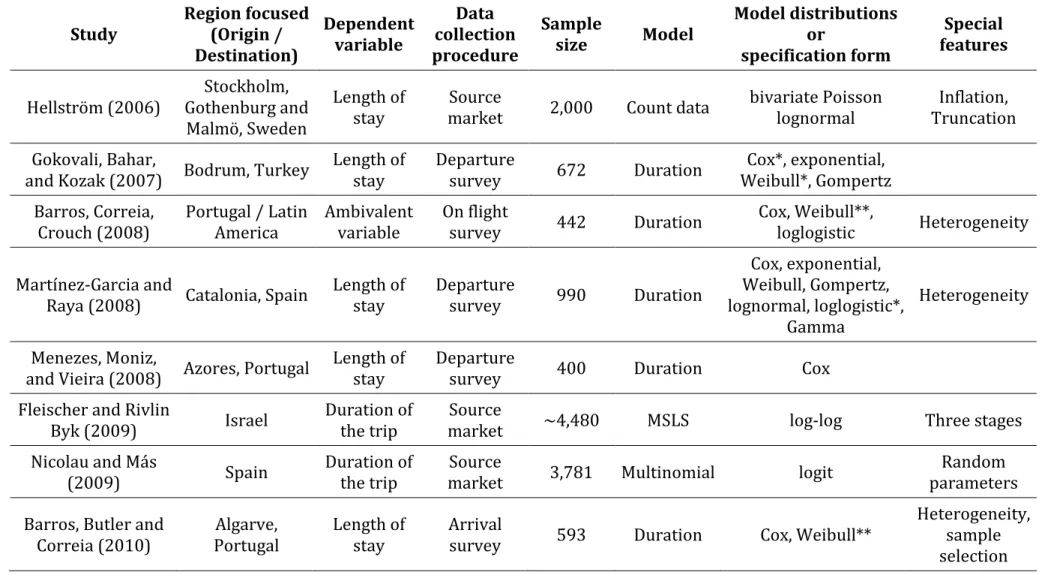
(36) It must be emphasize that the academic interest on tourists’ length of stay is relatively old. For instance, Wurst (1955), a pioneer in this field, proposed ways of calculating tourists’ average length of stay from aggregate data. Two decades after, Archer and Shea (1975) provided further analysis on Wurst’s analysis. Different objectives and approaches are considered in more recent studies. Several descriptive and univariate analyses of tourists’ length of stay and its determinants have been conducted, as in Oppermann (1994, 1995, 1997), Seaton and Palmer (1997), Sung, Morrison, Hong and O’Leary (2001) and Tierney (1993). This topic was also analysed on the context of non-market valuation of recreational assets. Some studies using the travel cost method examined the role played by the length of stay over consumer surplus estimates (for example Berman & Kim, 1999; Larson, 1993; McConnell, 1992; Shaw & Feather, 1999). Another part of the literature is devoted to the detailed assessments of the determinants of the length of stay or the duration of a trip2 using statistical modelling procedures were recently conducted in the academic literature. Despite of Pulina’s (2010) study using aggregate data, most modelling studies about tourists’ length of stay or the duration of the trip used microdata. Twenty four papers modelling tourists’ length of stay from microdata have been published in the main tourism academic journals. Table 1 summarizes the main features of these studies. Pioneer studies modelling tourists’ length of stay were published in the late 1970s, but most studies were conducted since late 1990’s. Studied regions include Latin America, China, United States, Portugal, Spain, Scandinavia, Turkey, Israel, Saudi Arabia and Madagascar.. Length of stay denotes the amount of time that the tourist spends at a given destination, while duration of a tourism trip refers to the length of time between departure and return to home. This issue is discussed in detail at Chapter 4.. 2. 18.
(37) Table 1: Summary of modelling studies on tourists’ length of stay. Study. Region focused Data Dependent (Origin / collection variable Destination) procedure. Sample size. Model. Model distributions or specification form. Special features Two stages. Mak, Moncur, and Yonamine (1977). Hawaii, USA. Length of stay. Arrival survey. 4,990. MSLS. linear. Mak and Nishimura (1979). Hawaii, USA. Length of stay. -. 690. OLS. log-log. Walsh and Davitt (1983). Aspen, USA. Length of stay. During the stay. 837. OLS. linear, quadratic, loglinear*, log-log. Silberman (1985). Virginia Beach, USA. Length of stay. During the stay. 621. MSLS. linear, quadratic, loglinear, log-log*. Two stages. Uysal, McDonald, and O’Leary (1988). USA. Length of stay. Source market. 6,720. OLS, MSLS*. lin-log. Two stages. Paul and Rimmawi (1992). Asir National Park, Saudi Arabia. Length of stay. During the stay. 208. OLS. linear. Length of stay. During the stay. -. OLS. log-log. Blaine, Mohammad, Fredericksburg, and Var (1993) USA Fleischer and Pizam (2002). Israel. Duration of the trip. Source market. 400. Tobit. Alegre and Pou (2006). Balearic Islands, Spain. Length of stay. Departure survey. 24,896. Binary. logit (continued). 19.
(38) 20 Table 1: Summary of modelling studies on tourists’ length of stay (continued). Study. Data Region focused Dependent (Origin / collection variable Destination) procedure. Sample size. Model. Model distributions or specification form. Special features Inflation, Truncation. Hellström (2006). Stockholm, Gothenburg and Malmö, Sweden. Length of stay. Source market. 2,000. Count data. bivariate Poisson lognormal. Gokovali, Bahar, and Kozak (2007). Bodrum, Turkey. Length of stay. Departure survey. 672. Duration. Cox*, exponential, Weibull*, Gompertz. On flight survey. 442. Duration. Cox, Weibull**, loglogistic. Barros, Correia, Crouch (2008). Portugal / Latin Ambivalent America variable. Martínez-Garcia and Catalonia, Spain Raya (2008). Length of stay. Departure survey. 990. Duration. Heterogeneity. Cox, exponential, Weibull, Gompertz, Heterogeneity lognormal, loglogistic*, Gamma. Menezes, Moniz, and Vieira (2008). Azores, Portugal. Length of stay. Departure survey. 400. Duration. Cox. Fleischer and Rivlin Byk (2009). Israel. Duration of the trip. Source market. ~4,480. MSLS. log-log. Three stages. Nicolau and Más (2009). Spain. Duration of the trip. Source market. 3,781. Multinomial. logit. Random parameters. Barros, Butler and Correia (2010). Algarve, Portugal. Length of stay. Arrival survey. Cox, Weibull**. Heterogeneity, sample selection. 593. Duration. (continued).
(39) Table 1: Summary of modelling studies on tourists’ length of stay (continued). Study. Data Region focused Dependent (Origin / collection variable Destination) procedure. Sample size. Model. Model distributions or specification form. Special features. Barros and Machado (2010). Madeira, Portugal. Length of stay. Departure survey. 346. Duration. Weibull. Sample selection. Machado (2010). Madeira, Portugal. Length of stay. Departure survey. 346. Duration. Weibull. SUDCD. Alegre, Mateo, and Pou (2011). Balearic Islands, Spain. Length of stay. Departure survey. 29,162. Count data. Poisson. Latent class. Raya and MartínezCatalonia, Spain Garcia (2011). Length of stay. Departure survey. -. Duration. Cox, exponential, Weibull, Gompertz, Heterogeneity lognormal, loglogistic*, Gamma. Yang et al. (2011). Yixing, China. Length of stay. During the stay. 417. Ordered discrete. logit. Peypoch, Randriamboarison, Rasoamananjara and Solonandrasana (2012). Madagascar. Length of stay. Departure survey. 615. Duration. fractional polynomial, Weibull. Scandinavia. Duration of the trip. Source market. 539. OLS, Duration. log-linear (OLS) Weibull*, lognormal, loglogistic (Dur.). Thrane (2012). * Preferred alternative; ** Preferred when together with the special feature; - Missing information. Heterogeneity, sample selection. 21.
(40) Different theories were used to explain tourists’ choices of how long to travel or to stay at the destination. Mak and Nishimura (1979) based their analysis on simple demand theory. Several authors developed utility maximization models explaining this sort of tourists’ choices (Alegre et al., 2011; Alegre & Pou, 2006; Hellström, 2006; Raya & Martínez-Garcia, 2011). Other studies applied the theory of consumer behaviour arising from Lancaster’s (1966) model and the concept of hedonic prices (Rosen, 1974) as their theoretical background (Barros et al., 2010; Barros et al., 2008; Barros & Machado,2010; Machado, 2010; Peypoch et al., 2012). Although these theories focus on the characteristics of available alternatives, explanatory variables used in these studies were mainly related to individual’ characteristics rather than destinations’ attributes. Lastly, Fleischer and Rivlin Byk (2009) used Becker and Lewis’ (1973) utility maximization model allowing for quantity and quality choices. Adapting this model to tourism consumption, choices about the number of trips, quality of travel services and length of stay were jointly regarded. At most cases, theories adopted to explain tourists’ length of stay presented a high level of generality. These models were usually used only as loose frameworks for identifying relevant explanatory variables rather than actually guiding the construction of the statistical model applied. A remarkable exception was Fleischer and Rivlin Byk’s (2009) theoretical framework, which besides being substantially complex, actually allowed the authors to estimate compensated elasticities for price and time costs. Nineteen studies focused on the length of stay at tourist destinations and four modelled the duration of the trip. The study of Barros et al. (2008) focused on Portuguese tourists travelling to Latin America. This study did not report if inbound and outbound travel time was considered or not, thus providing no information to distinguish the studied variable between length of stay and duration of the trip. Regarding the source of the empirical data, Barros et al. (2010) and Mak et al. (1977) used data of entry surveys gathered during tourists’ arrival at the destination. Several studies used on-site survey data collected along tourists’ stay at the destination (Blaine et al., 1993; Paul & Rimmawi, 1992; Silberman, 1985; Walsh & Davitt, 1983; Yang, Wong, & Zhang, 2011). These two types of data collection procedures conducted before the actual end of the stay might display some inaccuracy if tourists decide to. 22.
(41) Chapter 1: Introduction. change their length stay during this period. Some authors analysed data about past trips collected through household surveys (Fleischer & Pizam, 2002; Fleischer & Rivlin Byk, 2009; Hellström, 2006; Nicolau & Más, 2009; Uysal et al., 1988). Thrane (2012) analysed data about past trips gathered through a survey conducted at a university college. One major criticism to data gathered at source markets refer to inaccuracy arising from respondents’ recall bias (Frechtling, 2006). Barros et al. (2008) conducted on flight surveys. Finally, the remaining studies used exit surveys data collected at gateways during tourists’ return journey. This method may be considered the most adequate since it avoids all inaccuracy sources aforementioned. Different types of tourists were analysed in previous papers due to distinct research objectives and data availability. Ten studies considered tourists with any profile (Barros & Machado, 2010; Blaine et al., 1993; Fleischer & Rivlin Byk, 2009; Machado, 2010; Menezes et al., 2008; Nicolau & Más, 2009; Paul & Rimmawi, 1992; Peypoch et al., 2012; Silberman, 1985; Walsh & Davitt, 1983). Hellström (2006) focused exclusively on leisure tourists, while Barros et al. (2010) focused on golfers. MartínezGarcia and Raya (2008) and Raya and Martínez-Garcia (2011) studied only international tourists, while other authors focused their studies on domestic tourists (Mak et al., 1977; Mak & Nishimura, 1979; Uysal et al., 1988; Yang et al., 2011). Some studies determined their population of interest according to specific tourists’ nationalities (Alegre et al., 2011; Alegre & Pou, 2006; Barros et al., 2008; Gokovali et al., 2007). Alegre et al. (2011) and Alegre and Pou (2006) also defined their population in terms of the type of accommodation used, excluding those staying at friends or relatives’ homes or their own houses. Finally, two studies defined their population of interest in terms of sociodemographic characteristics. Fleischer and Pizam (2002) studied individuals above 54 years old, while Thrane (2012) studied undergraduate students attending to a mediumsized university college. Sample sizes varied substantially. Several studies used fairly small samples, especially when these are compared to the relatively large number of parameters estimated. Small sample sizes led to a substantial number of non-significant parameters estimated at different studies. Moreover, even when significant parameters were obtained, small sample sizes caused large standard errors and loose parameter. 23.
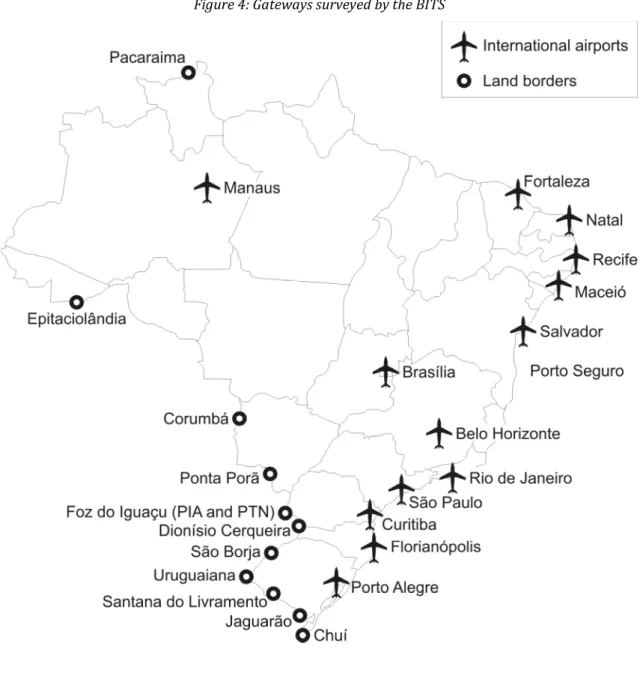
(42) estimates. Two remarkable exceptions were the studies of Alegre et al. (2011) and Alegre and Pou (2006) which used large datasets.. 1.4 Data source for empirical studies Chapters 3 and 4 conduct empirical studies using a secondary database generated from the Brazilian Inbound Tourism Survey (BITS). The BITS is the Brazilian official source of statistics on international tourists’ and travels’ characteristics. This survey is conducted by the Foundation Institute of Economic Research (FIPE) and financially supported by the Tourism Ministry of Brazil since 2004. The BITS substituted a previous survey that was conducted by the National Tourist Board (Embratur) since 1980. The survey is based on personal interviews with international tourists visiting Brazil. Interviews are conducted at international gateways a few moments before tourists’ departure from the country. A total of 27 international gateways of Brazil were surveyed, including 15 international airports and 12 land borders. The set of international airports covered by the BITS accounts for more than 99% of total international air traffic in Brazil, while the set of land borders account for about 95% of total road traffic. The use of other transport modes for international passenger transport in Brazil is marginal (2,9% in 2010 and 3,4% in 2011). The list of gateways surveyed by the BITS is presented in Figure 4. Note that in Foz do Iguaçu there are two survey locations, one at the border with Paraguay (PIA) and another at the border with Argentina (PTN). The frequency of survey periods at each gateway varies from one to six times a year. Survey periods last from one to two weeks and daily lengths of survey varies from six to 24 hours. Larger and more frequent survey periods were undertaken at the most important gateways, such as São Paulo, Rio de Janeiro and Foz do Iguaçu. From 2004 to 2010, a total sample of 183.232 valid interviews was obtained. The sample size increased significantly from 2004 to 2005 and from 2007 to 2008. The distribution of the sample by years is presented at Table 2.. 24.
(43) Chapter 1: Introduction. Figure 4: Gateways surveyed by the BITS. Table 2: Sample size of the BITS by year. Year. Sample size. %. 2004. 18,021. 9.8. 2005. 22,692. 12.4. 2006. 22,557. 12.3. 2007. 23,246. 12.7. 2008. 32,760. 17.9. 2009. 31,739. 17.3. 2010. 32,217. 17.6. Total. 183,232. 100.0. 25.
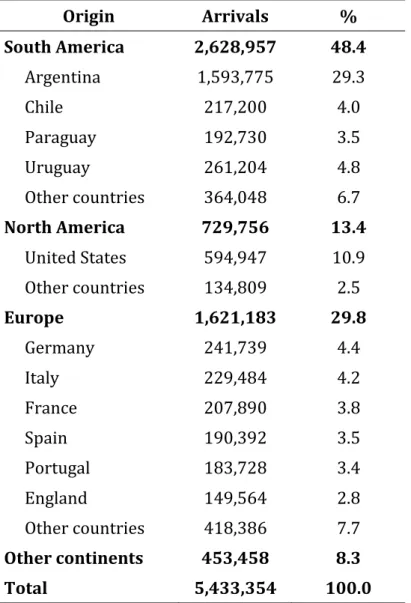
(44) Sampling quotas are defined for the main source markets in order to ensure institutional standards of accepted error. Sample weights are calculated according to source market, survey period and gateway using tourist arrivals statistics from migration control. Statistical definitions suggested by the UNWTO and UN are adopted by the BITS. Tourist destination is specifically defined as a municipality where tourists stayed overnight. The use of municipalities is not significantly restrictive, as according to raw data from the BITS, very few international tourists stay overnight at more than one place at the same Brazilian municipality. The questionnaire of the BITS is presented at Appendix 2. It includes about 30 questions covering: Tourists’ characteristics: age, gender, place of residence, education level and income; Travel’s characteristics: purpose, destinations visited, length of stay, expenditure by items, transport mode, accommodation, use of tour packages, type of travel party, sources of information, previous trips to Brazil; and Tourists’ opinions: evaluation of different aspects, fulfilment of personal expectations and intention to return.. 1.5 Inbound tourism in Brazil International tourism in Brazil is relatively incipient despite of its relevant natural and cultural assets. In 2011 the country received almost 5.4 million tourists, 0.2 million less than Argentina, which is the leading destination country in South America. South America represents 48.4% of total Brazilian inbound tourism, while Europe and North America respond for 29.8% and 13.4%, respectively. Argentina is the largest tourist source market, responding alone for 29.3% of total arrivals. The distribution of Brazilian inbound tourist flows according to their origin is presented at Table 3.. 26.
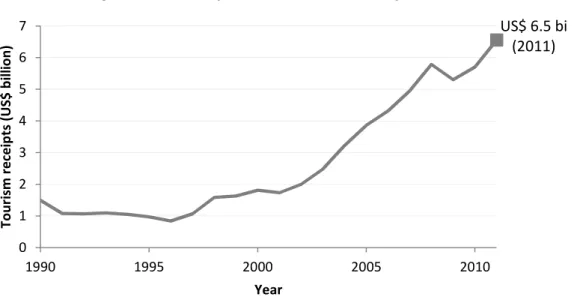
(45) Chapter 1: Introduction. Table 3: Brazilian inbound tourist flows according to the origin (2011). Origin. Arrivals. %. South America. 2,628,957. 48.4. Argentina. 1,593,775. 29.3. Chile. 217,200. 4.0. Paraguay. 192,730. 3.5. Uruguay. 261,204. 4.8. Other countries. 364,048. 6.7. North America. 729,756. 13.4. United States. 594,947. 10.9. Other countries. 134,809. 2.5. 1,621,183. 29.8. Germany. 241,739. 4.4. Italy. 229,484. 4.2. France. 207,890. 3.8. Spain. 190,392. 3.5. Portugal. 183,728. 3.4. England. 149,564. 2.8. Other countries. 418,386. 7.7. Other continents. 453,458. 8.3. 5,433,354. 100.0. Europe. Total. Source: Ministério do Turismo (2012). International inbound tourism generated receipts of US$ 6.5 billion in 2011, what represents 17.2% of Brazil’s service exports3. The average growth rate of Brazilian international tourism receipts from 2000 to 2011 was 12.4%, despite of the fall in 2009 due to the world economic crisis. This was a relatively fast growing period as compared to the 1990s when the average growth rate was 2.0%. The evolution of Brazil’s international tourism receipts is presented in Figure 5.. 3. Data from the Balance of Payments of the Central Bank of Brazil.. 27.
Figure
+7
Documento similar
In the preparation of this report, the Venice Commission has relied on the comments of its rapporteurs; its recently adopted Report on Respect for Democracy, Human Rights and the Rule
Our results here also indicate that the orders of integration are higher than 1 but smaller than 2 and thus, the standard approach of taking first differences does not lead to
In the “big picture” perspective of the recent years that we have described in Brazil, Spain, Portugal and Puerto Rico there are some similarities and important differences,
At the OECD remote interpreting was used for 50 interpreter sessions, out of a total of 5500, in 2016, almost always because the number of languages required exceeded the number
In a similar light to Chapter 1, Chapter 5 begins by highlighting the shortcomings of mainstream accounts concerning the origins and development of Catalan nationalism, and
In the previous sections we have shown how astronomical alignments and solar hierophanies – with a common interest in the solstices − were substantiated in the
Díaz Soto has raised the point about banning religious garb in the ―public space.‖ He states, ―for example, in most Spanish public Universities, there is a Catholic chapel
teriza por dos factores, que vienen a determinar la especial responsabilidad que incumbe al Tribunal de Justicia en esta materia: de un lado, la inexistencia, en el
