Effect of fructose containing feedstocks on the microstructure of multicomponent coatings deposited by suspension plasma spraying
34
0
0
Texto completo
(2) Abstract This work addressed to investigate the use of fructose as an ingredient in the feedstock suspension of a Y-TZP/Al2O3/SiC multicomponent coating manufactured by SPS. The effect on suspension rheology and resulting coatings microstructure and thermal conductivity was assessed. It was observed that addition of fructose hardly affected the rheological behaviour of the suspensions while a strong decrease in the surface tension of water occurred. Drastic changes of coating microstructures were attributed to this effect in liquid surface tension i.e. fructose favoured the growth of columnar structure in the coatings. XRD patterns showed that fructose increased the crystallinity of the tetragonal Y-TZP phase of the coatings. The determination of thermal conductivity showed that the formation of a controlled columnar structure along with porosity is beneficial for thermal insulation. The results show, for the first time, the designing of coatings with columnar microstructure by SPS from water-based suspension feedstocks.. 2.
(3) 1. Introduction Thermal barrier coatings (TBCs) include a class of materials designed to protect gas turbine components from high temperatures and aggressive environments. TBCs are composed of refractory ceramic oxides, such as alumina, titania, magnesia, and their mixtures; nevertheless, yttrium-doped zirconia (YSZ) represents the most commonly used material for TBCs owing to its moderately low thermal expansion, low thermal conductivity and high phase stability and corrosion resistance [1]. Advanced TBCs providing gas turbines with higher efficiency and lower polluting emissions constitute one of the greatest challenges for the current and future gas turbine industry [2]. Thus, the development of new coating architectures, novel multicomponent materials or a combination of both approaches are currently under intense research [3–6]. One of the simplest way to improve the efficiency of the turbine deals with increasing its thermal insulation, which means that TBCs can operate at higher temperatures [7]. Numerous works in the field of thermal barrier coatings of YSZ have demonstrated that developing columnar microstructure throughout the coating can enhance TBC lifetime owing to the decrease of residual stresses and the increase of thermal shock resistance [8–14]. Otherwise, suspension plasma spraying (SPS) technique has been proven to be very effective in generating columnar microstructures in YSZ coatings leading to high thermal cycling resistance [10–12]. Thus, Bernard et al [12] found thermal conductivity of the YSZ coating processed by SPS lower than 1 W m-1 K-1 from room temperature up to 1100 ºC irrespective of the column morphology developed. This result is in agreement with previous works where YSZ porous columnar structures display thermal conductivity values in the range of 0.6–1 W m-1 K-1 compared to typical values of YSZ in EB-PVD coatings (1.5 W m-1 K-1) [8,13,14].. 3.
(4) With regard to the design of the columnar microstructure by SPS, literature also recognises the impact of feedstock characteristics and the subsequent suspension spraying into the plasma torch on the genesis and development of such microstructure. Thus, Curry et al. [15] and VanEvery et al [16] reported that the decrease in the viscosity and the surface tension of nanoparticle suspension feedstocks reduce the effective size of the droplet radius assisting the growth of columnar coatings in SPS processes. Nevertheless, although the feedstock effect was reported no research has been addressed on the modification of suspension characteristics to propitiate columnar microstructure appearance. In the last years, several works have been reported where saccharides and their derivatives were found to be effective in reducing the viscosity of aqueous nanoparticle and microparticle suspensions due to the adsorption of the polymer on the particle surface displacing the adsorbed water molecules, thereby decreasing the viscosity of the suspension [17–19]. Regarding the effect of fructose or other saccharides on surface tension in ceramic suspension have not reported To the best of our knowledge. On the other hand, recent research has shown the use of different saccharides such as sucrose, glucose or fructose as pore formers in ceramic materials, demonstrating that it is possible to obtain ceramic materials with tailored porous microstructure by adding some saccharides [20–23]. A fine porous microstructure can improve the thermal insulation properties of TBCs due to the high difficulty of heat transfer provided by well distributed multiscale porosity [14,24]. It should also be emphasized that SPS process can produce TBCs with very fine porous microstructure as well as high deposition rates that enable to produce large amounts of different coatings at low cost.. 4.
(5) Finally, the use of fructose has been revealed for stabilizing the tetragonal phase of yttriastabilized zirconia (Y-TZP). Heshmatpour et al. [25] studied the synthesis of zirconia nanoparticles by the sol–gel method in presence of glucose and fructose as organic additives. The use of these organic compounds stabilised the tetragonal zirconia reducing the formation rate of monoclinic zirconia and played an important role in the morphology and crystallite size of the synthesised nanoparticles. On the other hand, saccharides display interesting characteristics such as low cost, non-toxicity, water-solubility and ease of storing. In addition, saccharides can be easily removed from samples by burnout resulting in a fine, porous microstructure [26,27]. As a consequence, fructose represents a serious candidate to be studied as pore modifier in SPS suspension feedstocks for YSZ coatings. Thus, the objective of this work was to investigate the use of D-fructose as an additive in the feedstock suspension and its relationship with the microstructure and thermal properties of a Y-TZP/Al2O3/SiC multicomponent coating manufactured by SPS. The use of this multicomponent system is based on previous research by the authors who are exploring advanced TBCs coatings [3,6]. For this purpose, suspension feedstocks containing different concentrations of fructose and solids were prepared. Rheological characterization of feedstock suspensions was carried out, as well as microstructural examination and thermal conductivity determination. To the best of our knowledge, there is no previous, available research in the thermal spray community on the use of some organic-based compound in a suspension feedstock to promote a tailored porous and/or columnar microstructure in the final SPS coating as targeted in this work.. 5.
(6) 2. Experimental 2.1. Suspension preparation and characterisation Multicomponent suspensions were prepared to solids contents of 20 and 30 vol.% (57 and 63 wt-%, respectively) in deionised water at several sonication times and with two fructose concentrations in order to address the effect produced by this compound on the final coating microstructure. Thus, these multicomponent suspensions were obtained by adding the different reagents in water: tetragonal zirconia polycrystals doped with 3 mol% Y2O3 (TZ-3YS, Tosoh Co., Japan) and α-alumina (CT3000SG, Almatis, Germany) according to the eutectic mass ratio of 51/34 and α-silicon carbide (UF-15, Hermann C. Starck, Germany), as disperse phase in a concentration of 15 wt%. More details of raw materials are described in previous works [6,28]. Finally, two amounts of D-fructose (AppliChem GmbH, Germany) were tested in each suspension feedstocks (20 and 50 wt.%). Suspensions were stabilised by means of a sonication probe (UP 400S, Dr Hielscher GmbH, Germany) and the addition of an amount of a specific organic deflocculant for each powder (0.2 wt % ammonium salt of polyacrylic acid (PAA; Duramax TM D-3005, Rohm & Haas, USA, with 35 wt% active matter) for 3Y-TZP and Al2O3, and 1.5 wt% synthetic polyelectrolyte (PKV, Produkt KV5088, ZschimmerSchwarz, Germany with polycarboxylic nature) for SiC), which has been studied in a previous work [28]. Rheological behaviour was analysed using a rheometer (Haake RS50; Thermo, Karlsruhe, Germany) which operated in controlled shear rate mode. The rheometer was designed with an element of measurement of double-cone and plate and equipped with a system to avoid the evaporation of solvent. The test cycle consisted in uploading the shear rate from 0 to 1000 s-1 in 5 minutes, maintaining at 1000 s-1 for 1 minute and downloading from 1000 to 0 s-1 in 5 minutes. In addition, the stability of the. 6.
(7) multicomponent suspensions containing fructose was evaluated by means of turbiscan stability index (TSI), which is a parameter that allows to quickly and easily compare the sedimentation trend of suspensions [7]. The sedimentation tests were carried out by means of a multiple light scattering equipment (TurbiscanTM LAB stability Analyzer, Formulaction, France). The test consists of measuring the sedimentation every 1 hour for three days. Also, the density and surface tension of the suspensions were determined using a pycnometer and tensiometer (KRÜSS K12, KRÜSS GmbH, Germany) respectively. The tensiometer operated using a Krüss standard plate and a constant room temperature in all samples. In addition, three repeated tests were performed for each sample and the mean values are averaged. 2.2. Coatings preparation Suspensions were sprayed onto metallic substrates by a plasma torch (F4-MB, Oerlikon Metco, Switzerland) and controlled with a robot (IRB 400, ABB, Switzerland). Before spraying, the metallic substrates with dimensions of Ø 25 mm x 10 mm were grit blasted with black corundum at a constant pressure of 4.2 bars and cleaned in ethanol and ultrasonic bath to remove surface residues. Bond coats (Amdry 997, Sulzer-Oerlikon, Germany) were sprayed by atmospheric plasma spraying under standard conditions set out in a previous research [28] in order to enhance the adhesion between layers. The suspensions feeding was carried out using an injection system developed by the Institute for Ceramic Technology (ITC, Castellón, Spain), which consists in a peristaltic pump to inject the suspensions from the vessels to the plasma gun through a pressure nozzle with a hole size of 150 µm diameter. Before injection, the suspensions were filtered to remove agglomerates larger than 75 µm. Suspension plasma spraying conditions were as follows: 700 A, 37/8 slpm of argon and hydrogen flow rates respectively, 1.25 m/s torch scan speed, 22 ml/min suspensions flow rate, 40 mm stand-off distance and to further. 7.
(8) adherence enhancement the substrates were preheated at 573 K. These conditions have been stablished on the basis of previous research [6,29]. 2.3. Coatings microstructure characterization 2.3.1 Morphological characterization The microstructure of multicomponent coatings was examined in surface and crosssection with a field-emission scanning electron microscope (Quanta 200FEG, FEI Company, USA). To improve the quality of the analysis, the cross-sectional coatings were prepared by standardized metallographic procedure (cutting, mounting and polishing) using a semiautomatic polishing machine (Tegramin-25, Struers, Denmark). Statistical analysis of column (cauliflower-like agglomerate) size features in coatings microstructure was performed using an image analysis software (Microimage analysis) from surface SEM images. Each histogram and column diameter were estimated from more than 100 measurements of the cauliflower-like agglomerates on the coating surface. Therefore, it allows representative and repeatable statistical results to be presented. However, the accurate determination of the mean column (cauliflower) diameters must be performed with some care, as the results may be affected by the magnification and low contrast observed between the columns. The evaluation of thickness, porosity and resolidifed particles distribution in the coatings was also performed by analysing (Microimage analysis) more than 15 micrographs of the cross-sectional images of coatings and averaging the results. 2.3.2 Phase composition characterization Crystalline phases composition of the coatings was evaluated by X-ray diffraction analysis using an advance diffractometer (Bruker Theta-Theta, Germany) which operated under previously mentioned conditions [6]. Rietveld refinement analysis to quantify the. 8.
(9) different crystalline phases in the coating was carried out with DIFFRACplus TOPAS software supplied by BRUKER [30]. 2.4. Thermal diffusivity analysis Thermal conductivity of ceramic layers was calculated by means of a xenon flash lamp equipment (LFA467 HT Hyperflash, Netzsch-Gerätebau GmbH, Selb, Germany) which determines the thermal diffusivity of coatings (10 mm x 10 mm square samples cut from the coatings). The thermal conductivity was measured at 1000 ºC and it was calculated using Proteus analysis software (Netzsch-Gerätebau GmbH, Selb, Germany) from the measured diffusivity of the complete coating system and theoretical data (Cp) and experimental data (dimensions and thickness) from the individual materials that compose each layer [8]. Moreover, the three-layer model was used to correct the emitted pulse by flash lamp and heat loss between the different layers of the coating [31]. In this method, the light beam, which is generated by xenon lamp, heats the lower sample surface and an infrared detector measures the temperature increase on the upper sample surface. Moreover, to improve the signal of the radiation emitted by the coating, a thin layer of graphite was deposited on both sides of the coating. Argon gas is used to prevent oxidation of the sample at high temperatures. The equation for correlating the thermal diffusivity to the thermal conductivity is 𝑘 = 𝜌 · 𝐶𝑝 · 𝛼 where k is the thermal conductivity (W/(m·K)), Cp is the specific heat capacity (J·kg−1·K−1) at a certain temperature and constant pressure, 𝜌 is the density of the coatings (kg/m³) and α is the thermal diffusivity (m²/s). The density of the coatings was obtained from the following equation: 𝜌 = 𝜌𝑡ℎ𝑒𝑜𝑟𝑒𝑡𝑖𝑐𝑎𝑙 · (1 − 𝑃/100);. 9.
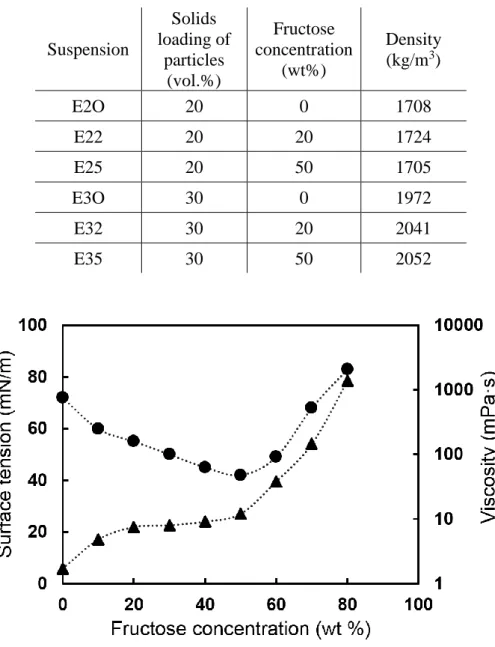
(10) where 𝜌𝑡ℎ𝑒𝑜𝑟𝑒𝑡𝑖𝑐𝑎𝑙 is the theoretical density for the coatings and P is the porosity in percentage that was measured by image analysis technique. 3. Results and discussion 3.1 Establishing an optimum range for fructose addition As set out in the introduction, multifunctionality of fructose in ceramic processing together with its high compatibility in aqueous suspensions allow to use this saccharide in large amounts in ceramic suspensions. However, the viscosity of the suspension must be kept below certain limits in order not to compromise the feeding of the suspension into the plasma torch as reported elsewhere [29,32]. For this reason, preliminary experimentation was carried out to determine the effect of fructose addition on water viscosity. Not less important, surface tension of water after the addition of different amounts of fructose was also determined due to the great impact of this property on the suspension injection process and the subsequent droplet formation. Figure 1 shows the change of surface tension and viscosity of fructose dissolutions in distilled water as a function of fructose content. Findings reveal that the addition of fructose decreases the surface tension of water from 71 to a minimum value of 41 mN/m for 50 wt% fructose added. Higher additions of fructose give rise to progressive increase of this property which eventually overcomes the initial value of water. At sufficiently high sugar concentrations, the gradient of solute in the surface layer compared to the interior is usually negative because pure sugar displays poor affinity to the surface resulting in an increase in surface tension [33]. With regard to viscosity (determined at high shear rate value of 1000 s-1) it can be observed that the addition of fructose produces a plateau from 20 to 50 wt% of fructose contents where viscosity is very stable around 8 mPa·s. As observed, for contents higher than 50 wt%, the effect is pretty similar to that observed in surface tension, i.e. a continuous increase of the property as a consequence,. 10.
(11) in this case, of the progressive growth of the effective volume of polymer present in the suspension [34]. Due to the aforementioned limitation of SPS system in terms of viscosity as well as the effect observed on water surface tension two amounts of fructose addition (20 and 50 wt%) were proposed for feedstock formulation in this research. Table 1 shows all the suspension feedstock prepared and the final density of the suspensions.. Table 1: Summary of characteristics of the suspension feedstocks prepared. E2O. Solids loading of particles (vol.%) 20. E22. 20. 20. 1724. E25. 20. 50. 1705. E3O. 30. 0. 1972. E32. 30. 20. 2041. E35. 30. 50. 2052. Suspension. Fructose concentration (wt%). Density (kg/m3). 0. 1708. Figure 1: Evolution of surface tension and viscosity versus fructose concentration in distilled water. 11.
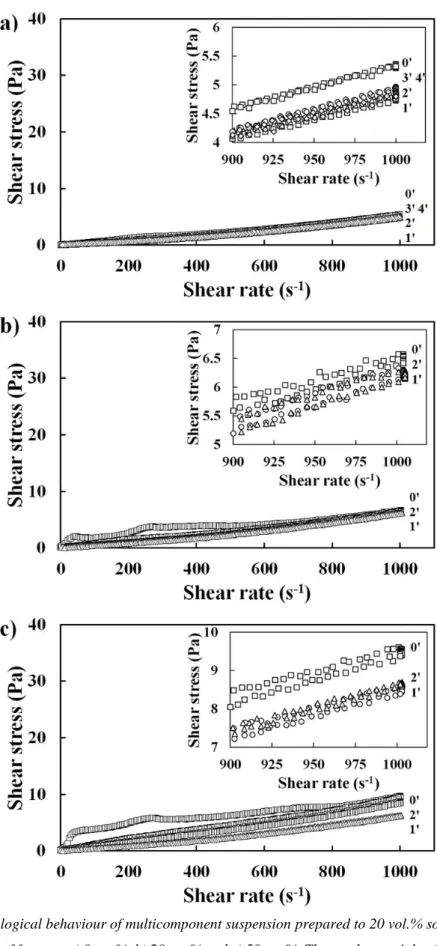
(12) 3.2 Suspension feedstocks characterisation Rheological behaviour of suspensions prepared to 20 vol.% solids without and with the two fructose contents are displayed in Figure 2 (a, b and c for 0, 20, and 50 wt % fructose, respectively). The flow curves show the evolution of shear stress with shear rate for different sonication times and the enlargement of the curves is represented for a better evaluation in the high shear rate range. In Figure 2 a, the flow curves are very similar to those reported in other previous research [28,32], i.e. suspensions show a practically Newtonian behaviour with a little trend of dilatant fluid at high shear rates. This phenomenon which is mostly related to the measuring device in low viscosity suspensions or solutions has been previously reported [35]. On the other hand, suspensions with fructose (Figure 2 b and c) display a similar tendency (Newtonian behaviour). It can be observed that a small cycle of thixotropy appears for suspensions without sonication. The magnitude of the cycle slightly increases with the fructose addition (40, 176 and 264 Pa·s1. for 0, 20 and 50 wt. % of fructose). Nevertheless, the thixotropic cycle disappears when. one minute of ultrasounds is applied. As a consequence, one-minute sonication was established for all suspensions since longer times did not provide any further benefit for the suspensions. The rheological behaviour of suspensions prepared to 30 vol.% solids content adding the same two fructose contents were very similar to that observed in Figure 2 with the only difference that slightly higher viscosities were obtained due to the higher solids content. Hence, for the sake of simplicity they have not been included in this paper.. 12.
(13) Figure 2: Rheological behaviour of multicomponent suspension prepared to 20 vol.% solids with different concentrations of fructose a) 0 wt. %, b) 20 wt. % and c) 50 wt. %. The number at right of each curve shows the sonication time in minutes and inside of graphics a zoom with details of each curve at high shear rates is included.. 13.
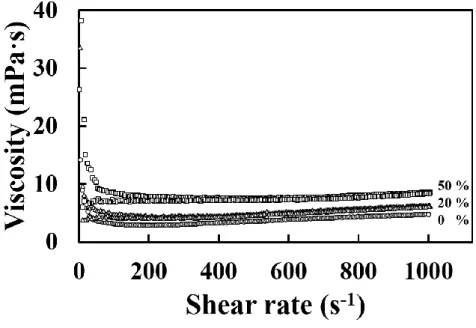
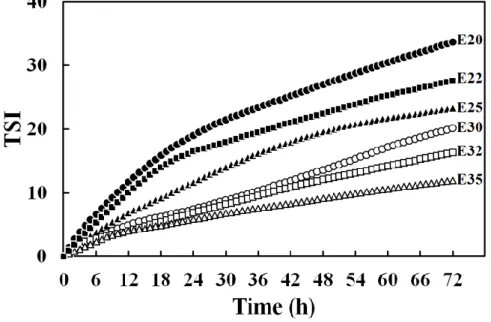
(14) Viscosity curves of one minute-sonicated suspensions with 20 vol. % solids content are plotted in Figure 3. As it can be seen, rheological behaviour close to a Newtonian profile is confirmed. From these curves, viscosities at high shear rate (1000 s-1) were obtained, the values being 4.8, 6.2, and 8.5 mPa·s for 0, 20, and 50 wt % of fructose respectively. In the same way, for the 30 vol. % solids content suspensions viscosity values were 8.5, 11.4, and 17.4 for 0, 20, and 50 wt % of fructose respectively. It can be seen that the addition of fructose duplicates the viscosity of the suspensions, but it maintains always below the critical viscosity of the injection system as set out elsewhere [29].. Figure 3: Comparison of viscosities of multicomponent suspensions with different fructose contents. Circles correspond to 0 wt. % of fructose, triangles correspond to 20 wt. % of fructose and squares correspond to 50 wt. % of fructose.. As seen in Figure 4 the addition of fructose results in a significant decrease of sedimentation rate (TSI) and therefore an increase of the stability of the suspensions as a consequence of the slight rise of suspension viscosity as set out above. The higher the amount of added fructose, the greater the reduction of TSI parameter with time. For the same reason, the increase of solids content from 20 to 30 wt.% favours the stabilisation of the suspension due to the greater electrostatic repulsion between particles, as 14.
(15) previously reported [32]. According to equipment specification, an index value lower than 10 TSI indicates low sedimentation tendency, for this reason an even lower TSI value of 5 has been established in order to estimate an optimum stability time for the SPS process. As observed in Fig.4 the two suspensions containing fructose show stability times longer than 6 hours, which is sufficient for the whole SPS process to occur. Moreover, the prepared suspensions are easily redispersable, recovering their starting characteristics without persistent agglomeration.. Figure 4: Comparison of stability of different suspensions as a function of time by means of turbiscan stability index (TSI).. 3.3 Coatings microstructure characterization Fig. 5 shows the micrographs of the surface of coatings obtained from 20 and 30 vol. % of solids content for the two percentages of fructose tested. A clear effect of fructose addition in the suspension feedstock on the coating surface microstructure can be observed. Thus, when adding fructose the microstructure of the resulting coatings evolves from a surface where the formation of cauliflower-like structures is only insinuated to surfaces where clusters of these structures are completely developed. As previously reported, these surface topographies characterized by cauliflower-like structures crown. 15.
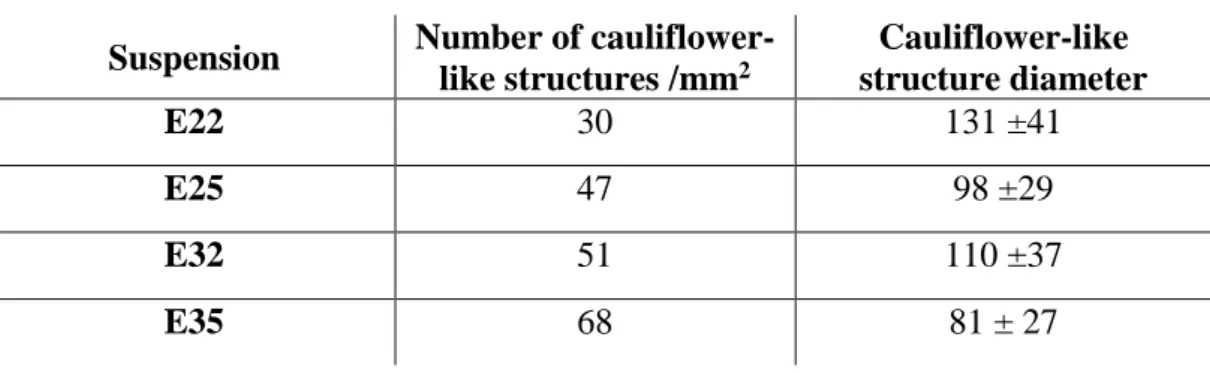
(16) columnar structures inside the coating, as we will see later on [15,16]. As it can be seen, the cauliflower-like topography becomes more pronounced and presents a larger agglomerate average diameter for samples with 20 wt % of added fructose while the coatings obtained from 50 wt % of fructose display smaller size cauliflowers but higher concentration of these structures. These observations can be confirmed by looking at Table 3 data where the surface concentration (number of structures/mm2) and average diameter of the cauliflower-like structures for the coatings obtained from all suspensions containing fructose are shown. This phenomenon could be explained because the addition of fructose into the suspension feedstock provokes a significant reduction of liquid surface tension as observed in Fig.1. This surface tension changes the spraying behaviour of the suspension, resulting in a more homogenous droplet size distribution characterised by greater number of droplets of smaller sizes. Somehow, the effect could be similar to that observed when lower surface tension liquid as ethanol is used as feedstock liquid instead of water as reported by Curry et al. Thus, these authors state that the increase of suspension surface tension when replacing ethanol by water as a solvent dramatically increases atomized droplet size [15]. As postulated by VanEvery et al smaller droplet size in the plasma plume favours the growth of coatings with columnar structure [16]. For the same reason, further amounts of fructose in the starting suspensions (from 20 to 50 wt%) will result in lower surface tension liquid and consequently larger amount of fed droplets of smaller sizes. As observed in the micrographs (Fig.5) and Table 2 50 wt, % fructose coatings display greater number of cauliflower-like microstructures but of smaller size. This observation can be also confirmed by determining the diameter distribution of cauliflower-like microstructures as can be seen in the histograms inserted in the surface images of the. 16.
(17) coatings. Thus, 20 wt% samples show wider distributions and coarser cauliflower diameters when compared with 50 wt% samples. On the other hand, when the solids content of the suspension feedstock increases (from 20 vol.% to 30 vol.%) for the two amounts of fructose, it is observed that there is a higher number of cauliflower microstructures, but with a smaller average diameter (see also Table 2). This finding contrasts with that observed in the literature where it is reported that higher solids content suspensions are expected to produce larger droplet sizes which lead to less structured coatings [15,16]. The reason for this unexpected finding could be related to the fact that higher solids content suspensions also have greater concentration of fructose since the amount added is referred to the solids content. This way, a further effect of fructose can be expected which could, in some extent, compensate the increase in solids content.. Table 2: Surface concentration (number of structures/mm2) and average diameter of the cauliflower-like structures for the coatings obtained from all suspensions containing fructose (E22, E25, E32 and E35).. E22. Number of cauliflowerlike structures /mm2 30. Cauliflower-like structure diameter 131 ±41. E25. 47. 98 ±29. E32. 51. 110 ±37. E35. 68. 81 ± 27. Suspension. 17.
(18) Figure 5: Surface SEM images of coatings sprayed from aqueous suspensions prepared to 20 and 30 vol.% of solids and different fructose contents. Inside the pictures a histogram plotting the diameter distribution of cauliflower-like microstructures is also shown.. The cross-sectional micrographs displayed in Fig. 6 show the columnar structure features developed in many SPS coatings. This is a typical microstructure in which lamellae form columnar structures topped with cauliflower-like build-up as seen above [15,16]. As reported by VanEvery et al, the mechanism for generation of columnar coatings relates to the appearance of small in-flight particles once the solvent has evaporated [16]. Thus, these authors proposed a microstructure transition from planar (APS-like) to columnar 18.
(19) coatings as average impacting particle size decreases. As observed in Fig.6, non-fructose coatings show a continuous layer of Y-ZTP/Al2O3/SiC where neither cracks nor columns are visible whereas the coatings where fructose is added clearly display a columnar structure growth. In addition, as it can be also observed in Fig.6 for coatings with 20 wt% fructose added, the structure appears more compact, and the columns are wider with intercolumnar voids little pronounced. Whereas, in the coatings with 50 wt% added fructose there is a higher number of columns, although they are narrower with deeper intercolumnar voids which achieve in some extent the same bond coat. These findings agree with those reported by Ganvir et al in a very interesting, recent paper where these authors highlighted the effect of suspension characteristics, in particular surface tension, on the final coating microstructure. Thus, in this paper the authors evinced that the increase of suspension surface tension when using water or even a 50/50 ethanol-water mixture as feedstock solvents instead of pure ethanol was directly responsible for not obtaining a columnar microstructure [36]. Then, when comparing Figs. 5 and 6 a connection between the surface cauliflower-like structures with the columnar structure growth inside the coatings can be established as reported elsewhere [15,16,37]. Hence, as the amount of fructose added to the suspension feedstock increases coatings display greater number of cauliflower-like microstructures of smaller size which lead to a more developed columnar structure in the coatings. As set out above, the effect becomes more pronounced as the solids content rises. These results show, for the first time, that the use of a biocompound such as fructose can play an important role when designing the microstructure of SPS coatings. And much more important, incorporating fructose in the suspension feedstock allowed to develop columnar microstructure coating in water-based highly concentrated systems.. 19.
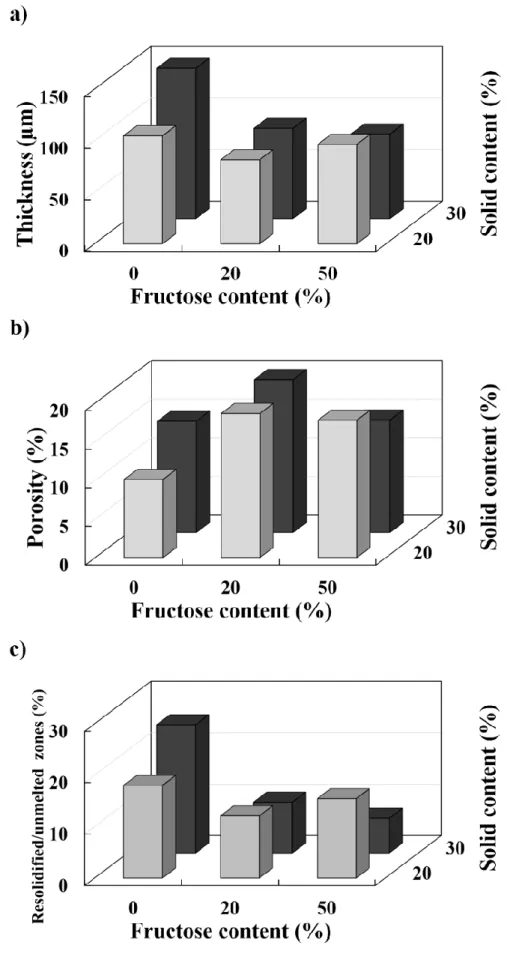
(20) Figure 6: Cross-section SEM images of coatings sprayed from aqueous suspensions prepared to 20 and 30% wt. of solids with different fructose content.. The thickness, porosity, and percentage of resolidified/unmelted zones in the coatings determined by image analysis are shown in 3D diagrams in Fig 7 (a, b, and c). As observed in Fig.7a, thickness is strongly influenced by the addition of fructose. There is a diminution in coating thickness when increasing the amount of fructose added. This thickness reduction is very noticeable when comparing coatings without fructose and with 20 wt% addition since the thickness decreases from 105 µm to 81 µm in the case of coatings obtained from 20 vol.% solids content feedstock and from 146 µm to 88 µm in those deposited from 30 vol.% suspension. This decrease in thickness in the coating with added fructose may be mainly due to the decrease in the mass ratio of the deposited feedstock suspension as a consequence of the fructose breakdown. However, other 20.
(21) variables should be affecting since there is not a clear relationship between amount of added fructose and final coating thickness. Fig.7b shows that, overall, coating porosity increases by adding fructose. This fact is in accordance with the porosity former functionality of fructose as described in literature [20–22]. Nevertheless, coatings prepared from suspensions containing 50 wt% fructose do not follow the increasing tendency, particularly the coating deposited from the higher solids content suspension (30 vol.%). This behaviour may be mainly due to the highly developed columnar microstructure where a greater number of narrow columns and intercolumnar voids are formed replacing closed voids inside the coating. Finally, Fig. 7c shows how the addition of fructose in the feedstock suspension greatly decreases the amount of resolidified/unmelted zones. The diminution is especially significant for 30 vol.% coatings, from 24.9% (without fructose) to 9.9% (20 wt% fructose) and 6.7% (50 wt% fructose). This tendency may be probably related to the effect of fructose on surface tension of the feedstock liquid as set out in section 3.1. Thus, the addition of fructose drastically reduces the surface tension of water resulting in a more homogeneous, smaller average droplet size distribution feeding into the plasma torch. This more homogeneous distribution favours a better build-up of molten droplets inside the core zone of the plasma plume. As a consequence, there is a decrease in the amount of suspension droplets that reach the substrate surface in a poor melting state from the plasma fringe, therefore resolidified/unmelted zones formation is diminished [38]. Additionally, an enthalpy increase of plasma plume associated with fructose burnout should not be underestimated [39].. 21.
(22) Figure. 7. Microstructural. properties. of. coatings:. c) resolidified/unmelted particles zones.. 22. a). thickness,. b). porosity,. and.
(23) 3.4 Phase distribution X-ray diffraction patterns of the coatings sprayed from 20 vol. solids content suspensions with the two-different fructose content are shown in Fig 8. Similar patterns were observed for the 30 vol. % suspension series; therefore, they have not been included. As it can be seen there are almost no variations in the developed crystalline phases of coatings regardless of their fructose content. As previously reported [32] the main crystalline phases observed in the coatings were maintained regarding the feedstock with minimal variations of tetragonal zirconia and corundum, with the exception of the monoclinic zirconia phase, which tends to disappear upon contact with the plasma torch. However, an increase in the crystallinity (full width at half maximum of tetragonal zirconia peaks decrease) of the main phase (tetragonal zirconia) can be observed as the fructose content grows. This crystallinity enhancement could be, in some extent, related to the effect of fructose reported in the literature [25] which favours the development of tetragonal zirconia crystalline phase while the drastic change in the coating structure could also affect. As previously reported [32], SiC was quantified by Rietveld analysis in the highest intensity peak at d = 35.65º Å in order to estimate the amount of preserved SiC in the final coatings. Rietveld method reveals that remaining percentage of silicon carbide is about 50% in all the coatings (with and without fructose) indicating that fructose content in the suspension feedstock does not appear to affect to the decomposition of the SiC. Moreover, no crystalline silica peaks are observed in the diffractograms which is consistent with the previously reported data.. 23.
(24) Figure 8: X-ray diffraction diagram of the coatings obtained from 20 vol.% suspensions with a) 0 wt %, b) 20 wt %. and c) 50 wt % of fructose.. Figure 9: Thermal conductivity of 20 vol.% suspension feedstock with different fructose content.. The thermal conductivity values of the samples are shown in figure 9. It can be seen that thermal conductivity decreases when fructose was added (1.6, 1.4, and 1.3 for 0, 20, and 50 wt % fructose respectively for 20 vol.% solids content feedstock). The decrease in conductivity is related to the microstructural modifications of the coatings analysed, in which the porosity and columnar structure are key parameters according to the literature 24.
(25) [12,15]. As observed in Fig 5, a transition from a continuous (planar) to a columnar microstructure has been described, particularly when the first amount of fructose (20 wt%) is incorporated while at the same time this addition also produces an increase in porosity, as seen in figure 7. The lower differences in microstructure as well as the nonlinear effect of fructose on porosity of 20 and 50 wt % fructose coatings could in turn explain the non-linear effect in the decrease of thermal conductivity. On the other hand, the relatively high thermal conductivity of the coatings when comparing with standard tetragonal-YSZ coatings may be due to the multicomponent character of the suspensions where alumina and principally, silicon carbide display relatively high thermal conductivity. 4. Conclusions Suspensions feedstocks containing fructose have been employed for the first time for SPS deposition. High concentration aqueous suspensions with 20 and 30 vol.% solids content have been prepared. Two contents of fructose (20 and 50 wt%) have been added to these suspensions. Thus, the effect of fructose on the microstructure of a novel YTZP/Al2O3/SiC multicomponent coating was observed. Firstly, an optimisation of the rheological behaviour of suspensions was carried out. It was observed that the addition of fructose hardly affected the rheological behaviour of the suspensions while a strong decrease in the surface tension of water occurred. Moreover, suspension stability was always improved with the addition of fructose. Secondly, addition of fructose to suspension feedstocks resulted in drastic changes of coating microstructures. Specifically, fructose favoured the growth of the columnar structure, which become more evident as the amount of fructose and solids content in the suspension grew. This effect can be associated to the more homogeneous, smaller average droplet size distribution of the suspension feeding into the plasma torch as a consequence. 25.
(26) of the reduction of surface tension of the liquid caused by fructose addition. Moreover, coatings obtained from feedstocks containing fructose were thinner and more porous owing to the pore forming effect of fructose. More interestingly, the addition of fructose gave rise to coatings with smaller amount of resolidified/unmelted areas due to the aforementioned better distribution of molten droplets inside the core zone of the plasma plume. XRD patterns showed that fructose increased the crystallinity of the tetragonal zirconia phase of the coatings as prognosticated in the literature. On the other hand, the measurement of thermal conductivity demonstrated the improvement that occurs when fructose is added to feedstock suspensions due to the modification of microstructural parameters such as porosity and columnar structure. In conclusion, this preliminary work about fructose incorporation in suspension feedstocks can be an useful research to open new strategies for microstructure design in SPS coatings. And much more important, the findings have shown the possibility of developing columnar microstructures in water-based SPS coatings.. 26.
(27) Acknowledgements This work has been supported by the Spanish Ministry of Economy, Industry and Universities and FEDER Funds under the Grant no. MAT2015-67586-C3-R and the Research Promotion Plan of the University Jaume I for the predoctoral fellowship (ref. PREDOC/2107/51).. References [1]. E. Bakan, R. Vaßen, Ceramic top coats of plasma-sprayed thermal barrier coatings: materials, processes, and properties, J. Therm. Spray Technol. 26 (2017) 992–1010. doi:10.1007/s11666-017-0597-7.. [2]. C.U. Hardwicke, Y.-C. Lau, Advances in Thermal Spray Coatings for Gas Turbines and Energy Generation: A Review, J. Therm. Spray Technol. 22 (2013) 564–576. doi:10.1007/s11666-013-9904-0.. [3]. M. Saremi, Z. Valefi, Thermal and mechanical properties of nano-YSZ–Alumina functionally graded coatings deposited by nano-agglomerated powder plasma spraying, Ceram. Int. 40 (2014) 13453–13459. doi:10.1016/J.CERAMINT.2014.05.068.. [4]. V. Viswanathan, G. Dwivedi, S. Sampath, Multilayer, multimaterial thermal barrier coating systems: Design, synthesis, and performance assessment, J. Am. Ceram. Soc. 98 (2015) 1769–1777. doi:10.1111/jace.13563.. [5]. R. Vassen, A. Stuke, D. Stöver, Recent developments in the field of thermal barrier coatings, J. Therm. Spray Technol. 18 (2009) 181–186. doi:10.1007/s11666-009-9312-7.. [6]. V. Carnicer, M.J. Orts, R. Moreno, E. Sánchez, Microstructure assessment of suspension plasma spraying coatings from multicomponent submicronic YTZP/Al2O3/SiC particles, Ceram. Int. 44 (2018) 12014–12020. 27.
(28) doi:10.1016/j.ceramint.2018.03.186. [7]. A. Feuerstein, J. Knapp, T. Taylor, A. Ashary, A. Bolcavage, N. Hitchman, Technical and economical aspects of current thermal barrier coating systems for gas turbine engines by thermal spray and EBPVD: A review, J. Therm. Spray Technol. 17 (2008) 199–213. doi:10.1007/s11666-007-9148-y.. [8]. N. Curry, K. VanEvery, T. Snyder, N. Markocsan, Thermal Conductivity Analysis and Lifetime Testing of Suspension Plasma-Sprayed Thermal Barrier Coatings, Coatings. 4 (2014) 630–650. doi:10.3390/coatings4030630.. [9]. Y. Zhao, D. Li, X. Zhong, H. Zhao, L. Wang, F. Shao, C. Liu, S. Tao, Thermal shock behaviors of YSZ thick thermal barrier coatings fabricated by suspension and atmospheric plasma spraying, Surf. Coatings Technol. 249 (2014) 48–55. doi:10.1016/J.SURFCOAT.2014.03.046.. [10] W. Fan, Y. Bai, Review of suspension and solution precursor plasma sprayed thermal barrier coatings, Ceram. Int. 42 (2016) 14299–14312. doi:10.1016/J.CERAMINT.2016.06.063. [11] M. Gupta, N. Markocsan, X.-H. Li, R.L. Peng, Improving the lifetime of suspension plasma sprayed thermal barrier coatings, Surf. Coatings Technol. 332 (2017) 550–559. doi:10.1016/J.SURFCOAT.2017.07.078. [12] B. Bernard, A. Quet, L. Bianchi, V. Schick, A. Joulia, A. Malié, B. Rémy, Effect of Suspension Plasma-Sprayed YSZ Columnar Microstructure and Bond Coat Surface Preparation on Thermal Barrier Coating Properties, J. Therm. Spray Technol. 26 (2017) 1025–1037. doi:10.1007/s11666-017-0584-z. [13] A. Ganvir, N. Curry, N. Markocsan, P. Nyl??n, F.L. Toma, Comparative study of suspension plasma sprayed and suspension high velocity oxy-fuel sprayed YSZ thermal barrier coatings, Surf. Coatings Technol. 268 (2015) 70–76.. 28.
(29) doi:10.1016/j.surfcoat.2014.11.054. [14] B. Bernard, A. Quet, L. Bianchi, A. Joulia, A. Malié, V. Schick, B. Rémy, Thermal insulation properties of YSZ coatings: Suspension Plasma Spraying (SPS) versus Electron Beam Physical Vapor Deposition (EB-PVD) and Atmospheric Plasma Spraying (APS), Surf. Coatings Technol. 318 (2017) 122– 128. doi:10.1016/j.surfcoat.2016.06.010. [15] N. Curry, K. VanEvery, T. Snyder, J. Susnjar, S. Bjorklund, Performance Testing of Suspension Plasma Sprayed Thermal Barrier Coatings Produced with Varied Suspension Parameters, Coatings. 5 (2015) 338–356. doi:10.3390/coatings5030338. [16] K. Vanevery, M.J.M. Krane, R.W. Trice, H. Wang, W. Porter, M. Besser, D. Sordelet, J. Ilavsky, J. Almer, Column formation in suspension plasma-sprayed coatings and resultant thermal properties, J. Therm. Spray Technol. 20 (2011) 817–828. doi:10.1007/s11666-011-9632-2. [17] S. Çinar, L. van Steenhuyse, M. Akinc, Elucidation of Viscosity Reduction Mechanism of Nano Alumina Suspensions with Fructose Addition by DSC, J. Am. Ceram. Soc. 96 (2013) 1077–1084. doi:10.1111/jace.12232. [18] C. Li, M. Akinc, Role of Bound Water on the Viscosity of Nanometric Alumina Suspensions, J. Am. Ceram. Soc. 88 (2005) 1448–1454. doi:10.1111/j.15512916.2005.00339.x. [19] P. Falkowski, M. Szafran, Role of molecular structure of monosaccharides on the viscosity of aqueous nanometric alumina suspensions, Ceram. Int. 42 (2016) 8572–8580. doi:10.1016/j.ceramint.2016.02.085. [20] E. Gregorová, W. Pabst, Z. Sofer, O. Jankovský, J. Matějíček, Porous alumina and zirconia ceramics with tailored thermal conductivity, J. Phys. Conf. Ser. 395. 29.
(30) (2012). doi:10.1088/1742-6596/395/1/012022. [21] R.K. Nishihora, P.L. Rachadel, M.G.N. Quadri, D. Hotza, Manufacturing porous ceramic materials by tape casting—A review, J. Eur. Ceram. Soc. 38 (2018) 988– 1001. doi:10.1016/j.jeurceramsoc.2017.11.047. [22] J.H. Yim, H.D. Jeong, L. Sun Pu, The preparation of nanoporous siloxane films using saccharide derivatives as new porogen, Thin Solid Films. 476 (2005) 46– 50. doi:10.1016/j.tsf.2004.09.005. [23] P. Wiecinska, A. Wieclaw, F. Bilski, Selected sugar acids as highly effective deflocculants for concentrated nanoalumina suspensions, J. Eur. Ceram. Soc. 37 (2017) 4033–4041. doi:10.1016/j.jeurceramsoc.2017.05.037. [24] A. Ganvir, C. Kumara, M. Gupta, P. Nylen, Thermal Conductivity in Suspension Sprayed Thermal Barrier Coatings: Modeling and Experiments, J. Therm. Spray Technol. 26 (2017) 71–82. doi:10.1007/s11666-016-0503-8. [25] F. Heshmatpour, R.B. Aghakhanpour, Synthesis and characterization of nanocrystalline zirconia powder by simple sol-gel method with glucose and fructose as organic additives, Powder Technol. 205 (2011) 193–200. doi:10.1016/j.powtec.2010.09.011. [26] M. Montero, T. Molina, M. Szafran, R. Moreno, M.I. Nieto, Alumina porous nanomaterials obtained by colloidal processing using d-fructose as dispersant and porosity promoter, Ceram. Int. 38 (2012) 2779–2784. doi:10.1016/j.ceramint.2011.11.048. [27] P. Falkowski, P. Bednarek, A. Danelska, T. Mizerski, M. Szafran, Application of monosaccharides derivatives in colloidal processing of aluminum oxide, J. Eur. Ceram. Soc. 30 (2010) 2805–2811. doi:10.1016/J.JEURCERAMSOC.2010.03.003.. 30.
(31) [28] V. Carnicer, C. Alcazar, E. Sánchez, R. Moreno, Aqueous suspension processing of multicomponent submicronic Y-TZP/Al2O3/SiC particles for suspension plasma spraying, J. Eur. Ceram. Soc. 38 (2018) 2430–2439. doi:10.1016/j.jeurceramsoc.2018.01.006. [29] P. Carpio, M.D. Salvador, A. Borrell, E. Sánchez, R. Moreno, Alumina-zirconia coatings obtained by suspension plasma spraying from highly concentrated aqueous suspensions, Surf. Coatings Technol. 307 (2016) 713–719. doi:10.1016/j.surfcoat.2016.09.060. [30] A.L. Ortiz, F. Sánchez-Bajo, N.P. Padture, F.L. Cumbrera, F. Guiberteau, Quantitative polytype-composition analyses of SiC using x-ray diffraction: A critical comparison between the polymorphic and the Rietveld methods, J. Eur. Ceram. Soc. 21 (2001) 1237–1248. doi:10.1016/S0955-2219(00)00332-0. [31] T. Baba, A. Ono, Improvement of the laser flash method to reduce uncertainty in thermal diffusivity measurements, Meas. Sci. Technol. 12 (2001) 2046–2057. doi:10.1088/0957-0233/12/12/304. [32] E.S. V. Carnicer, M.J. Orts, R. Moreno, Influence of solids concentration on the microstructure of suspension plasma sprayed Y-TZP/Al2O3/SiC composite coatings, Surf. Coatings Technol. (n.d.). [33] B. Adhikari, T. Howes, A. Shrestha, B.R. Bhandari, Effect of surface tension and viscosity on the surface stickiness of carbohydrate and protein solutions, J. Food Eng. 79 (2007) 1136–1143. doi:10.1016/j.jfoodeng.2006.04.002. [34] E.R. Morris, A.N. Cutler, Carbohydrate Polymers 1 (1981) 5-21 CONCENTRATION AND SHEAR RATE DEPENDENCE OF VISCOSITY IN RANDOM COIL POLYSACCHARIDE SOLUTIONS, 1 (1981) 5–21. [35] R. Moreno Botella, Reología de suspensiones cerámicas, Consejo Superior de. 31.
(32) Investigaciones Científicas, Madrid, 2005. [36] A. Ganvir, R.F. Calinas, N. Markocsan, N. Curry, S. Joshi, Experimental visualization of microstructure evolution during suspension plasma spraying of thermal barrier coatings, J. Eur. Ceram. Soc. 39 (2018) 470–481. doi:10.1016/j.jeurceramsoc.2018.09.023. [37] B. Bernard, L. Bianchi, A. Malié, A. Joulia, B. Rémy, Columnar suspension plasma sprayed coating microstructural control for thermal barrier coating application, J. Eur. Ceram. Soc. 36 (2016) 1081–1089. doi:10.1016/j.jeurceramsoc.2015.11.018. [38] A. Joulia, G. Bolelli, E. Gualtieri, L. Lusvarghi, S. Valeri, M. Vardelle, S. Rossignol, A. Vardelle, Comparing the deposition mechanisms in suspension plasma spray (SPS) and solution precursor plasma spray (SPPS) deposition of yttria-stabilised zirconia (YSZ), J. Eur. Ceram. Soc. 34 (2014) 3925–3940. doi:10.1016/j.jeurceramsoc.2014.05.024. [39] B. Wang, L. Zeng, W. Huang, F.S. Melkonyan, W.C. Sheets, L. Chi, M.J. Bedzyk, T.J. Marks, A. Facchetti, Carbohydrate-Assisted Combustion Synthesis to Realize High-Performance Oxide Transistors, J. Am. Chem. Soc. 138 (2016) 7067–7074. doi:10.1021/jacs.6b02309.. 32.
(33) Tables Table 1: Summary of characteristics of the suspension feedstocks prepared................. 11 Table 2: Surface concentration (number of structures/mm2) and average diameter of the cauliflower-like structures for the coatings obtained from all suspensions containing fructose (E22, E25, E32 and E35). ................................................................................. 17. Figure captions Figure 1: Evolution of surface tension and viscosity versus fructose concentration in distilled water ................................................................................................................. 11 Figure 2: Rheological behaviour of multicomponent suspension prepared to 20 vol.% solids with different concentrations of fructose a) 0 wt. %, b) 20 wt. % and c) 50 wt. %. The number at right of each curve shows the sonication time in minutes and inside of graphics a zoom with details of each curve at high shear rates is included. .................. 13 Figure 3: Comparison of viscosities of multicomponent suspensions with different fructose contents. Circles correspond to 0 wt. % of fructose, triangles correspond to 20 wt. % of fructose and squares correspond to 50 wt. % of fructose. ............................... 14 Figure 4: Comparison of stability of different suspensions as a function of time by means of turbiscan stability index (TSI). ................................................................................... 15 Figure 5: Surface SEM images of coatings sprayed from aqueous suspensions prepared to 20 and 30 vol.% of solids and different fructose contents. Inside the pictures a histogram plotting the diameter distribution of cauliflower-like microstructures is also shown. ............................................................................................................................. 18 Figure 6: Cross-section SEM images of coatings sprayed from aqueous suspensions prepared to 20 and 30% wt. of solids with different fructose content. ........................... 20. 33.
(34) Figure 7 Microstructural properties of coatings: a) thickness, b) porosity, and. c). resolidified/unmelted particles zones. ............................................................................ 22 Figure 8: X-ray diffraction diagram of the coatings obtained from 20 vol.% suspensions with a) 0 wt %, b) 20 wt %. and c) 50 wt % of fructose................................................ 24 Figure 9: Thermal conductivity of 20 vol.% suspension feedstock with different fructose content. ........................................................................................................................... 24. 34.
(35)
Figure
+6


Documento similar
H I is the incident wave height, T z is the mean wave period, Ir is the Iribarren number or surf similarity parameter, h is the water depth at the toe of the structure, Ru is the
Penelitian ini bertujuan untuk mendapatkan asal daerah bahan baku yang terbaik untuk pembuatan sirup gula kelapa dan untuk mendapatkan konsentrasi arang aktif yang
In the previous sections we have shown how astronomical alignments and solar hierophanies – with a common interest in the solstices − were substantiated in the
As can be derived by comparing the FE-SEM images of Figure 3, corresponding to hollow magnetite microspheres, with that obtained after deposit- ing a silica layer on the surface
The different types of cracks were identified by SEM inside the coating microstructure namely; inner microcracks and segmentation cracks associated with splat
Mazarío, “Effect of the surface charge on the adsorption capacity of chromium (VI) of iron oxide magnetic nanoparticles prepared by microwave-assisted synthesis,”.
On the other hand, placing the biased Mo mesh between the CH 4 distribution ring and the substrate holder leads to even lower metal contents in the deposited coatings due to the
Two series of coatings (using two different peak powers) were deposited with increasing V content, in order to evaluate the effect of V addition on the surface and cross
