Accepted Manuscript
Research Paper3D numerical modelling and experimental validation of an asphalt solar collec-tor
Alejandro Alonso-Estébanez, Pablo Pascual-Muñoz, José Luis Sampedro-García, Daniel Castro-Fresno
PII: S1359-4311(17)31022-0
DOI: http://dx.doi.org/10.1016/j.applthermaleng.2017.07.127
Reference: ATE 10795
To appear in: Applied Thermal Engineering Received Date: 15 February 2017
Revised Date: 6 July 2017 Accepted Date: 17 July 2017
Please cite this article as: A. Alonso-Estébanez, P. Pascual-Muñoz, J. Luis Sampedro-García, D. Castro-Fresno, 3D numerical modelling and experimental validation of an asphalt solar collector, Applied Thermal Engineering (2017), doi: http://dx.doi.org/10.1016/j.applthermaleng.2017.07.127
This is a PDF file of an unedited manuscript that has been accepted for publication. As a service to our customers we are providing this early version of the manuscript. The manuscript will undergo copyediting, typesetting, and review of the resulting proof before it is published in its final form. Please note that during the production process errors may be discovered which could affect the content, and all legal disclaimers that apply to the journal pertain.
1
3D numerical modelling and experimental validation of an asphalt
solar collector
Alejandro Alonso-Estébanez a, Pablo Pascual-Muñoz b *, José Luis Sampedro-García c, Daniel Castro-Fresno d a
GITECO Research group, University of Cantabria, Santander, Spain. Email: [email protected]
b
GITECO Research group, University of Cantabria, Santander, Spain. Email: [email protected]
c
GITECO Research group, University of Cantabria, Santander, Spain. Email: [email protected]
d
GITECO Research group, University of Cantabria, Santander, Spain. Email: [email protected] * Corresponding author
Abstract
Research about renewable technologies for thermal energy collection is crucial when critical problems such as climate change, global warming or environmental pollution are concerned. Transforming solar energy into thermal energy by means of asphalt solar collectors might help to reduce greenhouse gas emissions and fossil fuel consumption. In this paper, a laboratory-scale asphalt solar collector formed by different slabs has been characterized by applying numerical techniques. An experimental test where the thermal performance of the collector was determined for three values of heat exchange fluid flow rate was carried out for the validation of the numerical model. Then, the CFD model was used to analyse the thermal response of the collector according to the following parameters: flow rate, solar irradiance, size and thickness. Results show that increasing values of heat exchange fluid flow rate result in better thermal performances. Likewise, increasing values of irradiance and size of the collector lead to higher values of thermal performance, although other parameters should also be considered for the final design of the system. Finally, under the conditions here considered, the thickness of the collector turned out not to be as significant as expected in relation to its thermal response. The combination of experimental tests and CFD codes can be considered a powerful tool for the characterization of asphalt solar collectors without incurring significant costs related to experimental field tests.
Keywords: numerical analysis; CFD; asphalt collector; solar energy collection; thermal performance.
1. Introduction
The adverse effect of GHG emissions and the depletion of conventional non-renewable energy resources are worldwide issues that generate great concern [1]. For this reason, many countries have strongly stimulated different policies to develop technologies able to generate more and more renewable and clean energy. Among the renewable energy sources, solar energy can be considered as one of the most important green technologies considering its huge potential: the solar energy rate is very close to twice the Earth’s consumption rate of fossil energy [2]. Asphalt solar collectors (ASC) have received special attention in the last few years [3,4,5,6,7,8] due to both the great surface existing
2
worldwide that might be used for this purpose [9] and to the suitable heat absorbing properties of asphalt surfaces [10].
Different solutions have been proposed to harvest solar energy by means of an asphalt collector, from devices using pipes through which the heat exchange fluid, water in this case, flows [5], to those making use of a highly porous asphalt layer between two impermeable layers [11], including technologies where the heat exchange fluid is air instead of water [12]. Besides, several parameters of the ASC have been tested so far by applying experimental, analytical or numerical techniques, including geometrical properties [9,13,14,15], technical properties [16,17,18] and operational conditions [5,11,19,20].
Although an ASC may actually exhibit a lower thermal energy potential compared to a conventional solar collector, several advantages and applications are provided by asphalt solar collectors that make them suitable for use. When installed within a road pavement, an ASC can reduce the maintenance cost of the road in summer by collecting and storing part of the energy reaching the surface layer, thus decreasing its temperature and reducing the risk of rutting. A decrease of 5 ºC in the surface layer is expected to extend the life cycle of the pavement by up to 5 years [21]. In winter, safety could also be improved [22] by the pavement being de-iced with (part of) the energy harvested in summer, also decreasing the pollution generated by conventional melting systems [19]. The decrease of the average surface temperature due to a generalized use of ASCs would also result in a reduction of the Urban Heat Island (UHI) effect [23,24] and hence, in a reduction of the energy consumption and CO2
emissions from cooling systems [25].
SERSO [26], GAIA [27] or RES [28] are well-known projects where this technology was successfully implemented within road pavements, but because of the above advantages, other structures like façades or roofs were considered for hosting this technology [29,30].
On the other hand, it seems that a gap exists in the literature about the influence of important thermal exchange processes occurring in the air domain near the surface layer of the collector and within the collector itself. These processes might actually affect the collector’s thermal performance. In order to contribute to this topic, an unsteady 3D numerical model of a modular ASC has been developed, which simultaneously resolves the heat transfer process in both regions by applying the Finite Volume Method (FVM). Thus, the apparent increased complexity of this model as compared to others which have already been published will provide higher accuracy while keeping computational costs within acceptable limits.
Once validated, this model enabled the analysis of some of the main parameters involved in the design of these devices, thus helping in their optimization.
3
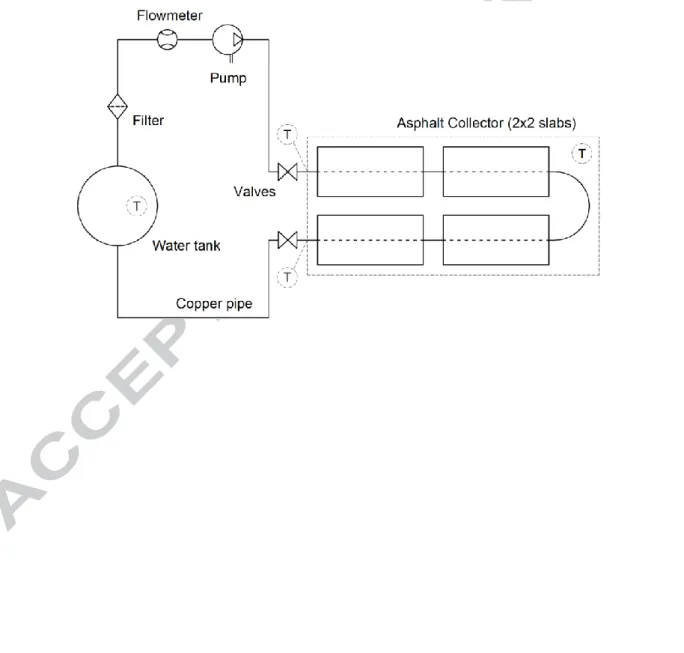
An experimental test was carried out to validate the numerical model here presented. In this case, a 2x2 configuration consisting of four slabs 0.42 m long, 0.13 m wide and 0.06 m thick was selected (Figures 1 and 2). With these dimensions, a total size of the collector of 0.22 m2 was actually considered, and a U-shaped copper pipe 1.7 m in length and 16 mm of inner diameter was embedded at a depth of 25 mm from the surface. The water flows through this pipe removing the energy collected by the asphalt slabs. A dense asphalt mixture containing 4.5% conventional binder (B 50/70) and a continuous fraction of limestone with an 8 mm maximum aggregate size and the minimum possible number of voids was used for the manufacturing of the slabs. The gaps between the slabs, where the fittings enabling easy connection are located, were properly insulated. The bottom and perimeter of the collector were insulated as well. Other elements of the experimental set-up are: pump, water tank for temperature regulation, flowmeter, filter and valves [31].
Four (2x2) special 300W bulbs with a sun-like radiation spectrum were used as irradiance (W/m2) source. These bulbs, whose technical features do not enable the use of rheostatic control, were appropriately arranged in a tailor-made portable steel structure that enabled the variation of the height of the lamps and hence, of the irradiance value. A wide range of applications have made use of this type of bulbs, including chemical compound degradation [32] or the simulation of atmospheric processes [33]. For the measurement of the irradiance on the collector’s surface, a pyranometer was used with spectral range 305 to 2800 nm, measuring range up to 2000 W/m2, temperature range -40 to +80 ºC and sensitivity of 15 μV/(W/m2).
As for the temperature monitoring, flexible type k thermocouples with measuring range -60 to +260 ºC and measurement accuracy of ±1.5 ºC were placed at the collector inlet and outlet as well as in the water tank. The temperature of the collector surface was measured by means of an infrared thermometer with measuring range -50 to 1000 ºC, resolution of 0.1 ºC and accuracy of ±1%. For the ambient temperature and humidity, a thermo-hygrometer was used with measuring range up to 50 ºC/90% RH and accuracy of ±0.8 ºC/±1% RH. It was placed far enough from the lamp in order to avoid direct exposure to much warmer heat sources.
For the tests, an irradiance of 500 W/m2 was set. This is a representative value of the average yearly irradiance (considering only daylight hours) on a horizontal plane in the south of Spain. Three different water flow rates of 1.0, 1.5 and 2.0 l/min were considered and the test duration was set to 8 hours. The following outcomes were determined and used for the validation of the model: temperature gradient ΔT (K), energy harvested (kWh) and thermal efficiency η (%). The energy gained by the heat exchange fluid during the tests was estimated based on the temperature gradient and the flow rate [5,7]. Finally, the efficiency was calculated as the ratio of energy harvested by the collector to energy reaching its top surface [11].
4
In this work, the Computational Fluid Dynamic (CFD) code FLUENT was used for the performance evaluation of an asphalt solar collector. Results from the experimental tests carried out in the laboratory were used for the validation of the numerical model. Then, the model was applied for the evaluation of other parameters, different to those assessed in the laboratory. Additional information about the design of asphalt solar collectors can be obtained with a lower cost than with experimental tests. Specifically, the following parameters were considered for their evaluation: irradiance (W/m2), flow rate (l/min), size of the collector (m2) and thickness of the slabs (m).
3.1.
Mathematical approach and energy balance
In this study, an unsteady analysis, 8 hours long and with a time step of 10 s, was carried out by applying the Finite Volume Method. The equations of conservation of mass, momentum and energy along with a radiation model and viscous model were used to resolve both the heat transfer process and the movement of the participating fluids (water and air). The conservation equations can be written as follows (eq.1), where ϕ is a scalar, t is the time, Ui are the components of the velocity
vector, D is the diffusion coefficient, xi are spatial components and S(ϕ) is the source term. Physical
phenomena represented from left to right are: rate of accumulation, transport by convection, transport by diffusion and source terms. In a 3D Cartesian coordinate system i can take the values 1, 2 and 3.
(1)
In order to calculate the heat transfer occurring by radiation, the model S2S (Surface to Surface) was used. This radiation model has been previously used by other researchers for the numerical analysis of the performance of different conventional solar collectors [34]. The S2S model assumes that the surfaces are grey and diffuse, and therefore the amount of radiation reaching a surface (q) can be reflected (q·ρ), absorbed (q·α) or transmitted (q·τ). As the surfaces are opaque in the model, the transmissivity (τ) is assumed to be null. Finally, the emissivity (ε) is less than one and equal to the absorptivity (α) on account of assuming non-black surfaces.
Regarding the energy balance in the asphalt collector, part of the incident radiation reaching the surface is absorbed by the slabs, whereas the rest is reflected back according to the surface albedo. A portion of the absorbed heat is emitted back by radiation while the different temperatures existing in the interphase between the collector surface and the adjacent air results in convection losses. The remaining heat is transferred by conduction to deeper layers until it reaches the pipe, where part of this heat is transferred to the water by convection [5,6].
3.2.
Geometrical domain and boundary conditions
The three-dimensional geometry defined for the numerical simulation to represent the computational domain where the governing equations are solved, is shown in Figure 3. This domain consists of four
5
regions, which are based on the regions participating in the performance of the collector during the experimental tests: air, asphalt mixture, copper pipe and the water inside the pipe. Within the air region, four heat-emitting rounded surfaces were included to simulate the irradiance generated by the solar lamps on the collector surface. The side and top walls of the air region are 20 m away from the heat source, which is enough to avoid their participation in the heat transfer process, as in the experimental test. Slabs and pipe geometries and dimensions are the same as in the experimental set-up. The pipe thickness has been considered in the numerical model for accuracy purposes.
The boundary conditions were established based on the experimental conditions in order to numerically simulate the fluid movement and heat transfer processes exhibited in the laboratory tests (Figure 3). Specifically, the boundary conditions assigned to the surface of the domain studied were the following: inlet velocity, outflow and wall.
Regarding the inlet velocity, the water velocity was set to 1.6 m/s, which corresponds to a water flowrate of 2 l/min. The outflow condition was applied to the water outlet, since the pipe is long enough to reach a fully-developed flow within the collector. Therefore, the values taken by the variables involved in this boundary are calculated based on the values stored in the cells next to this boundary.
Finally, three types of wall boundary conditions are given depending on the thermal properties required: coupled walls, heat source and thermal insulation. The interfaces between the slabs and air or water regions are considered as two-sided walls coupled in such a way that they are not insulated from each other, the variables taking the same values. The solver calculates the heat transfer based on the solution given in adjacent cells, considering the three possible mechanisms: conduction through solids, (coupled with) convective heat transfer in fluids and radiation.
On the other hand, a constant heat condition was defined on the surfaces simulating the irradiance source in such a way that the level of irradiance on the collector surface is the same as in the experimental test. As for the boundaries of the air region in the computational domain and the outer boundaries of the asphalt mix slabs, adiabatic conditions were applied according to the experimental conditions.
3.3.
Materials involved, flow regime and convective domains
The emissivity and absorptivity of the asphalt mixture was set to 0.85. The density, conductivity and specific heat of the asphalt mixtures shown in Table 1 were experimentally determined in the laboratory. Particularly, the specific heat in the appropriate temperature range was determined via differential scanning calorimetry. The properties considered for the copper pipe are also defined in Table 1. The surfaces simulating the irradiance source were considered as a perfect black body.
6
The Reynolds Number (Re) of the water flowing through the pipe with the maximum flow rate tested in the laboratory (2 l/min) lies between 2100 and 4000, which corresponds to a transition region, although it is also close to the laminar regime. In this sense, two additional cases were studied in order to establish which viscous model better represented the experimental conditions. The models tested were the SST and the k-kL-ω transition models. These models show good performance in low Reynolds
regimes and enable the accurate prediction of the transition zone and separation point of the boundary layer. When considering laminar regime, additional transport equations are not required to deal with the numerical simulation. However, when transition models are selected, three and four additional transport equations are solved during the simulation for the k-kL-ω and the SST models, respectively.
Based on the relative error between the experimental procedure and the numerical simulation in the outlet water temperature and the thermal performance of the asphalt collector (Table 2), the laminar regime was considered for the numerical model when the water flow rate is not higher than 2 l/min. As for the convective processes, forced convection heat transfer was neglected by virtue of the indoor nature of the experimental tests. On the other hand, rather higher computational costs and an increasing complexity of the resulting model may be expected if buoyancy is taken into account. For comparison purposes, two different types of simulations were carried out for the validation of the numerical model. In one of them, the effect on the collector’s response of convective air and water streams caused by buoyancy forces was neglected, thus the values of air and water density being set constant (Table 1).
For the second simulation, the buoyancy effect was actually taken into account. The air density was thus modelled according to the incompressible ideal gas law, while the Boussinesq model was adopted to address the variation of water density with temperature. Based on the experimental value of the Rayleigh Number (Ra < 108), the convective stream in the air domain corresponds to a laminar flow. Therefore, a laminar model was used for modelling the viscous behaviour of the fluids in this numerical simulation.
A body-force-weighted scheme was used for the spatial discretization of the pressure. The coupled scheme was applied to resolve the pressure-velocity coupling and a second order discretization scheme was used for the other variables (momentum, turbulence and energy).
3.4.
Mesh configuration
The computational domain has been discretized using tetrahedral elements in the air region and hexahedral elements in the regions of the collector (water, slabs and pipe), but wedges and pyramids were also used (Figure 4). In the fluid regions close to solid surfaces where viscous forces are dominant, the variables involved may exhibit strong gradients. For this reason, an inflation mesh was built that improved the accuracy of the results. This mesh consisted of ten layers of wedge elements with a growth rate of 1.1. The thickness of the first layer was set to obtain a dimensionless distance y+
7
from the solid surfaces not exceeding 1. This thin layer allows the regions of boundary layer close to solid surfaces to be completely defined by using the conservation equations.
The size of the elements in contact with the water-pipe and asphalt-air interfaces was diminished by applying size control. In addition, the curvature regions were also meshed more finely for accuracy purposes. Generally speaking, the accuracy of the results can be improved by using smaller elements, even though a finer mesh would actually increase the computational cost. Moreover, this relationship between accuracy and grid size continues up to a level of mesh refinement after which the accuracy improvement does not compensate the high computational cost. Therefore, a mesh independence study was carried out in order not to waste computational resources. Specifically, the numerical model was solved for the following mesh sizes: 0.8, 1.0, 1.2, 1.4 and 1.5 mill. For this purpose, the buoyancy effect was neglected. In order to evaluate the effect of the grid size on the accuracy of the model, the relative error between experimental and simulation results was obtained according to the following expression: (2)
Figure 5 shows the relative errors obtained both in the thermal performance of the collector and in the outlet water temperature as a function of the number of cells used. As can be seen, an increase in the grid size does not necessarily lead to a significant improvement of the model accuracy. Accordingly, the mesh size was set to 0.8 mill.
4. Results and discussion
Together with the validation of the numerical model proposed, results of temperature gradient, heat gain and thermal performance of the collector per unit of irradiance (W/m2), flow rate (l/min), size (m2) and thickness (mm), are shown and discussed.
4.1.
Influence of the water flow rate and validation of the numerical model
The relation between the accuracy of the simulation and the resources and execution time taken in the computer is something that should be carefully considered. Sometimes the possible deviation occurring due to the difficulty in reproducing some of the experimental conditions (especially concerning fluid dynamics) is not consistent with the use of a very demanding configuration of the numerical model. For this reason, it is very common that assumptions are made to get a robust configuration of the numerical model with the lowest possible computational cost.
Thus, for the validation of the numerical model, a comparison has been made between the experimental results for different flow rates and the results obtained from the simulations with and without taking into account the convective air (and water) streams caused by buoyancy forces.
8
According to the laboratory results shown in Figure 6, the average temperature gradient decreases as the water flow rate increases from 1.0 to 2.0 l/min, even though for higher flow rates the decreasing rate of temperature gradient seems to be less pronounced. With the increase of the flow rate, the water remains less time inside the collector and so the temperature gradient tends to decrease. Nevertheless, the higher heat transfer coefficient between pipes and water due to the presence of turbulence regions might have compensated that unfavourable effect. In agreement with the values of temperature gradient, the energy harvested by the collector increases with the flow rate (although it does it in a non-linear manner), thus resulting in higher performances as the flow rate grows (Figure 7). Similar trends of temperature gradient and thermal performance were obtained by Wu [5] and He [34], respectively, in spite of the different specific results achieved by them due to the different magnitudes considered. As seen in Figure 7, negligible differences have been obtained in terms of the average temperature reached by the collector’s surface for the three values of flow rate studied.
Regarding the validation of the numerical model, the graphs of experimental temperature gradient, heat gain, thermal performance and surface temperature show a good fit with those of the two numerical approaches (Figures 6 and 7). For clarity purposes, the relative errors between the experimental and the numerical results of average temperature gradient and surface temperature are shown in Table 3. Based on these data, a slightly higher deviation exists between the experimental results and the results obtained from the simulation in which buoyancy was taken into account. Reasons for this might be the difficult and resource-consuming integration in the model of elements from the experimental set-up such as the laboratory walls (with presence of doors or holes) or the irradiance source, which is especially significant due to its complexity. Thus, very hot heat-emitting rounded surfaces were included to imitate the bulb’s behaviour, which could have led to an unrealistic rise of temperature in the simulation within the air domain close to the lamp and hence, to an overestimation of the convection effect. A representative picture of the resulting flow field is shown in Figure 8, which corresponds to the end of the simulation at a 2 l/min flow rate. It can be observed how the air flow close to the experimental device goes upwards as a result of its decreasing density, gets cooled and then goes down in agreement with the circular pattern of the convective streams.
On the other hand, the computational time required for the same equipment when the densities of air and water are temperature-dependent is slightly more than 3 times greater than when the values of these densities are set to constant. According to these facts and figures, it seems that a fair estimation of the experimental tests is possible with a much lower computational cost. This would eventually enable a more efficient evaluation of other parameters for the design of ASCs.
Actually, the appropriate operation of an asphalt solar collector, no matter the material it is made of, entails not only a suitable performance but also a high enough outlet water temperature. In this sense, the analysis of other important parameters, such as the size of the collector, the length of the pipe or the irradiance to which it is subjected, is crucial.
9
4.2.
Effect of solar radiation and collector size on the system performance
Given that the size of an asphalt collector and the irradiance on its surface are parameters very closely connected, a combined analysis was carried out through which temperature gradient, heat collection and thermal performance were evaluated per unit of those parameters for a fixed 2 l/min flow rate. It should be noticed that a linear relationship existed between the sizes of the collector (0.11, 0.22 and 0.44 m2), the number of slabs (2, 4 and 8) and the pipe lengths (0.84, 1.68 and 3.36 m) considered for the analysis.
As shown in graph (a) (Figure 9), the temperature gradient increases as the values of irradiance and size increase, except for low values of irradiance (under 300 W/m2), for which the amount of energy reaching the surface of the collector is not sufficient to maintain an increasing rate of temperature gradient per unit of size. Thus, the temperature gradient grows with the collector size for all the values of irradiance over a certain threshold, reaching a maximum for maximum values of irradiance and size. Likewise, increasing values of irradiance and size lead to increasing values of the energy harvested by the asphalt collector, reaching a maximum of 2.1 kWh after eight hours (260 W) when maximum size (≈ 600 W/m2) and irradiance considered for the numerical analysis are applied.
A different approach is required for the interpretation of the results of the thermal performance shown in graph (c) (Figure 9). According to this graph, maximum values of performance of 74% are obtained for high irradiances (≈ 800 W/m2) and medium sizes (≈ 0.27 m2), finding that the performance decreased for higher values of those parameters. This means that for any size of collector, the thermal performance reaches a maximum for a value of irradiance under the maximum value analysed, 1000 W/m2, which is actually very close to the maximum irradiance at the surface on a clear day at solar noon in the summer months. Accordingly, for any value of irradiance, the performance reaches a maximum for a size under the maximum value considered, 0.44 m2. Therefore, from a certain size, the amount of heat collected by the heat exchange fluid (water) is less than the extra energy absorbed by the collector due to its larger size. Likewise, the amount of heat collected by the water for irradiances over a certain value is less than the extra energy absorbed by the collector due to the greater radiation reaching its surface. Under these circumstances, other design parameters might be adjusted such as increasing the water flow rate or the pipe length embedded in the slabs, decreasing the slabs’ thickness or reducing the depth at which the pipes are placed, all of which might increase the rate of energy collection.
4.3.
Effect of slab thickness on the collector performance
Reducing the thickness of the slabs is essential when the collector is part of or is placed on the roof of a house. Thus, for this kind of applications, a low weight is necessary in order to not to alter the structural design of the house. On the other hand, when the asphalt collector is placed as part of a road pavement, the thickness is critical from the structural point of view and an appropriate design has to be
10
chosen without focusing only on thermal considerations. At the same time, thicker pavements could be beneficial in terms of their thermal inertia, that is to say because of the energy collected by the heat exchange fluid when the sun is not shining anymore and the irradiance is almost zero.
Thus, the influence of the slabs’ thickness on the thermal behaviour of the asphalt collector was studied by means of the numerical simulation of a 2x4 slab arrangement. The irradiance was set to 500 W/m2 during the first 8 hours of simulation whereas it was cancelled (0 W/m2) for the second 8 hours in order to evaluate the thermal inertia of the collector. As in previous simulations, the water flow rate was set to 2 l/min. Results of temperature gradient and accumulated heat gain obtained from the simulation for different thicknesses are shown in Figures 10 and 11, respectively. Results of heat gain for a collector of 80 mm thick, quite similar to those of the 60 mm thick one, have been omitted for clarity purposes.
According to these graphs, the ability to collect heat during the first few hours depends to a significant extent on the thickness of the collector, where higher thicknesses result in lower temperature gradients and energy harvesting. Since only the thickness has been varied in this simulation, a direct relationship exists with the cross-section. In this sense, a lower thickness results in a smaller cross-sectional area (CSA) of the slab around the pipe and hence, the solar radiation absorbed by the slabs is quickly concentrated and exchanged by convection with the water flowing through the pipe. In the case of greater thicknesses, the CSA of the slab around the pipe is larger and so too is the time taken by the slab to reach the same temperature (mainly by conduction), thus resulting in less heat exchange with the water by convection during these first few hours and eventually in a lower temperature gradient and amount of energy collected.
After 3-4 hours, temperature gradients and energy collected become equal except for the collector with a significantly greater thickness, for which those parameters are slightly smaller. Nevertheless, at this time this collector seems to have reached a similar heat gain rate.
At the end of the daytime period, similar values of temperature gradient are reached by all the collectors and a drastic drop occurs when the irradiance becomes zero. However, the extent of this drop is again dependent on the thickness of the slabs, the extra energy stored by the thicker slabs playing an interesting role. The influence of this surplus of energy is also shown in Figure 12, where the heat gain rate for the collector formed by slabs of 160 mm thick is moderately higher, and hence so too is the energy collected with time.
Based on these results there seems to be a certain thermal inertia in asphalt collectors with significant thicknesses. However, the values of overall thermal performance obtained from the simulation (Figure 12) reveal a much lower influence than expected. Thus, under the conditions here studied, the additional amount of energy harvested by collectors with lower thicknesses during daylight hours is still greater than the surplus of energy collected by much thicker devices when the irradiance is zero.
11
5. Conclusions
In this work, a CFD numerical model has been developed by applying the finite volume approach (FVM) to the analysis of the thermal response of a modular asphalt solar collector. The validation of the model was accomplished by means of results from laboratory scale tests. For this reason, numerical simulations were developed with and without taking buoyancy forces into account. Several conclusions can be drawn from the results obtained:
A mesh independence study was carried out for the definition of a mesh size that balanced the accuracy of the simulation and the resulting computational costs. It turned out that a relatively small size was able to satisfy all these requisites.
Very good agreement between the experimental and numerical results was achieved under the conditions studied, with errors under 10% for the temperature gradient, heat collection and thermal performance per unit of water flow rate.
The model developed is able to evaluate the main parameters involved in the design of an asphalt solar collector, which include those studied here (irradiance, size, flow rate and thickness) and others such as pipe length or pipe depth.
The solar radiation reaching the surface, the heat exchange fluid flow rate and size are key parameters in relation to the design of asphalt collectors, with thermal performance reaching up to 74% providing that the proper combination of these parameters is selected.
The surplus of energy stored within the asphalt slabs of significantly thicker collectors does not have a big influence on their thermal performance, even though parameters other than those considered here should be taken into account in further studies.
6. Acknowledgements
This project, with reference BIA2013-40917-R, is financed by the Ministry of Economy, Industry and Competitiveness and funded by the State General Budget and the European Regional Development Fund (FEDER).
References
[1] Abdmouleh, Z., Alammari, R.A.M., Gastli, A. Review of policies encouraging renewable energy integration & best practices. Renewable and Sustainable Energy Reviews, 2015, 45 pp. 249-262. [2] Inman, R.H., Pedro, H.T.C., Coimbra, C.F.M. Solar forecasting methods for renewable energy integration. Progress in Energy and Combustion Science, 2013, 39:535-76.
[3] Mallick, R.B., Chen, B.L., Bhowmick, S. Reduction of urban heat island effect through harvest of heat energy from asphalt pavements. International Journal of Sustainable Engineering, 2009, 2(3) 214-228.
12
[4] Wu, S., Chen, M., Wang, H., Zhang, Y. Laboratory study on solar collector of thermal conductive asphalt concrete. International Journal of Pavement Research and Technology, 2009, 2(4) 130-136. [5] Wu, S., Chen, M., Zhang, Y. Laboratory investigation into thermal response of asphalt pavements as solar collector by application of small-scale slabs. Applied Thermal Engineering, 2011, 31(10) 1582-1587.
[6] Bobes-Jesus, V., Pascual-Muñoz, P., Castro-Fresno, D., Rodriguez-Hernandez, J. Asphalt solar collectors: A literature review. Applied Energy, 2013, 102 pp. 962-970
[7] Zhou, Z., Wang, X., Zhang, X., Chen, G., Zuo, J., Pullen, S. Effectiveness of pavement-solar energy system - An experimental study. Applied Energy, 2015, 138 pp. 1-10.
[8] Pan, P., Wu, S., Xiao, Y., Liu, G. A review on hydronic asphalt pavement for energy harvesting and snow melting. Renewable and Sustainable Energy Reviews, 2015, 48 pp. 624-634.
[9] Wang, H., Wu, S., Chen, M., Zhang, Y. Numerical simulation on the thermal response of heat-conducting asphalt pavements. Physica Scripta T, 2010, T139, art. no. 014041.
[10] P. Pascual-Muñoz, D. Castro-Fresno, J. Carpio, D. Zamora Barraza. Influence of early colour degradation of asphalt pavements on their thermal behaviour. Construction and Building Materials, 2014, 65 pp. 432-439.
[11] Pascual-Muñoz, P., Castro-Fresno, D., Serrano-Bravo, P., Alonso-Estébanez, A. Thermal and hydraulic analysis of multilayered asphalt pavements as active solar collectors. Applied Energy, 2013, 111 pp. 324-332.
[12] Chiarelli, A., Dawson, A.R., García, A. Parametric analysis of energy harvesting pavements operated by air convection. Applied Energy, 2015, 154 pp. 951-958.
[13] Van Bijsterveld, W.T., Houben L.J.M., Scarpas, A., Molenaar, A.A.A. Using pavement as solar collector: effect on pavement temperature and structural response. Journal of Transportation Research Board, 2001, (1778) 140-148.
[14] Chen, M., Wu, S., Wang, H. and Zhang, Y. Study of ice and snow melting process on conductive asphalt solar collector. Solar Energy Materials and Solar Cells, 2011, 95(12) 3241-3250.
[15] Mallick, R.B., Chen, B.-L., Bhowmick, S. Harvesting heat energy from asphalt pavements: development of and comparison between numerical models and experiment, International Journal of Sustainable Engineering, 2012, 5 (2) pp. 159-169.
[16] Dawson R.A., Dehdezi, P.K., Hall, R.M., Wang, J., Isola, R., 2011. Thermo-Physical Optimization of Asphalt Paving Materials. Transportation Research Board (TRB), Annual Meeting, Washington, USA, January 2012.
13
[17] Pan, P., Wu, S., Xiao, Y., Wang, P., Liu, X. Influence of graphite on the thermal characteristics and anti-ageing properties of asphalt binder. Construction and Building Materials, 2012, 68, pp. 220-226.
[18] ShengYue, W., QiYang, Z., YingNa, D., PeiDong, S. Unidirectional heat-transfer asphalt pavement for mitigating the urban heat island effect. Journal of Materials in Civil Engineering, 2014, 26 (5) pp. 812-821.
[19] Gao, Q., Huang, Y., Li, M., Liu, Y., Yan, Y.Y. Experimental study of slab solar collection on the hydronic system of road. Solar Energy, 2010, 84 (12) pp. 2096-2102.
[20] Garcia, A., Hassn, A., Chiarelli, A., Dawson, A. Multivariable analysis of potential evaporation from moist asphalt mixture. Construction and Building Materials, 2015, 98 pp. 80-88.
[21] Hall, M.R., Dehdezi, P.K., Dawson, A.R., Grenfell, J., Isola, R. Influence of the thermophysical properties of pavement materials on the evolution of temperature depth profiles in different climatic regions. Journal of Materials in Civil Engineering, 2012, 24 (1) pp. 32-47.
[22] Hosseini, F., Hossain, S.M.K., Fu, L., Johnson, M., Fei, Y. Prediction of pavement surface temperature using meteorological data for optimal winter operations in parking lots. 16th International Conference on Cold Regions Engineering, 2015.
[23] Mallick, R.B., Chen, B., Bhowmick, S. Harvesting energy from asphalt pavements and reducing the heat island effect. International Journal of Sustainable Engineering, 2009, 2(3), pp. 214-228. [24] Chiarelli, A., Al-Mohammedawi, A., Dawson, A.R., García, A. Construction and configuration of convection-powered asphalt solar collectors for the reduction of urban temperatures. International Journal of Thermal Sciences, 2017, 112, pp. 242-251.
[25] Golden, J.S., Kaloush, K.E. Mesoscale and microscale evaluation of surface pavement impacts on the urban heat island effects. International Journal of Pavement Engineering, 2006, 7(1), pp. 37-52. [26] Eugster, J. Road and Bridge Heating Using Geothermal Energy. Overview and Examples. Proceedings European Geothermal Congress, Unterhaching, Germany, 30 May-1 June 2007.
[27] Morita, K., Tago, M. Operational characteristics of the Gaia Snow-Melting System in Ninohe, Iwate, Japan. Proceedings World Geothermal Congress 2000, Kyushu-Tohoku (Japan).
[28] Ooms Civiel. (2017). Road Energy Systems. www.ooms.nl/en/7/301/road_energy_system.aspx. [Accessed: 18-January-2017].
[29] Zhang, X., Shen, J., Lu, Y., He, W., Xu, P., Zhao, X., Qiu, Z., (...), Dong, X. Active Solar Thermal Facades (ASTFs): From concept, application to research questions. Renewable and Sustainable Energy Reviews, 2015, 50 pp. 32-63.
14
[30] Shukla, A., Nkwetta, D.N., Cho, Y.J., Stevenson, V., Jones, P. A state of art review on the performance of transpired solar collector. Renewable and Sustainable Energy Reviews, 2012, 16 (6) pp. 3975-3985.
[31] Sampedro-García, J.L., Alonso-Estébanez, A., Indacoechea-Vega, I., Pascual-Muñoz, P., Castro-Fresno, D. Design and characterization of a new asphalt collector for solar thermal energy harvesting. 41st IAHS World Congress on Housing, 2016, Albufeira, Portugal.
[32] Bennet, F., Hart-Smith, G., Gruendling, T., Davis, T., Barker, P., Barner-Kowollik, C. Degradation of Poly(methyl methacrylate) Model Compounds Under Extreme Environmental Conditions. Macromolecular Chemistry and Physics, 2010, 211(10) 1083-1097.
[33] Bernard, F., Quilgars, A., Cazaunau, M., Grosselin, B., Daele, V., Mellouki, A., Winterhalter, R., Moortgat, G. Ozonolysis of a series of biogenic organic volatile compounds and secondary organic aerosol formation. Geophysical Research Abstracts, Volume 12. European Geosciences Union (EGU), General Assembly 2010. May 2-7, Vienna-Austria.
[34] He, W., Hong, X., Luo, B., Chen, H., Ji, J. CFD and comparative study on the dual-function solar collectors with and without tile-shaped covers in water heating mode. Renewable energy, 2016, 86, 1205-1214.
CAPTIONS
Figure 1. Experimental set-up for an asphalt collector formed by 4 slabs. Figure 2. Photo of the lab scale experimental set-up.
Figure 3. Domain dimensions and boundary conditions considered in the numerical model: (a) general view of
all regions and (b) zoom view of the collector and the irradiance source.
Figure 4. Mesh used for the computational domain.
Figure 5. Relative error between experimental and simulation results of outlet water temperature and
thermal performance.
Figure 6. Experimental and numerical results of temperature gradient and heat gain as a function of
the flow rate.
Figure 7. Experimental and numerical results of performance and surface temperature as a function of
15
Figure 8. Display of the flow field when the buoyancy is considered.
Figure 9. Temperature gradient, heat gain and thermal performance as a function of size and
irradiance.
Figure 10. Temperature gradient along the 16h test for different values of slabs thickness. Figure 11. Energy collected along the 16h test for different values of slabs thickness.
24
Table 1. Thermal properties of the materials defined in the numerical model
Material Density (kg/m3) Thermal conductivity (W/m∙K) Specific heat (J/kg∙K) Air 1.225 0.0242 1006.43 Water 998.2 0.6 4182 Asphalt mix 2200 1.6 670 Cupper 8978 381 387.6
Table 2. Relative error between experimental and simulation results for the three viscous models
Outcome
Viscous model
Laminar SST Transition k-kL-ω Transition
Toutlet (°C) 0.20% 0.35% 0.39%
η
Th (%) 2.1% 16.1% 17.6%Table 3. Relative errors between experimental and numerical results with and without considering buoyancy
Flow rate (l/min)
Temperature Gradient (Avg) Surface Temperature (Avg)
Exp vs. CFD-B Exp vs. CFD-NoB Exp vs. CFD-B Exp vs. CFD-NoB
1.0 14.5% 10.2% 3.7% 3.4%
1.5 13.3% 12.7% 3.0% 2.6%
2.0 8.1% 4.5% 2.3% 2.0%
25