Essays on the banking sector: capital, structure, productivity and bank restructuring
111
0
0
Texto completo
(2)
(3) DOCTORAL THESIS 2019 Doctoral Programme of Economics Management and Organization (DEMO) ESSAYS ON THE BANKING SECTOR: CAPITAL STRUCTURE, PRODUCTIVITY AND BANK RESTRUCTURING. Vanesa Llorens Llorens Thesis Supervisor: Alfredo Martín Oliver Thesis Tutor: Lluís Bru Martínez Doctor by the Universitat de les Illes Balears.
(4)
(5) Publications Llorens, V. and Martín-Oliver, A. (2017) “Determinants of bank’s financing choices under capital regulation”, SERIEs, 8 (3), 287-309. Corresponding to Chapter 2. Determinants of bank’s financing choices under capital regulation. Llorens, V. and Martín-Oliver, A. (2018) “Productividad, tipos de interés y reestructuración bancaria”, Papeles de economía española, 155, 74-86. Corresponding to Chapter 3. Productivity, interest rates and banking restructuring process.. v.
(6)
(7) A mi familia.
(8)
(9) Acknowlegments / Agradecimientos La elaboración de esta tesis supone un importante hito logrado en mi carrera profesional que se ha sustentado en gran medida en el apoyo recibido de numerosas personas a quienes quiero dedicar estas líneas. En primer lugar, quiero agradecer a Alfredo Martín su confianza y apoyo prestados durante la elaboración de esta tesis que han sido determinantes para poder culminar esta investigación. Junto al acicate que ha supuesto su entusiasmo, he tenido la suerte de contar con un excelente profesional que ha contribuido sobremanera a enriquecer la calidad de los trabajos presentados y a acrecentar mis conocimientos de Economía en general y de Economía Bancaria, en particular. Sin lugar a duda, haber trabajado y aprendido a su lado ha sido el aspecto más satisfactorio de este periodo. En segundo lugar, quiero agradecer al cuerpo docente y colaboradores del CEMFI la valiosa impronta que supuso en mi formación mi paso por el máster en Economía y Finanzas. Esa etapa, bastante lejana ya, me permitió aprender de investigadores de reconocido prestigio entre los que quiero destacar a Manuel Arellano, mi tutor dentro del programa, y Jesús Dolado, mi director de tesina y co-autor de mis primeros trabajos de investigación. Mis andaduras profesionales posteriores, si bien han seguido un camino poco ortodoxo, me han permitido entrar en contacto con formidables compañeros de trabajo, tanto a nivel profesional como personal, y enfrentar retos de muy diversa índole que han ido sumando a la persona que soy hoy. Quiero expresar mi gratitud al Departamento de Economía de la Empresa de la Universitat de les Illes Balears por admitirme en el programa de doctorado Ph. D. program in Economics, Management and Organization (DEMO) y, en especial, a Rafel Crespí y Lluis Brú, coordinador del programa y tutor de la tesis respectivamente. Gracias a este programa he tenido la oportunidad de proseguir en mi carrera como investigadora que culmina ahora con la defensa de esta tesis. Por último, esta tesis se ha alimentado del afecto y apoyo de mi familia y amigos que me han acompañado durante esta larga etapa y con los que contaré por seguro en la próxima.. ix.
(10)
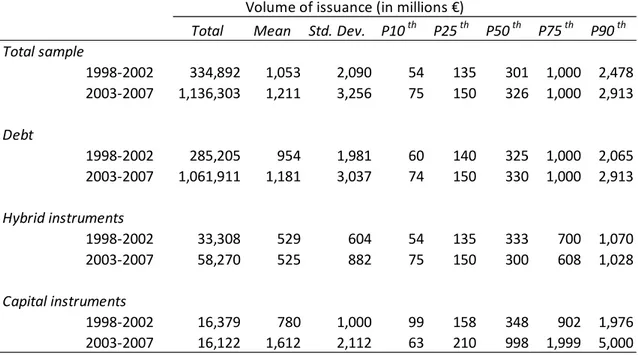
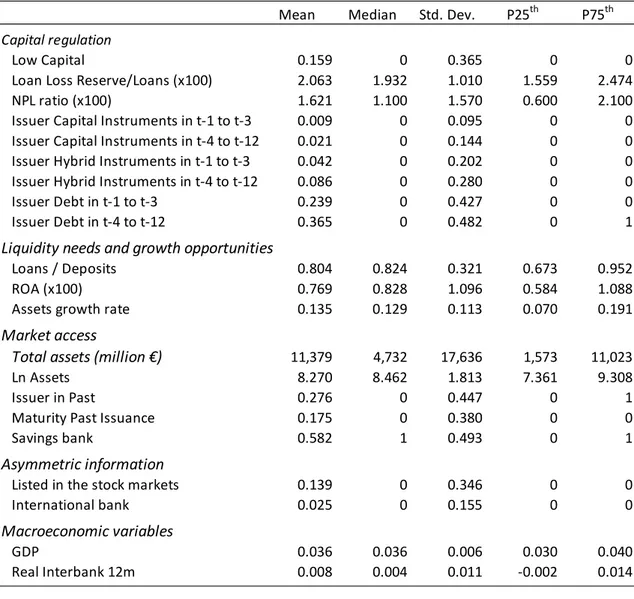
(11) Contents Publications..................................................................................................................... v Acknowlegments / Agradecimientos .......................................................................... ix Contents ......................................................................................................................... xi List of Tables ............................................................................................................... xiii List of Figures .............................................................................................................. xiii Summary ......................................................................................................................... 1 Resumen ......................................................................................................................... 2 Resum ............................................................................................................................. 4 Introduction ..................................................................................................................... 5 Chapter 1. Bank´s capital structure and quality of capital under capital regulation....................................................................................................................... 11 1.1 Introduction ...................................................................................................... 11 1.2 Determinants of leverage .................................................................................. 15 1.2.1 Some evidence on leverage in banks ............................................................. 15 1.2.2 Determinants of leverage in non-financial firms and banks .......................... 17 1.2.3 Empirical model and variables ...................................................................... 18 1.3 Database and descriptive analysis .................................................................... 20 1.4 Results .............................................................................................................. 22 1.4.1 Determinants of leverage in banks ................................................................ 22 1.4.2 Determinants of leverage in capital of banks ................................................ 24 1.4.2.1 Leverage in capital and growth of banks .................................................... 27 1.5 Conclusions ...................................................................................................... 30 References .............................................................................................................. 32 Appendix of Chapter 1 ........................................................................................... 35 Chapter 2. Determinants of bank’s financing choices under capital regulation . 37 2.1 Introduction ...................................................................................................... 37 2.2 Database and characteristics of the sample ...................................................... 41 2.3 Determinants of issuing financial instruments ................................................. 44 2.3.1 Dependent variable ........................................................................................ 46 2.3.2 Explanatory variables .................................................................................... 46 2.3.2.1 Capital regulation ....................................................................................... 47 2.3.2.2 Liquidity needs and growth opportunities .................................................. 49 2.3.2.3 Market access ............................................................................................. 50 2.3.2.4 Asymmetric information ............................................................................ 51 xi.
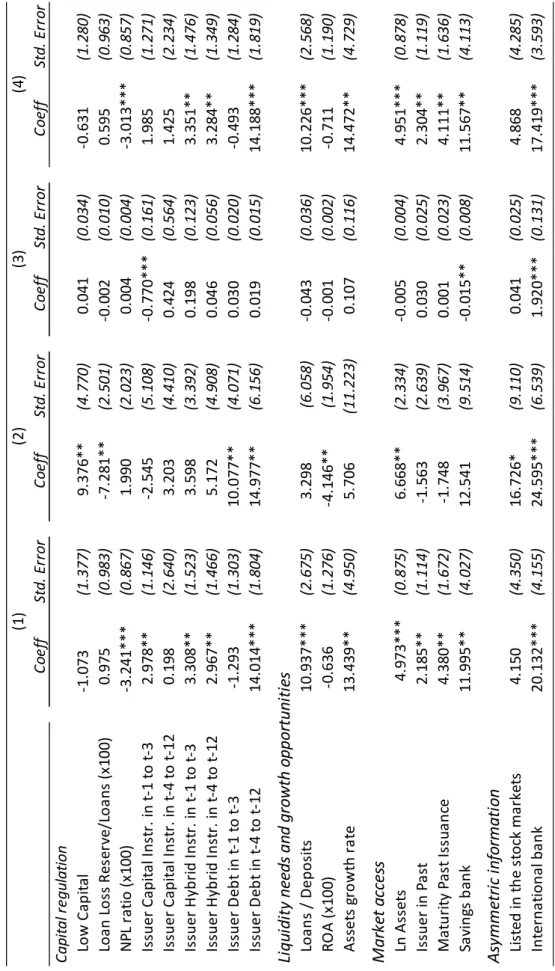
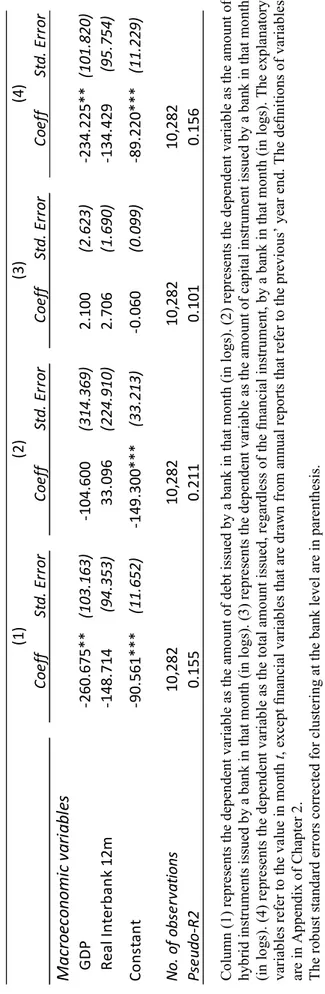
(12) 2.4 Empirical strategy and results........................................................................... 51 2.4.1 Decision to issue financial instruments ......................................................... 51 2.4.2 Results on the amount issued ........................................................................ 56 2.5 Conclusions ...................................................................................................... 60 References .............................................................................................................. 62 Appendix of Chapter 2 ........................................................................................... 65 Chapter 3. Productivity, interest rates and banking restructuring process ......... 67 3.1 Introduction ...................................................................................................... 67 3.2 Conceptual framework ..................................................................................... 69 3.2.1 Price competition ........................................................................................... 70 3.2.2 Productivity and restructuration of the banking system ................................ 71 3.2.2.1 Exit of banking entities ............................................................................... 72 3.2.2.2 Branch expansion through mergers and acquisitions ................................. 73 3.3 Database and variables ..................................................................................... 74 3.3.1 Interest rates on loans, deposits and net commissions................................... 75 3.3.2 Measurement of the productivity of banking entities .................................... 77 3.3.2.1 Productivity in the banking industry .......................................................... 78 3.3.2.2 Productivity measures ................................................................................ 80 3.3.3 Other explanatory variables ........................................................................... 81 3.4 Results of empirical model ............................................................................... 82 3.4.1 Interest rates and net fees............................................................................... 82 3.4.2 Probability of exiting the banking market ..................................................... 84 3.4.3 Branch expansion through mergers and takeovers ........................................ 86 3.5 Conclusions ...................................................................................................... 87 References .............................................................................................................. 90 Appendix of Chapter 3 ........................................................................................... 92. xii.
(13) List of Tables Table 1 Descriptive statistics of explanatory variables. Spanish banks, 1998-2007 ...... 22 Table 2 Estimation of bank’s leverage ratio ................................................................... 23 Table 3 Estimation of bank’s leverage in capital ratio ................................................... 26 Table 4 Estimation of bank’s leverage in capital ratio including the impact of assets’ growth ............................................................................................................................. 28 Table 5 Descriptive statistics of the issuances of Spanish banks, 1998-2007 ................ 43 Table 6 Descriptive statistics of explanatory variables. Spanish banks, 1998-2007 ...... 44 Table 7 Multinomial logit estimation of the decision to issue (or not to issue) among debt, hybrid instruments, or capital instruments ............................................................ 53 Table 8 Cross-tests of equality of coefficients between equations ................................. 54 Table 9 Tobit estimation of the amount issued by banks in debt, hybrid and capital instruments ..................................................................................................................... 58 Table 10 Restructuring process of the Spanish banking system. Descriptive analysis .. 74 Table 11 Descriptive statistics of explanatory variables capturing the heterogeneity of the banking entities. Spanish banks, 2005-2015............................................................. 82 Table 12 Interest rates and commissions ........................................................................ 83 Table 13 Probability of exit of an entity......................................................................... 85 Table 14 Probability of one entity absorbing another entity .......................................... 86. List of Figures Figure 1 Volume of assets (m€) and asset growth rate of Spanish banks, 1998-2007 ... 13 Figure 2 Yearly distribution of capital ratios.................................................................. 16 Figure 3 Leverage ratio, Basel ratio and Leverage in capital. Average across banks .... 25 Figure 4 Average interest rates and interest margins ..................................................... 76 Figure 5 Productivity of the banking sector ................................................................... 79. xiii.
(14)
(15) Summary This dissertation thesis analyzes the determinants of the capital ratio of banks and also the dynamics of the leverage ratio, exploring the driving forces of the issuance of debt and capital instruments. My thesis contributes to shed light on how certain decisions of banks during the years prior the crisis generated latent risks in their liability side that were revealed with the outburst of the crisis, and on the implications of the restructuring for the banking system in terms of productivity, concentration and profitability. This dissertation can be divided in three well-differentiated chapters. The first two chapters focus on the years before the crisis, and the last chapter analyzes the changes in the banking sector after the crisis. Chapter 1 explores how banks choose the composition of regulatory capital, and whether different structure of regulatory capital might entangle different risks of the bank. The target is to analyze whether banks fulfill their regulatory obligations using a combination of financial instruments that do not minimize the capacity to absorb losses, but that respond to other incentives such as the minimization of financing costs. Using data of Spanish banks during the period 1998-2007, we provide evidence that the increasing weight of hybrid capital can be read as a leveraging process within the regulatory capital, since there is an increment of the debt-like instruments with respect to the common capital that responds to the same determinants than the standard leverage ratio. The second Chapter of this thesis analyzes the same problem from a dynamic perspective, focusing on the issuances of financial instruments and empirically testing a.
(16) Summary set of hypotheses on the decisions to issue different types of financial instruments. This Chapter analyzes the financing choices of banks under capital regulation during the expansion period that preceded the crisis using data from Dealogic on the issuances of financial instruments of Spanish banks to test whether financing choices respond to predictions derived from the corporate finance theory and/or to capital regulation. We find that banks financed their exponential growth with debt instruments and covered the additional regulatory capital requirements from higher risk-weighted assets with the issuance of hybrid instruments. We also find that banks choose the financial instruments that minimize asymmetric information costs. Finally, Chapter 3 of this thesis is focused on the consequences of the crisis on banks from the point of view of productivity and the effect on bank restructuring. This Chapter analyzes the effects of banking productivity on the evolution of interest rates and on the exit of banks from the Spanish banking sector during the years 2007-2015. Using a theoretical framework of competition with heterogeneity in operating costs, we propose a set of hypotheses which are tested using empirical models. The results show that the productivity of the banking industry had a moderate growth of 2% during the period analyzed, that improvements in the efficiency of the banks are transferred to a decrease in loans’ interest rates and bank fees, and that a context of low interest rates does not necessarily imply a reduction in the intermediation margin because the banks can compensate the negative margins of the deposits with an increase in the differential of their loans with respect to the interbank interest rate. The study also shows that the most productive banks could have taken advantage of the restructuring process to expand their branch network in markets where they have a low presence through the absorption of less productive banks..
(17) Resumen Esta tesis analiza los determinantes del ratio de capital de los bancos así como la dinámica del ratio de endeudamiento, explorando los elementos que determinan la emisión de deuda y los instrumentos de capital. Mi tesis contribuye a arrojar luz sobre cómo ciertas decisiones de los bancos durante los años previos a la crisis generaron riesgos latentes en su pasivo que se revelaron con el estallido de la crisis, y sobre las implicaciones de la reestructuración para el sistema bancario en términos de productividad, concentración y rentabilidad. Esta tesis se puede dividir en tres capítulos bien diferenciados. Los dos primeros, se centran en los años previos a la crisis mientras que el último capítulo analiza los cambios en el sector bancario posteriores a la crisis. El Capítulo 1 se centra en los determinantes de las estructuras de capital de los bancos considerando la existencia de la regulación de capital. El objetivo es analizar si los bancos cumplen con los requerimientos regulatorios mediante una combinación de instrumentos financieros que no minimizan la capacidad de absorber pérdidas, sino que responden a otros incentivos, como la minimización de los costes de financiación. Utilizando datos del sistema bancario español durante el período 1998-2007, aportamos evidencia de que el peso creciente del capital híbrido puede interpretarse como un proceso de apalancamiento dentro del capital regulatorio, ya que existe un incremento de los instrumentos de características típicas a los instrumentos de deuda en relación al capital que responde a los mismos determinantes que el ratio de apalancamiento estándar. El segundo Capítulo de esta tesis analiza el mismo problema desde una perspectiva dinámica, centrándose en las emisiones de instrumentos financieros y contrastando empíricamente un conjunto de hipótesis sobre las decisiones de emitir diferentes tipos de.
(18) 2. Resumen. instrumentos financieros. Este Capítulo analiza las elecciones de financiación de los bancos sujetos a la regulación de capital durante el período de expansión que precedió a la crisis utilizando datos de Dealogic sobre las emisiones de instrumentos financieros de bancos españoles para evaluar si las opciones de financiación responden a las predicciones derivadas de las teorías clásicas de finanzas corporativas y/o a la existencia de regulación bancaria. Encontramos que los bancos financiaron su crecimiento exponencial con instrumentos de deuda cubriendo los requerimientos adicionales de capital regulatorio con la emisión de instrumentos híbridos. También concluimos que los bancos eligen los instrumentos financieros que minimizan los costes derivados de la existencia de información asimétrica. Por último, el Capítulo 3 se centra en las consecuencias de la crisis desde el punto de vista de la productividad y el efecto sobre la reestructuración bancaria. Este Capítulo analiza los efectos de la productividad bancaria en la evolución de los tipos de interés y en la salida de los bancos del sector bancario español durante los años 2007-2015. Usando un marco teórico de competencia con heterogeneidad en los costes operativos, proponemos un conjunto de hipótesis que se contrastan mediante modelos empíricos. Los resultados muestran que la productividad de la industria bancaria tuvo un crecimiento moderado del 2% durante el período analizado, que las mejoras en la eficiencia de los bancos repercutieron en una disminución en las tasas de interés y comisiones bancarias, y que un contexto de bajas tasas de interés no implica necesariamente una reducción en el margen de intermediación ya que los bancos pueden compensar los márgenes negativos de los depósitos con un aumento en el diferencial de sus préstamos con respecto a la tasa de interés interbancaria. Nuestro análisis también muestra que los bancos más productivos podrían haber aprovechado el proceso de reestructuración para expandir su red de sucursales en mercados en los que tienen una baja presencia mediante la absorción de bancos menos productivos..
(19) Resum Aquesta tesi analitza els determinants de la ràtio de capital dels bancs així com la dinàmica de la ràtio d'endeutament, explorant els elements que determinen l'emissió de deute i els instruments de capital. La meva tesi contribueix a comprendre com certes decisions dels bancs durant els anys previs a la crisi van generar riscos latents en el seu passiu que es van revelar amb l'esclat de la crisi, i sobre les implicacions de la reestructuració per al sistema bancari en termes de productivitat, concentració i rendibilitat. Aquesta tesi es pot dividir en tres capítols ben diferenciats. Els dos primers, se centren en els anys previs a la crisi mentre que l'últim capítol analitza els canvis en el sector bancari posteriors a la crisi. El Capítol 1 se centra en els determinants de les estructures de capital dels bancs considerant l'existència de la regulació de capital. L'objectiu és analitzar si els bancs compleixen amb els requeriments regulatoris mitjançant una combinació d'instruments financers que no minimitzen la capacitat d'absorbir pèrdues, sinó que responen a altres incentius, com la minimització dels costos de finançament. Utilitzant dades del sistema bancari espanyol durant el període 1998-2007, aportem evidència que el pes creixent del capital híbrid pot interpretar-se com un procés de palanquejament dins el capital regulatori, ja que hi ha un increment dels instruments de característiques típiques als instruments de deute en relació al capital que respon als mateixos determinants que la ràtio de palanquejament estàndard. El segon capítol d'aquesta tesi analitza el mateix problema des d'una perspectiva dinàmica, centrant-se en les emissions d'instruments financers i contrastant empíricament un conjunt d'hipòtesis sobre les decisions d'emetre diferents tipus d'instruments financers..
(20) 4. Resum. Aquest capítol analitza les eleccions de finançament dels bancs subjectes a la regulació de capital durant el període d'expansió que va precedir a la crisi utilitzant dades de Dealogic sobre les emissions d'instruments financers de bancs espanyols per avaluar si les opcions de finançament responen a les prediccions derivades de les teories clàssiques de finances corporatives i / o l'existència de regulació bancària. Trobem que els bancs van finançar el seu creixement exponencial amb instruments de deute cobrint els requeriments addicionals de capital regulatori amb l'emissió d'instruments híbrids. També vam concloure que els bancs trien els instruments financers que minimitzen els costos derivats de l'existència d'informació asimètrica. Finalment, el Capítol 3 es centra en les conseqüències de la crisi des del punt de vista de la productivitat i l'efecte sobre la reestructuració bancària. Aquest capítol analitza els efectes de la productivitat bancària en l'evolució dels tipus d'interès i en la sortida dels bancs del sector bancari espanyol durant els anys 2007-2015. Usant un marc teòric de competència amb heterogeneïtat en els costos operatius, proposem un conjunt d'hipòtesis que es contrasten mitjançant models empírics. Els resultats mostren que la productivitat de la indústria bancària va tenir un creixement moderat del 2% durant el període analitzat, que les millores en l'eficiència dels bancs van repercutir en una disminució en les taxes d'interès i comissions bancàries, i que un context de baixes taxes d'interès no implica necessàriament una reducció en el marge d'intermediació ja que els bancs poden compensar els marges negatius dels dipòsits amb un augment en el diferencial dels seus préstecs pel que fa a la taxa d'interès interbancària. La nostra anàlisi també mostra que els bancs més productius podrien haver aprofitat el procés de reestructuració per expandir la seva xarxa de sucursals a mercats en els que tenen una baixa presència mitjançant l'absorció de bancs menys productius..
(21) Introduction There is a growing literature that analyzes the causes and consequences of the 2008 crisis and it seems to be a consensus in pointing to financial innovation as responsible of the excessive credit growth and the reduction in credit standards applied by banks at the time of granting loans. Within this line of research, there are papers that point the increasing deterioration of bank capital as one of the main culprits of banks' risky decisions prior and during the current financial crisis. It is generally accepted that capital should deter banks to take bad risk practices and enhance good bank governance to minimize the exposition of shareholders to the risk of failure (Rochet, 1992; Morrison and White, 2005). Indeed, there is evidence that more capitalized banks have been able to cope better with severe losses derived from the current crisis (Demirguc-Kunt et al. 2013; Beltratti and Stulz, 2012; Berger and Bouwman, 2013). However, recent papers provide descriptive evidence of a deterioration of bank capital prior and during the crisis that could have dwindled the capacity of capital to act as a corporate governance mechanism, since the participation of owners in potential losses has become smaller (Acharya et al., 2009, Mehran et al., 2012). According to Acharya et al. (2011) this dwindling weight of common capital could also explain the difficulties of banks to raise new funds, since creditors will only lend if common shareholders are bearing a significant part of the risk. The previous papers provide descriptive evidence of how the deterioration in quantity and quality of bank capital can be at the core of the excessive risk taken by banks and of the subsequent credit crunch that impedes them to lend. However, little is known about the reasons why banks decide to increase the proportion of hybrid capital within their regulatory capital..
(22) 6. Introduction. This dissertation thesis analyzes the determinants of the capital ratio of banks and also the dynamics of the leverage ratio, exploring the driving forces of the issuance of debt and capital instruments. My thesis contributes to shed light on how certain decisions of banks during the years prior the crisis generated latent risks in their liability side that were revealed with the outburst of the crisis, and on the implications of the restructuring for the banking system in terms of productivity, concentration and profitability. This dissertation can be divided in three well-differentiated chapters. The first two chapters focus on the years before the crisis, and the last chapter analyzes the changes in the banking sector after the crisis. Chapter 1 explores how banks financed their growth during the period prior the current financial crisis and the consequences on the quantity and quality of the bank capital. We adopt an approach that adapts the traditional leverage equation used in the corporate finance theory to explain leverage of non-financial firms including risks’ determinants relevant to the banking industry. It has been argued that bank leverage is determined by regulation because of their obligation to fulfil the capital regulation set at supra-national level (Mishkin, 2000). However, the empirical data shows that, far from being homogeneous, there is dispersion in the leverage ratio across banks. Using a sample of Spanish banks during the period 1998-2007 that uses data from Bankscope, we find that the variability of leverage ratios across banks can be explained by the theories of corporate finance accepted for nonfinancial firms. We also find that the same incentives govern the choice of banks when deciding the composition of debt-like capital and equity capital to fulfil their obligations set by capital regulation. That is, we provide evidence that the increasing weight of hybrid capital can be read as a leveraging process within the regulatory capital, since there is an increment of the debt-like instruments with respect to the common capital that responds to the same determinants than the standard leverage ratio. Therefore, the observed constant levels of risk-adjusted capital ratios were hiding a deterioration of the quality of capital, because banks increased the weight of debt-like capital that were eligible to fulfil their capital requirements in both Tier 1 and Tier 2. This leverage in capital presents an increasing trend during the period, even after controlling for these determinants of leverage. Furthermore, we find that banks, specially savings banks, that experienced higher growth rates during the pre-crisis period targeted a higher proportion of debt-like.
(23) Introduction. 7. instruments in their regulatory capital. This might explain why the capital of these banks could not absorb losses during the crisis. The second Chapter of this thesis analyzes the same problem from a dynamic perspective, focusing on the issuances of financial instruments and empirically testing a set of hypotheses on the decisions to issue different types of financial instruments. To do so, we use data from Dealogic of 4,812 financial instruments issued by Spanish banks during the period 1988-2007. In this Chapter, we try to understand how capital regulation affects behavior of banks based on insights from the traditional theories of corporate finance (Bradley et al. 1984; Myers and Majluf 1984; Titman and Wessels 1988; Frank and Goyal 2008, 2009). In particular, we use the logic of the pecking order theory to examine whether the banks’ choices of financial instruments are related to adverse selection costs. Likewise, we test whether the choice of financial instruments targets an optimal capital structure. For the sake of completion, our analysis addresses how the fulfillment of capital regulation affects the choice of financial instruments. To perform such tests, we will look at the expected choices of financial instruments if banks have liquidity needs or have growth opportunities as predicted by the different theories. Specifically, we test whether banks have a preference toward debt and debt-like instruments, as the pecking order predicts, or if banks want to maintain a target capital ratio and prefer to combine issuances of different instruments to reach or maintain an optimal capital structure, as predicted by the trade-off theory. In this Chapter we find that the financial development and the access of banks to financial markets has increased the vulnerability of the banking sector, not only to shocks in the financial markets (Almazán et al. 2015) but to deterioration in the capital meant to absorb losses. More concretely, we find that banks with higher expansion in their balance sheets finance their liquidity needs with issuances of debt instruments. At the same time, we find that the issuances of debt are correlated with the issuances of hybrid instruments because hybrids were the instrument used by banks to comply with the higher regulatory capital requirements derived from the expansion of the (risk-weighted) assets. While finding little support for the trade-off theory, evidence points out that information asymmetries can explain the choice of debt/hybrid instruments by banks. That is, banks decide to issue the market instrument that more resembles debt in order to minimize the adverse selection discount. This decision can explain why banks finance growth with debt.
(24) 8. Introduction. and raise hybrid capital instead of common equity if they are close to the regulatory minimum or have low levels of provisions or earnings that compute as eligible capital. Chapter 3 of this thesis is focused on the consequences of the crisis on banks from the point of view of productivity and the effect on bank restructuring. More concretely, this Chapter analyzes the effects of bank productivity on the evolution of interest rates offered by Spanish banks and the exit of banks from the Spanish banking sector during the period 2007-2015. We develop a theoretical framework based on Martin-Oliver, Ruano and Salas-Fumás (2018) based on spatial competition with heterogeneous operating costs in order to obtain some testable theoretical predictions about how productivity can be translated to bank prices. Moreover, we explore whether more productive banks have followed a strategy of expansion of their branch network through the acquisition of less productive banks with branches in regions where the acquirer had relatively low presence. This hypothesis would be compatible with previous studies that have analyzed whether different levels of efficiency affect the exit of manufacturing plants in declining industries (Ghemawat and Nalebuff, 1985, Fudenberg and Tirole, 1986, Reynolds, 1988, Whinston, 1988). The results show that the productivity of the banking industry had a moderate growth of 2% during the period analyzed, that improvements in the efficiency of the banks are transferred to a decrease in loans’ interest rates and bank fees, and that a context of low interest rates does not necessarily imply a reduction in the intermediation margin because the banks can compensate the negative margins of the deposits with an increase in the differential of their loans with respect to the interbank interest rate. The Chapter also shows that the most productive banks could have taken advantage of the restructuring process to expand their branch network in markets where they have a low presence through the absorption of less productive banks. One of the main contributions of this thesis is that it provides policy arguments to justify a tougher definition of regulatory capital in Basel III since, as our results confirm, banks have incentives to comply with capital regulation through the financing alternative of lowest cost that is recognized as eligible capital. This incentive indicates that the problem of credit expansions or recessions in capital are not only due to procyclicality (Repullo and Suárez 2012; Repullo et al. 2010; Ayuso et al. 2004), but also because of.
(25) Introduction. 9. the composition of the capital. This finding also originates a line of research. First, our analysis stands out that banks with higher growth rates deserves special attention by regulators since the increase of debt-like instruments was more pronounced for this group. Thus, future research should focus in the relationship between size and the quality of capital in order to refine mechanisms that prevent larger banks reducing their capacity to absorb losses. In addition to this, compliance with the new Basel Standards could be a challenge for small-medium banks less known by the markets since they face the risk of higher discounts when issuing common shares. But an opportunity exists to control the potential excessive growth in these types of banks with access to almost unlimited financing in the form of debt, but with serious difficulties (from the supply and/or demand side) in raising high-quality capital. Future research in this sense would be related to macro-prudential policies channeled to reduce the procyclicality of capital requirements in the sense that banks with more difficulties to rise capital are able to accumulate it during expansions and periods of growth (for example, through retained profits). As per regard the consolidation process that have taken place in recent years, another line of research would analyze if the increase in the concentration of the banking sector can cause an increase in the market power of the surviving banks that eliminates the improvements in price for customers due to higher productivity and benefit. More investigation is needed to discern which effect dominates: the concentration of the sector that increases market power and reduces welfare or the increase of productivity due to the exit of productive banks that reduces interest rates and increase social welfare..
(26)
(27) Chapter 1. Bank´s capital structure and quality of capital under capital regulation. 1.1 Introduction This Chapter explores how banks choose the composition of regulatory capital, and whether different structure of regulatory capital might entangle different risks of the bank. Banks are financial firms with an intermediation function based on raising funds (from wholesale markets and depositors) to finance loans and other investments. In order to guarantee the solvency and soundness of the banking system, regulators require banks to hold a minimum level of regulatory capital to absorb unexpected losses from the risky assets held by banks. Nonetheless, there have been different instruments with different characteristics that were eligible as regulatory capital. The target of this chapter is to analyze whether banks fulfill their regulatory obligations using a combination of financial instruments that do not minimize the capacity to absorb losses, but that respond to other incentives such as the minimization of financing costs. There is a growing literature that analyzes the causes and consequences of the 2008 crisis and it seems to be a consensus in pointing to financial innovation as responsible of the excessive credit growth and the reduction in credit standards observed during the pre-.
(28) 12. Chapter 1. crisis period1,2. In this sense, the main bulk of papers has focused on the increase of latent risks in the asset side of the balance sheet that were manifested in the downturn period. However, this manifestation of risks could only become a solvency problem for banks if bank capital was not enough to absorb losses. This Chapter focuses on the accumulation of risks in the liability side of banks’ balance sheet and, more concretely, on the deterioration of regulatory capital. Until Basel III came into force3, bank could fulfill their capital requirements using not only common equity, but also hybrid instruments with lower loss-absorbing capacity, such as preferred shares and subordinated debt. Preferred shares computed (up to a maximum) as capital of maximum category (Tier 1), whereas subordinated debt was eligible for Tier 2 capital. Therefore, banks could decide the composition of hybrid instruments and equity capital in both Tier 1 and Tier 2. This means that, even when fulfilling the capital regulation in terms of quantity of capital (Tier 1+ Tier 2 not lower than 8% of risk-weighted assets) and quality of capital (Tier 1 not lower than 4%), banks have a high level of discretion to choose the composition of hybrid capital versus equity capital. In this Chapter, we refer to the proportion of debt-like instruments (hybrid capital) with respect to regulatory capital as leverage in capital and our target is to analyze whether banks have incentives to increase the leverage in capital at the expense of decreasing the loss-absorbing capacity of regulatory capital. The basic framework to analyze the choice of the composition of regulatory capital of banks is grounded in the main theories of corporate finance. We test whether leverage in capital is driven by the same forces that explain the capital structure of non-financial firms. The justification is that the main theories of capital structure can also be applied to analyze the composition of regulatory capital, assuming that debt-like instruments acts as “debt” and equity capital acts as “capital”. For instance, the application of the trade-off theory would suggest that it is not optimal to hold a 100% equity capital structure (no leverage in capital) because, given that interest from debt capital is tax-deductible, banks would have incentives to increase, at least marginally, the level of debt-like capital. On 1. Greenlaw, Hatzius, Kashyap and Shin (2008) estimate the mortgage credit losses and highlight the role of leverage and mark-to-market in propagating the shock. Brunnermeier (2009) explains the economic mechanisms that caused losses in the mortgage market to amplify into the large dislocations and turmoil in the financial markets. 2 The main focus of this literature is on analyzing how financial innovation has impacted on banks’ performance and how it sustained the excessive growth in loans Almazán, Martín-Oliver and Saurina (2015), Loutskina (2011), Loutskina and Strahan (2009). 3 Basel I regulation applied during the whole sample period..
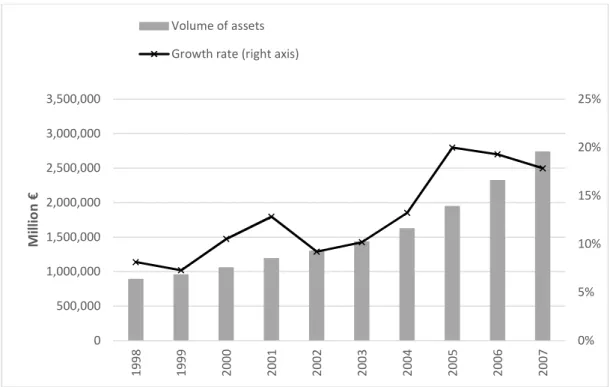
(29) 1.1. Introduction. 13. the other hand, the pecking order theory would predict that banks prefer to issue debt-like instruments before equity capital because the former has lower informational costs. All in all, the application of both theories would predict a non-zero amount of debt-like capital in regulatory capital, that is, banks have incentives to deviate from the composition of capital that maximizes its loss-absorbing capacity (i.e., 100% equity capital). The strategy followed in this paper is as follows. First, we test whether the predictions from the corporate finance theories of capital structure also apply to the banking firm. This is a natural step before testing the main hypotheses of leverage in capital. In a second step, we test whether the predictions from corporate finance also apply to the leverage in capital. We use a database of Spanish banks during the period 19982007 of relevant financial variables drawn from Bankscope. The reason why we focus on Spanish banks is because the deterioration of capital has been pointed as one of the factors that explains the large losses and the deep restructuring that the sector experienced after the outburst of the crisis (Martín-Oliver et al., 2018). Moreover, the growth rates of balance sheets were of two digits during the years prior to the crisis (Figure 1) that were financed mainly with securitization of assets (Almazán et al., 2015), which might have implied large changes in the structure of liabilities.. Figure 1 Volume of assets (m€) and asset growth rate of Spanish banks, 1998-2007 Volume of assets Growth rate (right axis) 3,500,000. 25%. 3,000,000. 20% 15%. 2,000,000 1,500,000. 10%. 1,000,000 5%. 500,000. 2007. 2006. 2005. 2004. 2003. 2002. 2001. 2000. 0% 1999. 0 1998. Million €. 2,500,000.
(30) 14. Chapter 1 Our paper is related with the literature that analyzes the capital structure of non-. financial firms and of banks. The limited number of studies on bank capital structure contrasts with the extensive literature4 that analyzes the determinants of leverage for nonfinancial firms.5 Summing up the findings of this literature, it is generally accepted that there is a limited list of factors that are correlated with cross-sectional differences in leverage (Frank and Goyal, 2008): leverage is positively related with size and tangibility of assets and it is negatively related with profits, growth and dividends. More recently, Lemmon, Roberts and Zender (2008) found that leverage ratios are mainly explained by time invariant, unobservable factors that are idiosyncratic for each firm. For the bank firm, it has been argued that the corporate finance theory cannot be applied to banks because they have the obligation to fulfill capital regulation and, thus, leverage ratios are exogenously determined. In this sense, there is a large literature that studies how to determine the levels of regulatory capital and the micro and macro effects derived from capital regulation (Repullo and Suárez, 2013; Repullo, Saurina and Trucharte, 2010; Ayuso, Pérez and Saurina, 2004). The strict interpretation of this statement would determine a given leverage ratio that would only respond to external regulation rather than to corporate finance incentives (Mishkin, 2000). However, this theory is not supported by data, given the dispersion observed in leverage ratios. Gropp and Heider (2010) found for a sample of large US and European banks that cross sectional determinants of non-financial firms’ leverage also applied to banks’ leverage, being the role of capital regulation and the role of deposit insurance of second-order importance. This Chapter contributes to the previous literature in a variety of fields. First, our paper is the first to analyze how banks determine their composition of regulatory capital of banks. Mehran et al. (2012) and Acharya et al. (2011) provide descriptive evidence of the phenomenon, but there is no empirical analysis of the reasons that explain this deterioration, probably because it was thought that capital regulation determined the composition of regulatory capital. Second, we provide evidence that the leverage in capital of banks responds to the same predictions than leverage ratios of non-financial firms. This finding reveals that banks have incentives to deviate from the composition of 100% equity capital that maximizes the capacity to absorb losses, towards a composition that includes debt-like capital to benefit from lower costs of financing and reduce the 4. See Harris and Raviv (1991) and Frank and Goyal (2008) for a survey. For instance, papers by Bradley et al. (1984), Long and Malitz (1985), Titman and Wessels (1988), Crutchley and Hansen (1989), Smith and Watts (1992) and Frank and Goyal (2009). 5.
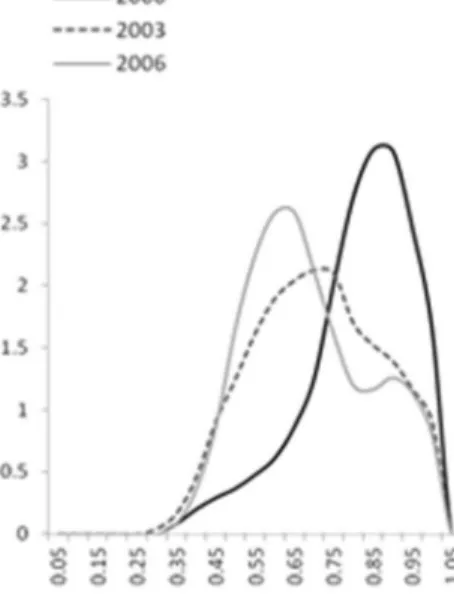
(31) 1.1. Introduction. 15. level of taxable income. In this sense, we find that cajas with high-growth rates in the pre-crisis period significantly increased the level of leverage in capital, which might partly explain the inability of their capital to absorb losses during the crisis. Third, corporate finance predictions also apply to the choice of the leverage ratio of banks. Despite all banks in the sample present regulatory capital ratios above the regulatory minimum, there is a large dispersion in the leverage ratios of banks that responds to the same variables as capital ratios in non-financial firms. Indeed, banks have increased their leverage ratios while maintaining strong regulatory capital ratios. Fourth, this chapter provides at least two policy implications related with Basel III. On the one hand, it justifies the increase in the requirements of equity capital within the regulatory capital to increase its loss-absorbing capacity. On the other hand, it justifies the inclusion of a simple, non-risk based measure of leverage in the Basel III framework to avoid that banks build up excessive leverage while apparently keeping high levels of regulatory capital ratios. The rest of the Chapter is structured as follows. Section 2 analyzes the theoretical setup of the leverage equation applied to banks. Section 3 presents the database and some descriptive statistics of the variables. Section 4 presents the results of the estimations and, finally, Section 5 contains the conclusions of the Chapter.. 1.2 Determinants of leverage 1.2.1 Some evidence on leverage in banks We first provide some preliminary descriptive evidence that neither leverage nor leverage in capital are homogeneous across banks because of the existence of capital regulation (Mishkin, 2000). Figure 2A presents the distribution of the leverage ratio for Spanish banks for years 2000, 2003 and 2006 and Figure 2B presents the dispersion of the Basel ratio for Spanish banks during the same period. We confirm that there is a wide dispersion in the levels of both ratios and that, despite the fact that all banks present a Basel ratio no lower than 8% to fulfill with regulation, there are banks with high levels of leverage as we find banks with a ratio of equity capital with respect to assets at book value lower than 3%. Nonetheless, if we observe the evolution of the distributions of the capital ratios over.
(32) 16. Chapter 1. time, we can see that both the distribution of the book capital ratio and the Basel capital ratio have remained fairly stable over time, though the former is concentrated in values smaller than 10%. This constant distribution of ratios over the years suggests the existence of a constant heterogeneity across banks in optimal capital structures, that is, capital ratios are different across banks, but these differences are maintained over time. Figure 2 Yearly distribution of capital ratios Figure 2A: Equity / Assets. Figure 2C: Equity / (Equity+Pref.Shares+Subord.Debt). Figure 2B: Basel Coefficient.
(33) 1.2 Determinants of leverage. 17. As for leverage in capital, Figure 2C provides evidence of the increase in the weight of hybrid instruments, that is, a deterioration of Spanish banks’ capital over time. The composition of capital has been evolving towards a structure in which debt-like instruments have become more important, which confirms that the deterioration of capital documented in Acharya et al. (2011) has also been a characteristic of Spanish banks prior the crisis.. 1.2.2 Determinants of leverage in non-financial firms and banks In this Chapter, we borrow the predictions from the corporate finance theory to explain the leverage in capital, and also extend some hypotheses for the banking firm. As a first step, we test whether the decisions of leverage in the bank firm are driven by the same forces that determine leverage in non-financial firms. Second, we analyse whether the determinants of capital structure can also explain the choice of the composition and quality of regulatory capital. The logic is that banks, besides capital regulation, might respond to the same incentives as non-financial firms. For instance, banks also benefit from holding debt or debt-like capital because these instruments generate interest payments that can be deducted from the tax bill. Also, banks’ issuances might also be affected by asymmetric information and, if so, the pecking order theory predict that banks would issue, first debt, next hybrid securities and, ultimately, equity capital, to minimize the discount value applied by financial markets. All in all, banks might have the same incentives as non-financial firms at the time of deciding their capital structure of debtequity and also at the time of determining the leverage in capital, even with the existence of capital regulation. Given that banks can fulfil their capital obligations with a combination of equity capital and debt-like capital in both Tier I and Tier II definitions, the particular choice made by each bank might respond to the same determinants than leverage. There is an extensive literature that has aimed at determining which factors are correlated with leverage, including papers by Titman and Wessels (1988), Crutchley and Hansen (1989), Smith and Watts (1992) and Frank and Goyal (2009) and they have converged to a limited list of variables that are related to leverage. The main bulk of this literature estimates the leverage equation, which is based on explaining the leverage ratio.
(34) 18. Chapter 1. in terms of the observable finance variables in order to test an effect or prediction. They aim at finding the cross-sectional determinants that explain the dispersion in leverage ratios across non-financial firms. The consensus establishes that leverage is positively related with size and tangibility of assets and it is negatively related with profits, growth opportunity and dividends. The reasons for these relationships are explained by different corporate finance theories of leverage (see Harris and Raviv, 1991 and Frank and Goyal, 2008 for a survey).. 1.2.3 Empirical model and variables In our analysis, we adapt the list of determinants to the banking industry and also explore alternative explanations specific for the banking firm. The variables considered in the analysis are6: Dividends. Dummy variable7 that identifies a bank that has issued dividends. The expected sign is negative because firms that pay dividend are possibly not financially constrained and these firms face a lower cost of raising equity at short notice. In the banking firm, we could expect a positive sign if banks were holding capital buffers, so as to avoid costs of issuing equity at short notice (Gropp and Heider, 2010) Growth Opportunities. It is defined as the ratio of market-to-book value of the capital of the bank8 and it captures the effect of growth and expansion opportunities of the bank. The expected sign is negative because the existence of investment. 6. See the Appendix of Chapter 1 for an exact definition of the variables. We follow Frank and Goyal (2009) and use a dummy variable of dividend status to identify nonconstrained firms. If we use the proportion of the dividend with respect to net profits, main results remained unchanged. 8 As we have cajas and some small commercial banks that are not listed in the stock market, we construct the market value actualizing the forecast of future profits at a discount rate that depends on the risk of the bank (see definition of variables in the Appendix of Chapter 1). Our measure has a high correlation with the market value since, for the observations for which we have data (237 observations), the coefficient of correlation and Spearman’s rho are 91.88% and 94.40%, both significant at 1%. We also obtain high correlation in the quartile regression at 50th percentile of the actual market value on our predicted value for the banks listed in the stock market, since the slope coefficient is 0.85 and intercept is 105.8, both significant at 1%. All the regressions in the Chapter have been estimated using the ratio of market-to-book value, GrowthOpp, replacing the market value by the predicted value for listed banks and the results do not change noticeably. 7.
(35) 1.2 Determinants of leverage. 19. opportunities increases the financial costs of distress and, consequently, the firm reduces leverage. Collateral. It is a measure of the tangibility of the assets available for the bank equal to the proportion of liquid assets that are easier to convert to cash and suffer a smaller loss of their value in case of distress. The trade-off theory then predicts that firms with more collateral will suffer smaller distress costs and will have more leverage. Nonetheless, in the banking firm we could obtain the opposite prediction, if the definition of collateral is closely related to liquidity. There are papers that have documented a relationship of complementarity/substitution between liquidity ratios and regulatory ratios that could affect this prediction9. Size: Leverage is expected to be positively related to size because they are more diversified and face lower risk of default. In the banking firm, this positive effect could be reinforced by the too big to fail paradox, that is, large banks are willing to take on more risks because they anticipate that the governments will not let them fail and, in this case, they could increase leverage because they could care less about financial risk. To account for this issue, we include the log of assets at the end of the period to capture this effect. ROA: It is the proxy of banks’ profits. Banks with higher profits would be less leveraged since they have more internal funds. However, if higher returns are linked to higher risk in the assets, we could obtain a positive relationship between ROA and leverage for the banking firm, because capital regulation sets higher capital requirements for riskier banks. This introduces the need of controlling for risk of the assets in the regression. Risk: Despite risk not being included in the list of reliable factors related to leverage, we include it in the regression to control for the indirect relationship between returns and capital ratio through the bank capital regulation. Our measures of risk will be the non-performing loan ratio (NPL) as a measure of the risk within the loan portfolio of the bank and the standard deviation of the ROA to capture the risk in the returns of the bank.. 9. Macedo and Vicente (2017)..
(36) 20. Chapter 1. Taking into account all the previous factors, our basic regression will be: Lit = 0 + 1 Divit-1 + 2 GrowthOppit-1 + 3 Collit-1 + 4 ROAit-1 + 5 ln Assetsit-1 + + 6 NPLit-1 + 7 Sd(ROAit-1)+ 8 Id(Savings Bank) + Time Dummies + uit. (1). where L is the measure of leverage and the expected signs of the coefficients are 1<0,. 2<0, 3>0, 4<0, 5>0, 6<0 and 7<0, according to the predicted effects and sub-index i and t respond to bank i and time t, respectively. The dependent variable of leverage is defined as one minus the ratio of equity and reserves over total assets. To test the hypothesis of whether the deterioration of regulatory capital (leverage in capital) responds to a leveraging process that follows the same patterns as the choice of the whole bank capital structure, we use the weight of equity and reserves with respect to the total regulatory capital, 1 −. , as the leverage. variable. All the regressions include time dummy variables as well as two dummy variables identifying whether the bank is a savings bank (as opposed to commercial bank) and whether the bank is listed in the stock market, to test whether these categories have any effect on leverage. All the variables are lagged one year, in line with the estimation of the standard leverage equation of previous papers, and standard errors are clustered at the bank-year level. Following previous papers, we estimate the leverage equation using OLS, but clustering the errors at two dimensions, bank and time.. 1.3 Database and descriptive analysis Our main source of data is Bankscope10 that provides annual information on balance sheet, P&L account and regulatory capital. In the case of missing values, we have been completed the information from the annual reports of banks. We use consolidated data of commercial and savings banks (the so-called cajas)11 operating in Spain during the period 1998-2007. Commercial banks differ from savings banks in their governance, ownership 10. Global database published by Bureau van Dijk that provides information of spreadsheet data (balance sheet and income statement) of financial institutions around the globe. 11 We exclude credit cooperatives because the data on NPL ratio and regulatory capital ratio was incomplete..
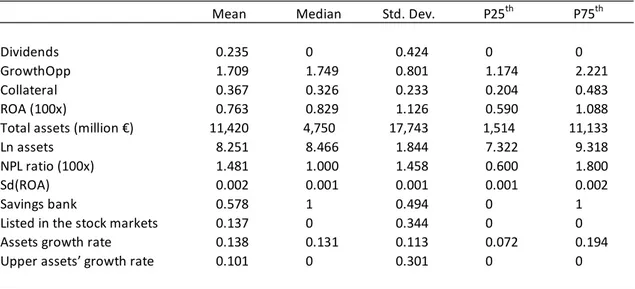
(37) 1.3 Database and descriptive analysis. 21. structure, and purpose. Commercial banks are for-profit organizations that belong to shareholders. Savings banks, on the other hand, are non-for-profit entities controlled by regional and local governments. The number of both types of financial institutions decrease the sample mainly because of the concentration of the sector through M&As; the number of commercial banks decreases from 40 in 1998 to 25 in 2007 and the number of cajas decreases from 52 in 1998 to 45 in 2007. Our period of analysis covers the years of booming and expansion of the Spanish and global economy and expansion of banks’ balance sheets. We exclude subsequent years of the financial crisis, when financial markets did not operate normally. Figure 1 shows that the total assets of Spanish banks increased during the whole period of study, especially in the second half where the slope of total assets became sharply steep with peaks of around 20% in 2005 and 2006. As stated in Almazán et al., 2015, the growth rate of Spanish balance sheets was mainly funded with the issuance of new instruments (securitization) in the financial markets. Table 1 provides descriptive statistics of the main variables used in our empirical models. We observe that only 23.5% of the observations correspond to banks that paid dividends during the year, GrowthOpp is centered at 1.7 in a symmetric distribution (similar value of the average and the median); 36.7% of the assets are, on average, liquid assets and the profitability of assets is around 0.7%. Entities are heterogenous with respect to size: bank in percentile 75th is more than 7 times bigger that the one in percentile 25th. As mentioned before, the sample period is characterized by high assets’ growth rate with an average of 13.8% and three quarters of the observations with a value over 7.2%. Our database is composed by 101 unique financial entities, 52 out of which are cajas that accumulates 57.8% of the observations in the sample. 13.7% of observations are from commercial banks listed in the stock markets, since cajas are not listed. Regarding variables related to risk measures, we observe that, on average, 1.5% of loans granted are non-performing..
(38) 22. Chapter 1. Table 1 Descriptive statistics of explanatory variables. Spanish banks, 1998-2007. Dividends GrowthOpp Collateral ROA (100x) Total assets (million €) Ln assets NPL ratio (100x) Sd(ROA) Savings bank Listed in the stock markets Assets growth rate Upper assets’ growth rate. Mean. Median. Std. Dev.. P25th. P75th. 0.235 1.709 0.367 0.763 11,420 8.251 1.481 0.002 0.578 0.137 0.138 0.101. 0 1.749 0.326 0.829 4,750 8.466 1.000 0.001 1 0 0.131 0. 0.424 0.801 0.233 1.126 17,743 1.844 1.458 0.001 0.494 0.344 0.113 0.301. 0 1.174 0.204 0.590 1,514 7.322 0.600 0.001 0 0 0.072 0. 0 2.221 0.483 1.088 11,133 9.318 1.800 0.002 1 0 0.194 0. Definition of variables in the Appendix of Chapter 1.. 1.4 Results 1.4.1 Determinants of leverage in banks Table 2 presents the results of the estimation using the leverage ratio defined as 1 − . The first column reports the basic specification drawn from the corporate finance theory that does not include neither risk variables nor dummies of savings banks or listed firms. The second column includes all the explanatory variables. We observe that the coefficient of the first set of variables included are not affected when we control for risk variables, so we focus on the second column to analyze the results. As predicted, ROA is negatively related to leverage and the size increases the leverage of banks, both effects significant at 1% and 5%, respectively. More concretely, an increase of 1 percentage point in ROA implies a decrease of leverage by 1.6 basis points. Also, an increase of 1% in the level of total assets is associated with an increase in leverage by 1 basis points. Thus, total assets of Spanish banks increased at an average growth rate of 12.9% during the whole period of study (1998-2007) causing an increase in banks’ leverage of 12.9 basis points..
(39) 1.4. Results. 23. Table 2 Estimation of bank’s leverage ratio (1). (2). Dividends. -0.001 (0.006). -0.001 (0.005). GrowthOpp. 0.000 (0.005). -0.004 (0.005). Collateral. -0.001 (0.019). -0.009 (0.018). ROA (100x). -0.013** (0.006). -0.016*** (0.004). Ln assets. 0.017*** (0.004). 0.010** (0.003). NPL ratio (100x). -0.003 (0.003). Sd(ROA). -14.107*** (2.923). Savings bank. 0.023** (0.010). Listed in the stock markets. 0.016 (0.014). Intercept No. of observations 2. Adjusted R Time dummies. 0.794*** (0.026). 0.877*** (0.028). 804. 804. 0.299 Yes. 0.464 Yes. The results are from OLS. The dependent variable of leverage is defined as one minus the ratio of capital and reserves over total assets. The explanatory variables refer to the value in year t-1. Definition of variables can be found in the Appendix of Chapter 1. The robust standard errors corrected for clustering at the bank and year level are in parenthesis. p < 0.01 = ***, p < 0.05 = **, p < 0.1 = *.. In addition to this, the risk captured by the standard deviation of profits negatively affects the leverage ratio, possibly because of the capital regulation. Given that Basel obliges banks with higher risk-weighted assets to hold higher proportion of capital, Sd(ROA) could be acting as a proxy of the risk of the assets of the bank..
(40) 24. Chapter 1 Next, we observe that savings banks tend to be more leveraged than commercial. banks (p-value of 5%). This coefficient could be an indicator of higher financial risk of savings banks. Nonetheless, lower leverage can also be observed in banks with low-risk assets given that Basel regulation requires lower capital requirements. The rest of coefficients are not statistically significant. For the variables capturing the predictions of the corporate finance theory, neither the coefficient of dividends nor the coefficient of collateral are statistically significant for our sample. Our results suggest that, far from being exclusively determined by capital regulation, the leverage ratios of banks are optimized following the patterns empirically observed in non-financial firms.. 1.4.2 Determinants of leverage in capital of banks Now we raise the question on how the quality of bank capital has been affected during a period in which banks have been continuously issuing hybrid instruments (subordinated debt, preferred shares, …) and new financing tools (securitization). Figure 3 shows evidence of deterioration in the quality of capital, since the ratio of one minus core capital to total regulatory capital has increased, from 8.4% in 1998 to 19.3% in 2007. Now we use this ratio as the dependent variable of the leverage equation to test whether the increasing proportion of hybrid capital is the result of a leveraging process within the regulatory capital that responds to the same determinants than the standard leverage ratio..
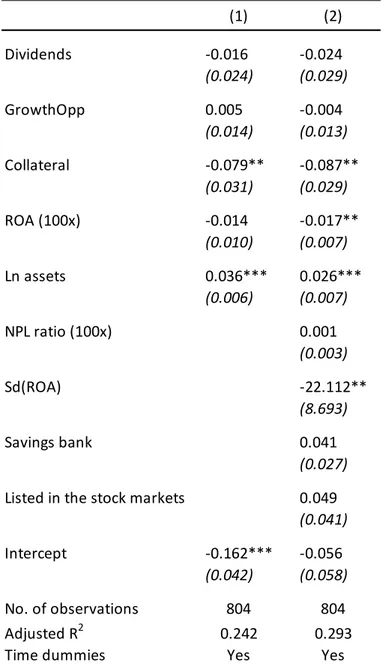
(41) 1.4. Results. 25. Figure 3 Leverage ratio, Basel ratio and Leverage in capital. Average across banks. The results are presented in Table 3. Column I presents the results without the risk and dummy variables that identify the type of banks, and Column II presents the model with all the variables. We find that the choice of the weight of debt-like instruments within the regulatory capital depends on the same determinants of the corporate finance as the standard leverage ratio, that is, it increases with the size of the bank, significant at 1%, and decreases with the profits and the risk of the bank, both of them significant at 5%. The positive relationship with size might also be explained in banking because of the too big to fail problem, that is, larger banks have incentives to take on more risks and, in this case, they hold regulatory capital of lower quality. The variable Collateral is negative and statistically significant at 5%. Though against the prediction of the corporate finance theory, this result might be specific of the banking industry because, by construction, the variable Collateral is closely related with liquidity ratio, and Macedo and Vicente (2017) provide evidence that capital ratios and liquidity ratios can be tools acting as complements at the time of determining the level of risk of the bank12.. 12. Macedo and Vicente (2017) analyze the problem of a regulator that sets both capital and liquidity requirements to maximize social welfare in a framework in which a bank decides its level of solvency risk.
(42) 26. Chapter 1. Table 3 Estimation of bank’s leverage in capital ratio (1). (2). Dividends. -0.016 (0.024). -0.024 (0.029). GrowthOpp. 0.005 (0.014). -0.004 (0.013). Collateral. -0.079** (0.031). -0.087** (0.029). ROA (100x). -0.014 (0.010). -0.017** (0.007). Ln assets. 0.036*** (0.006). 0.026*** (0.007). NPL ratio (100x). 0.001 (0.003). Sd(ROA). -22.112** (8.693). Savings bank. 0.041 (0.027). Listed in the stock markets. 0.049 (0.041). Intercept. -0.162*** (0.042). No. of observations 2. Adjusted R Time dummies. -0.056 (0.058). 804. 804. 0.242 Yes. 0.293 Yes. The results are from OLS. The dependent variable of regulatory capital ratio is defined as the weight of equity and reserves with respect to the total regulatory capital. The explanatory variables refer to the value in year t-1. Definition of variables can be found in the Appendix of Chapter 1. The robust standard errors corrected for clustering at the bank and year level are in parenthesis. p < 0.01 = ***, p < 0.05 = **, p < 0.1 = *.. Finally, the coefficients of the time dummy variables (not shown) present an increasing trend, what implies that the leveraging in capital is increasing over time, even after controlling for the variables included in the regression. These two findings, positive. facing a risk-return trade-off. They show that liquidity and capital requirements complement each other when the cost of capital or the return on loans is high and offset each other otherwise..
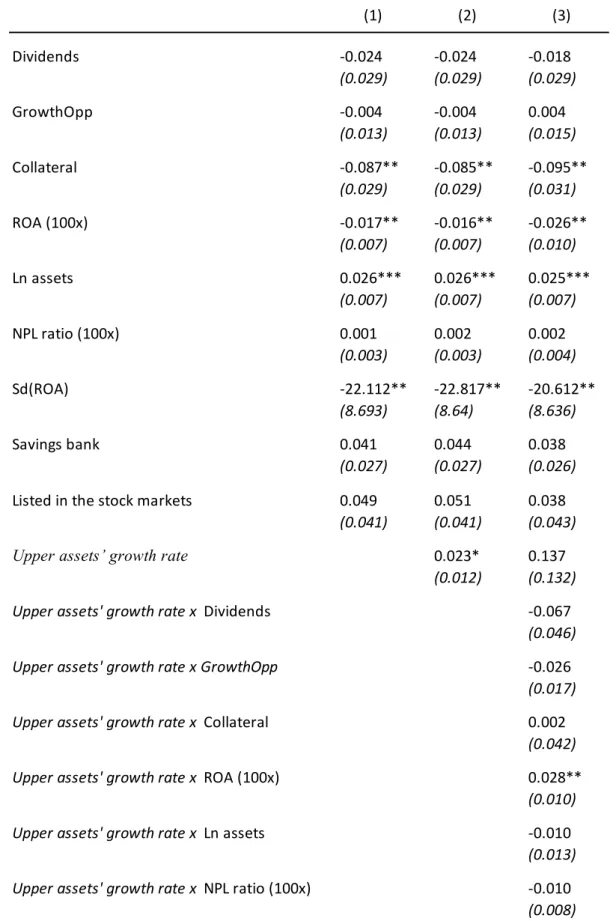
(43) 1.4. Results. 27. and significant coefficient of size and increasing trend of time dummies, can explain the positive trend observed in the evolution of the leverage in capital in Figure 3. Our results support the initial hypothesis that banks consider hybrid instruments within regulatory capital as having debt properties and they have increased the proportion of hybrid instruments in the same way that they choose the optimal proportion of debt in their capital structure. Therefore, the constant evolution of the Basel ratio hide the deterioration of regulatory capital, since banks were substituting part of their core capital by hybrid capital to fulfill the capital regulation.. 1.4.2.1 Leverage in capital and growth of banks To further explore the result of whether banks with higher growth of assets are those that experienced a higher deterioration in capital, we present in Table 4 the estimation of the leverage in capital including dummies that identify banks with growth rates higher than the percentile 90th of the distribution of growth. The third column of Table 4 shows that the interaction of the dummy of high growth (90th percentile) is positive and statistically significant, whereas the coefficient of ROA without interaction remains negative and statistically significant. This implies that the prediction of the negative effect of profits on leverage stated by the corporate finance theory (higher profits means higher core capital and lower leverage in capital) does not apply for banks that are experiencing high growth. Instead, more profitable banks that are experiencing large growth rates offset the negative effect found in Table 4, given that the sum of coefficients is not statistically different from zero (-0.026+0.028). Moreover, we find that the savings banks that are increasing the leverage in capital are those with a growth higher than 90th percentile, whereas the coefficient of savings banks without interaction indicates that the rest of cajas have no different behavior than banks. Therefore, we find that cajas with higher growth in assets were experiencing a decrease in the quality of their regulatory capital higher than banks, what could explain the higher losses that they suffered after the outburst of the crisis13.. 13. We have also calculated the value of the Upper asset’s growth rate dummy variable for percentiles 75th and 95th. We obtain similar results (available upon request) when interacting with dummy built using percentile 95th but not with percentile 75th..
(44) 28. Chapter 1. Table 4 Estimation of bank’s leverage in capital ratio including the impact of assets’ growth (1). (2). (3). Dividends. -0.024 (0.029). -0.024 (0.029). -0.018 (0.029). GrowthOpp. -0.004 (0.013). -0.004 (0.013). 0.004 (0.015). Collateral. -0.087** (0.029). -0.085** (0.029). -0.095** (0.031). ROA (100x). -0.017** (0.007). -0.016** (0.007). -0.026** (0.010). Ln assets. 0.026*** (0.007). 0.026*** (0.007). 0.025*** (0.007). NPL ratio (100x). 0.001 (0.003). 0.002 (0.003). 0.002 (0.004). Sd(ROA). -22.112** (8.693). -22.817** (8.64). -20.612** (8.636). Savings bank. 0.041 (0.027). 0.044 (0.027). 0.038 (0.026). Listed in the stock markets. 0.049 (0.041). 0.051 (0.041). 0.038 (0.043). 0.023* (0.012). 0.137 (0.132). Upper assets’ growth rate Upper assets' growth rate x Dividends. -0.067 (0.046). Upper assets' growth rate x GrowthOpp. -0.026 (0.017). Upper assets' growth rate x Collateral. 0.002 (0.042). Upper assets' growth rate x ROA (100x). 0.028** (0.010). Upper assets' growth rate x Ln assets. -0.010 (0.013). Upper assets' growth rate x NPL ratio (100x). -0.010 (0.008).
(45) 1.4. Results. 29. Table 4 Estimation of bank’s leverage in capital ratio including the impact of assets’ growth (continued) (1). (2). (3). Upper assets' growth rate x Sd(ROA). -10.116 (19.207). Upper assets' growth rate x Savings bank. 0.105* (0.061). Upper assets' growth rate x Listed in the stock markets. 0.134* (0.071). Intercept. -0.056 (0.058). -0.059 (0.058). -0.051 (0.057). No. of observations Pseudo-R2 Time dummies. 804 0.293 Yes. 804 0.294 Yes. 804 0.304 Yes. The results are from OLS. The dependent variable of regulatory capital ratio is defined as the weight of equity and reserves with respect to the total regulatory capital. Upper assets’ growth rate is a dummy variable that takes the value of 1 if the asset’s growth rate is higher than or equal to the value of 90th percentile of the bank-year asset’s growth rate distribution. The explanatory variables refer to the value in year t-1. Definition of variables can be found in the Appendix of Chapter 1. The robust standard errors corrected for clustering at the bank level are in parenthesis. p < 0.01 = ***, p < 0.05 = **, p < 0.1 = *.. For robustness purposes, we have run all the models of the paper excluding year 2007, given that it could be considered a year of crisis (outburst of subprime crisis in august) and there were significant modifications in the tax legislation that could have affected the results. The results are relatively stable and the main conclusions remain unchanged..
(46) 30. Chapter 1. 1.5 Conclusions This Chapter explores how banks financed their growth during the period prior the current financial crisis and the consequences on the quantity and quality of the bank capital. We adopt an approach that adapts the traditional leverage equation used in the corporate finance theory to explain leverage of non-financial firms including risks’ determinants relevant to the banking industry. It has been argued that bank leverage is determined by regulation because of their obligation to fulfil the capital regulation set at supra-national level (Mishkin, 2000). However, the empirical data shows that, far from being homogeneous, there is dispersion in the leverage ratio across banks. Using a sample of Spanish banks during the period 1998-2007 that uses data from Bankscope, we find that the variability of leverage ratios across banks can be explained by the theories of corporate finance accepted for nonfinancial firms. We also find that the same incentives govern the choice of banks when deciding the composition of debt-like capital and equity capital to fulfil their obligations set by capital regulation. That is, we provide evidence that the increasing weight of hybrid capital can be read as a leveraging process within the regulatory capital, since there is an increment of the debt-like instruments with respect to the common capital that responds to the same determinants than the standard leverage ratio. Therefore, the observed constant levels of risk-adjusted capital ratios were hiding a deterioration of the quality of capital, because banks increased the weight of debt-like capital that were eligible to fulfil their capital requirements in both Tier 1 and Tier 2. This leverage in capital presents an increasing trend during the period, even after controlling for these determinants of leverage. Furthermore, we find that banks, specially savings banks, that experienced higher growth rates during the pre-crisis period targeted a higher proportion of debt-like instruments in their regulatory capital. This might explain why the capital of these banks could not absorb losses during the crisis. The findings of this Chapter can be used as arguments in favour of the stricter definition of regulatory capital set in the new Basel III. Given that we show that banks have incentives to decrease the quality of their regulatory capital, the new higher requirements in terms of equity capital will limit the potential deterioration of capital..
Figure
+7

Documento similar
The expansionary monetary policy measures have had a negative impact on net interest margins both via the reduction in interest rates and –less powerfully- the flattening of the
In the “big picture” perspective of the recent years that we have described in Brazil, Spain, Portugal and Puerto Rico there are some similarities and important differences,
To determine how public authorities should manage curbside and garage parking, Chapter 2 analyzes the impact of garage fee and curbside regulation characteristics (fee and types
In the preparation of this report, the Venice Commission has relied on the comments of its rapporteurs; its recently adopted Report on Respect for Democracy, Human Rights and the Rule
In the previous sections we have shown how astronomical alignments and solar hierophanies – with a common interest in the solstices − were substantiated in the
Díaz Soto has raised the point about banning religious garb in the ―public space.‖ He states, ―for example, in most Spanish public Universities, there is a Catholic chapel
teriza por dos factores, que vienen a determinar la especial responsabilidad que incumbe al Tribunal de Justicia en esta materia: de un lado, la inexistencia, en el
The redemption of the non-Ottoman peoples and provinces of the Ottoman Empire can be settled, by Allied democracy appointing given nations as trustees for given areas under
