Economic and financial analisis SECUOYA
35
0
0
Texto completo
(2) ECONOMIC AND FINANCIAL ANALYSIS SECOUYA. Libe Criado Izaguirre. ABSTRACT As we will see later in this paper we focus on the analysis of the company Secuoya communications group which is listed on the MAB stock market. From 2011 the company enters in the MAB to start expanding and get funding to consolidate itself in the sector. In this paper we are going to detail both the history and relevant data about the company. In addition we will carry out a significant economic and financial analysis about the company, which will help in the future to make decisions. On the other hand, an analysis of ratios of the sector which is located the firm to find out what is different from the companies in the sector. As a result of all these, we will be able to draw some conclusions on the results of the company and know if it expects a prosperous future. In addition to seeing how it is positioned in the market.. 2.
(3) ECONOMIC AND FINANCIAL ANALYSIS SECOUYA. Libe Criado Izaguirre. INDEX I. Introduction ................................................................................................................ 5 II. Secuoya communication group ................................................................................. 7 Company history until arrival at MAB ......................................................................... 7 Business areas .......................................................................................................... 7 Strategic plan ............................................................................................................ 9 Competitive advantages .......................................................................................... 10 III. Methodology .......................................................................................................... 12 Company information: .......................................................................................... 12 Information on accounting data: ........................................................................... 12 Information about the sector ................................................................................ 13 IV. Economic and financial performance ..................................................................... 14 Financial performance ............................................................................................. 14 Active................................................................................................................... 14 Liabilities and equity ............................................................................................ 16 Working capital .................................................................................................... 18 Liquidity Ratio ...................................................................................................... 19 Debt ratio ............................................................................................................. 20 Economic evolution ................................................................................................. 22 Average collection period Customer .................................................................... 24 Return on assets.................................................................................................. 25 Financial profit ..................................................................................................... 26 ROA and ROE comparison .................................................................................. 27 V. Comparison with the sector .................................................................................... 28 Operating costs, profits and returns ......................................................................... 29 Financial income and expenses .............................................................................. 31 Asset structure ........................................................................................................ 31 Liability structure ..................................................................................................... 32 VI. Conclusions ........................................................................................................... 33 VII. Bibliography.......................................................................................................... 35. 3.
(4) ECONOMIC AND FINANCIAL ANALYSIS SECOUYA. Libe Criado Izaguirre. LIST OF FIGURES Figure 1: Associated companies and brands................................................................. 9 Figure 2: Advantages by area ..................................................................................... 10 Figure 3: Active non-current ........................................................................................ 14 Figure 4: Current assets ............................................................................................. 15 Figure 5: Total Active .................................................................................................. 16 Figure 6: Equity........................................................................................................... 16 Figure 7: Non-current liabilities.................................................................................... 17 Figure 8: Current liabilities .......................................................................................... 18 Figure 9: Working capital ............................................................................................ 18 Figure 10: Graphic Working capital ............................................................................. 19 Figure 11: Ratio liquidity ............................................................................................. 20 Figure 12: Graph ratio liquidity .................................................................................... 20 Figure 13: Debt ratio ................................................................................................... 21 Figure 14: Graph of debt ratio ..................................................................................... 21 Figure 15: Counting profit loss .................................................................................... 23 Figure 16: average collection period to clients ............................................................ 24 Figure 17: Return on Assets ....................................................................................... 25 Figure 18: Financial profitability................................................................................... 26 Figure 19: Comparison in the sector ........................................................................... 28 Figure 20: Net economic result / Net turnover ............................................................. 30 Figure 21: Net economic result / Total assets ............................................................. 30 Figure 22: Result after taxes/ Equity ........................................................................... 31 Figure 23: Equity / Total equity and liabilities .............................................................. 32. 4.
(5) ECONOMIC AND FINANCIAL ANALYSIS SECOUYA. Libe Criado Izaguirre. I. Introduction Today many people are interested in the business sector, specifically in the financial sector to get a return from their savings. These people are often interested in listed companies such as IBEX 35 or MAB among many other firms. In this case, we have chosen a company that works in the MAB because we believe that not everyone knows this market. The 99% of Spanish companies are small or medium-size. But what is the MAB? The Alternative Investment Market is a market oriented to companies with low capitalization, namely small and medium sized companies, which seek to expand with a tailor made regulation, designed specifically for them with costs and processes adapted to their characteristics. After choosing their company, we thought what people would want to know about these companies when investing in them and at the same time about how these companies know if their companies are profitable or are taking adequate decisions for their own growth. Therefore, the objective of this work is to know the company and in addition get to know the economic and financial returns from the division of economic evolution, in which the balance and ratios related to them are evaluated and the financial evolution will also be valued with ratios such as ROE and ROA. In addition, it will be done in such a way that any reader with or without knowledge of the financial sector can make their own conclusions from this company. So the work will be done with data from 2011 to 2014. For all these reasons we choose the company Secuoya, an expanding company trying to grow in the sector besides trying to expand in similar sectors. This company operates in a highly competitive industry such as telecommunications. For this, the company seeks funding and settle to catch name in telecommunications. So, in order to analyze Secouya’s trajectory, we will begin by talking about the methodology used to find information of the company, the history of the company to know the beginning of this, the business areas in which it works, although with the pass of time increase, its strategic plan for the following years and its competitive advantages, that means, so the company stands out.. 5.
(6) ECONOMIC AND FINANCIAL ANALYSIS SECOUYA. Libe Criado Izaguirre. Then we are going to analyze the economic and financial performance, starting with the economic evolution where balance is analyzed, working capital, the liquidity ratio and debt ratio. Then we will analyze financial evolution in which to enter the profit and loss account, the average period of collection of clients, the return on assets and return on equity. In addition, we will also compare the company Secuoya with the telecommunications sector in which it works. Thus, we will observe its position in the sector and how could the company improve in the future to be able to have a bigger weight in this sector. As we will see at the end of work on the conclusion section the data of the firm obtained are positive and improvable. They are upgradable and this is because it is in the growth phase and therefore the company does not seem profitable as it could be in the future due to the debt but analyzing why it is necessary.. 6.
(7) ECONOMIC AND FINANCIAL ANALYSIS SECOUYA. Libe Criado Izaguirre. II. Secuoya communication group Company history until arrival at MAB The company secuoya communication group is a company born on September 11th, 2007 by D. Raul Berdones Montoya as sole shareholder and company founder. On this date, the object of the society was the holding of shares and management, administration and business consultancy in the communication sector. In addition to the acquisition, construction, sale, promotion, leasing and exploitation of real estate. Since 2008 secuoya has grown based on the search for niches with attractive returns in the market for audiovisual production, for which it has diversified its activity in certain lines of business. It was also at this time when the activity for Central Broadcaster Media SLU starts. In 2009, it joined as a partner Gil D. José Pablo Jimeno and through the Central Broadcaster Media company obtains the adjudications with Antena 3 Television related to the technical services of the ENG cameras and another with the services of postproduction audio and video of the channel. During the 2010 financial year, the firm was consolidated as a producer of content News SLU, premiering 10 formats in different channels at national and regional level. In addition it accelerates its activity with the launching to the market of the brand "Millenium" with the beginning the operations consulting services in technical means. But it is in 2011 where over the years the structure has allowed it to play a significant role inside the Spanish audiovisual sector and experience significant increases in its turnover, with the exit to the MAB, it is proposed to attract new resources to implement its Strategic Expansion Plan focused mainly on the organic growth of Society.. Business areas Content Area Creates and produces content for all customers regardless of the size of its channel and its area of influence. The content area is composed of three main areas, entertainment, factual and fiction.. 7.
(8) ECONOMIC AND FINANCIAL ANALYSIS SECOUYA. Libe Criado Izaguirre. Service area It provides solutions and services for all operating needs for producers and television networks. Such as outsourcing, internalization of functions; outsourcing business processes and support; technical and human project materials; Audio and video postproduction; ENG equipment management; Current supply of images; maintenance and technical facilities and advisory, design and execution of audiovisual projects. Digital area The digital environment is characterized by rapid and continuous evolution. Therefore Secuoya is committed to a constant updating of trends, new tools and digital strategies. For this reason, it creates and optimizes channels and digital content, ensuring the drafting and dissemination of content that are appropriate to the digital environment. TV area This area is composed of the channels belonging to the group in all ambits (national, regional, payment or internet). It coordinates its role in relation to audience, management and content objectives and establishes synergies that generates its raison d’être. In addition, also it detects opportunities in pay per view TV, approaching movements of the sector and attending to the new market niches that are based on the digital world. Corporate area This area offers audiovisual solutions and digital communication solutions: creating, producing and distributing branded content with media capacity and experience in the television audiovisual industry where this firm is so distinguished.. 8.
(9) ECONOMIC AND FINANCIAL ANALYSIS SECOUYA. Libe Criado Izaguirre. Figure 1: Associated companies and brands. SECUOYA. Contents. Services. Secuoya contents. Secuoya services. New atlantis. Cbmedia Cbm BGL WIKONO.co m DRAGO. Digital. Secuoya digital. TV. Corporate. TEN 7 TV. Secuoya corporate VNEWS. GRADA1 GLACCI VIEWIN. As we can see in Figure 1, according to the performance area Secuoya has several affiliated companies and various brands in each of these.. Strategic plan . Services CBM expansion through outsourcing operational areas TV. Private and public television channels, both national and regional, in view of it needs to reduce costs and its structure, are outsourcing operational areas, especially those that require personnel and technical resources. Implementation of "City TV" Secuoya provides for obtaining funding for the development of this project that aims to create one of the largest audiovisual groups of Spain and which boost from company B & S Broadcast Corporation SLU WIKONO franchise development Currently Wikono is located in 8 cities of the country. Therefore it aims to develop the brand in all the Spanish provinces. Digital Brand positioning Interctive. 9.
(10) ECONOMIC AND FINANCIAL ANALYSIS SECOUYA. . Libe Criado Izaguirre. Contents Boosting. the. contents. of. fiction. through. the. producer. 2BLE. FILO. PRODUCTIONS SLU Secuoya believes that fiction products are the products with the greatest potential for growth given the increase in the interest of the television networks to include this type of content in their line-ups. In order to get the loyalty from the audience, favor identification with the image of the channel and generate high audience share. Consolidation of production formats Development of new formats for TV networks . Marketing and Communication Development of own events with guaranteed returns prior to the event. Based on a line of work in the design and development of own events, based on the premise of zero risk. Seeking to create relevant actions to brands and attractive to the end customer. Enabling dialogue between the customer and the advertiser. Development of communication services based on new technologies Through corporate videos, video-communications and video news. In addition to increasing the range of applications and dynamizations websites on social networks.. Competitive advantages There are various aspects to consider the competitive advantage of Secuoya among which are: . Integration into the value chain of audiovisual production and presence in the niche sector of activity: Figure 2: Advantages by area. Source: Secuoya information document. 10.
(11) ECONOMIC AND FINANCIAL ANALYSIS SECOUYA. Libe Criado Izaguirre. As we can see in Figure 2 several companies and brands are in this niche but a total of 8 companies and nine brands are at the value chain reporting high synergies and promoting the growth of its business lines. . Recurrence Thanks to the high loyalty of existing customers for being considered a key service provider, within the production process and the duration of contracts the company long-term recurring income is assured.. . Flexible structure adapted to demand. Secuoya has a fixed capital adapted to new market requirements. Since with the great changes that the sector it is difficult to always have the necessary fixed assets since it can become obsolete in short time. That is why this firm has been able to make the most efficient use of its resource and services thanks to the fact that the investments it makes for the assents are linked to contracts, thus minimizing the risk of underutilization and applying adeferred amortization to the duration of the contracts In addition, Secuoya focuses its costs to minimize fixed costs, favoring a very flexible structure costs that varies depending on the contracts in place at progress at any given time.. . Differential factors Independent leader of large communication groups. Trajectory of success, doubling sales figures and results year by year. Differential and successful business model. Strategic plan for expansion to new niches with high growth potential. Low debt, since this is tied to contracts.. 11.
(12) ECONOMIC AND FINANCIAL ANALYSIS SECOUYA. Libe Criado Izaguirre. III. Methodology For the development of the study we selected the company Secuoya for its growth. The study tries to reflect the economic and financial situation from 2011 to 2014. To begin this job, our first step is to have the structure clear and from there start my search. . Company information: Our first step has been to find out about the company´s operating activity and its history. In order to do as this company is listed on the MAB it looks for it on this website and on the website of Secuoya but we fail to find this information. So that, we try to put on the Internet "information about the history of Secuoya", so we get a document in which we get the data of history, airline business, strategic plan and its competitive advantages. Complementing this information with the information available on the website of the company.. . Information on accounting data: To begin deepening on economic and financial viability, the first thing is to get the balance sheet data and the profit and loss account. Thanks to the database of the university in which is the Sabi program where many company financial data is stored. In this database, we find the numerical data and the PYG of the year 2014 to 2012. Therefore with this data we start with the economic and financial analysis based on the balance sheet and profit and loss accounts. Thanks to all the learning these years in the university we will analyze the assets, liabilities and equity, in addition to financial income and expenses. But when we want to get deeper into the subject we will calculate financial ratios such as the working capital, the liquidity ratio and the debt ratio, where we can observe if the company is viable and if it manages to get all its profit in the operating activity. On the other hand, the economic ratios estimated by them as the return on assets, return on equity and the average customer collection period. In which I get to find out if you make the best use of its assets and liabilities to make money.. 12.
(13) ECONOMIC AND FINANCIAL ANALYSIS SECOUYA. . Libe Criado Izaguirre. Information about the sector In order to get the information on the sector we first identify the data that we want to obtain. As the work is about ratios and financial economic analysis we look for the way to get the ratios of the sector. For this we look for the information in the Bank of Spain, specifically in the central of balance sheets, looking for the ratios, so when we go to the website we look for the central balance sheet, database and later to sector ratios of non-financial corporations since Secuoya is a private company Once this section we will consult sectoral ratios by exercise, size activity ... Where we will specify that it is a private company in which we will compare the company with the sector in Spain. And we will get into sectoral consultation ratios. In this last section we will specify in which sector it is “(J59) Cinematographic, video and television programs, sound recording and music publishing”. We will also specify the exercise that will be 2014 which is our last calculated year. The size depends on the net figure of business that in our case is greater than 5o million euros and the country Spain.. In conclusion with the obtained data and to obtain we will be able to find out the functions of the company and the future that it hopes to have in the market. In addition to knowing if it is viable the vision of this company or to advise on how to improve its operation, which we will be able to make thanks to our knowledge acquired during the race as in the subject Analysis of the financial statements.. 13.
(14) ECONOMIC AND FINANCIAL ANALYSIS SECOUYA. Libe Criado Izaguirre. IV. Economic and financial performance The economic and financial analysis examines the ability of the company to generate profits and to meet its obligations to assess its future viability and make easier the decision making to improve the management of company resources and creating value. By analyzing the information of company we wanted to analyze its economic and financial structure. So we've subtracted information from the balance sheet and income statement.. Financial performance In order to analyze the data, we will first analyze the balance and what we visualize from this data to later on analyze the ratios of working capital, liquidity and indebtedness.. Active The asset consists on the money that is physically the money or the one deposited in a bank, the physical elements that the company counts for its operations and that have a permanent or temporary duration and the debts that the customers have with the company. Non-current assets are resources with a duration of more than one year and are not expect to be sold. They are mostly machines, cars, computers, patents ... which are also known as fixed assets. Figure 3: Active non-current. I II III IV V VI VII. NON CURRENT ASSETS Intangible assets Property, plant and equipment Investment property Non current investments in group Non current investments Deferred tax assets Commercial rights. 2014 2013 23.951.286 11.894.731 7.814.113 2.437.524 10.500.772 4.220.770 3.242.462 874.384 1.515.577 3.978. 1.838.891 2.284.286 712.038 401.222. 2012 10.859.468 2.492.213 4.426.867. 2011 7.825.554 1.014.912 4.846.113. 1.633.435 904.466 744.792 657.695. 718.513 331.848 914.168. 14.
(15) ECONOMIC AND FINANCIAL ANALYSIS SECOUYA. Libe Criado Izaguirre. Noncurrent assets consist of long-term investments, that is, more than one year; to have income. As we can see in Figure 3 on non-current assets the company has been a substantial increase in intangible assets which is maintained over time, but this increase is much higher in 2014. We could say that these are the stocks of the company. Productions that are not yet sold to a particular channel but have already been produced. As can be broadcasted rights that still have to be produced, which is an existence in the manufacturing process. On the other hand, tangible fixed assets from 2011 to 2013 have negative variations, that is, they are decreasing. This may be for sale or potential sale of obsolete assets. But in 2014 this is doubled by the investment for new projects or contracts signed. This increase is mainly due to joining the group in the catalog of documentaries and productions of society New Atlantis, as well as the ongoing work carried out by the Group in the development of new pilot programs and fiction series. At the same time, the investments of the group and associates increase, although the consolidated accounts are related to investments to associated companies which will give us some financial income. While the company´s long-term investments decrease. Finally we have to make reference as non-current commercial rights have disappeared over the years. Current assets have a duration of less than one year and are intended to sale. They are mostly raw materials or merchandise that will be sold or invoice, the debts your customers have with companies and money that your company has in cash or at bank. Figure 4: Current assets. I II III IV V VI VII. CURRENT ASSETS Non current assets held for sale Inventories Trade and other receivable Current investments in group Current investments Prepayments for current assets Cash and cash equivalents. 2014 2013 26.547.160 20.392.256 369.927 1.932.795 948.851 19.307.781 14.856.090 412.730 336.531 1.352.169 3.188.460 616.107 99.593 2.555.651 962.731. 2012 10.378.310. 2011 10.265.221. 559.277 7.583.143 147.509 1.226.433 65.076 796.872. 418.198 6.569.892 203.326 182.844 2.890.961. In Figure 4 shows the current assets where we find the goods or investments that it expects to settle in less than a year and to be able to obtain a profit.. 15.
(16) ECONOMIC AND FINANCIAL ANALYSIS SECOUYA. Libe Criado Izaguirre. On the one hand in 2014 we see how some assets are activated to be sold because they think they will be sold in less than twelve months. In addition we can also say that all large increases as we have said are the company and group companies.. The stocks correspond to audiovisual technology, marketing and advertising, technical equipment and even suppliers advances or advances for development work. That could be higher if part of their intangible assets put it in this account since they are already taxed programs waiting to sell stocks that could also be considered stocks which it is not the case. Furthermore, both customers and cash receivables increased by the growth of the company. But in trade debtors we can find personal advances. Figure 5: Total Active. TOTAL ASSETS. 2014 2013 2012 2011 50.498.446 32.286.987 21.237.778 18.090.775. The result of these variations can be observed in Figure 5 in the total assets. Where there is a large increase from 2013 to 2014 for all the companies of the group and brands that join the company.. Liabilities and equity Liabilities include all debts that the company has with its suppliers and the debts it has outstanding with banks and other financial institutions. On the other hand, the equity is associated with the contributions made by the partners and the profits and retained earnings by the company in addition to the possible subsidies. Figure 6: Equity. 2014 6.767.388 6.148.948 -2.154 208.826. 2013 3.024.862 2.747.553. 2012 2.647.981 2.270.091. 2011 1.857.791 1.755.043. EQUITY A1 Capital and reserves A2 Valuation adjustments A3 Grants, donations and bequests 232.275 276.289 102.748 received In Figure 6, we see the equity of the company. These are the contributions made by partners or grants or donations.. 16.
(17) ECONOMIC AND FINANCIAL ANALYSIS SECOUYA. Libe Criado Izaguirre. In this figure we observe significant increases in equity that are due to: From 2011 to 2012: It is because the acquisition policy, the payment is executed through exchange of shares and giving priority to shareholders and maintaining a low debt. From 2013 to 2014: The Group has capitalized part of the shareholder loans granted by significant shareholders in 2013. Among the grants requested and received by the firm we can find. requested to. Andalucía for the implementation of management systems, also for the promotion and dissemination of web platforms and finally to technologies for personalization and interaction of digital content. Non-current liabilities are debts and obligations that the company has outstanding long term. Figure 7: Non-current liabilities. I II III IV V VI VII. NON CURRENT LIABILITIES Non current provisions Non current payables Group companies and associates NC Deferred tax liabilities Non current accruals Trade creditors Debts with special characteristics. 2.014 17.783.165 495.908 15.022.842 2.160.350 104.065. 2.013 6.885.961 200.000 4.776.930 1.622.869 286.162. 2.012 6.234.216 200.000 5.464.851 n.d. 569.365. 2.011 7.258.645 201.999 6.455.487 n.d. 601.159. In Figure 7, are non-current liabilities, that is to say, current obligations, of expiration for more than one year. Among the outstanding features of non-current liabilities are the provisions that have increased from 2013 to 2014 since they expect possible contingencies. Another fact would be the debts with associated companies that have been increased by the creation of new partners or group companies. Finally, long debts have increased greatly due to the growth of the company and this debt refers to the buying assets to provide services. Moreover current liabilities are debts and short-term obligations that the company has.. 17.
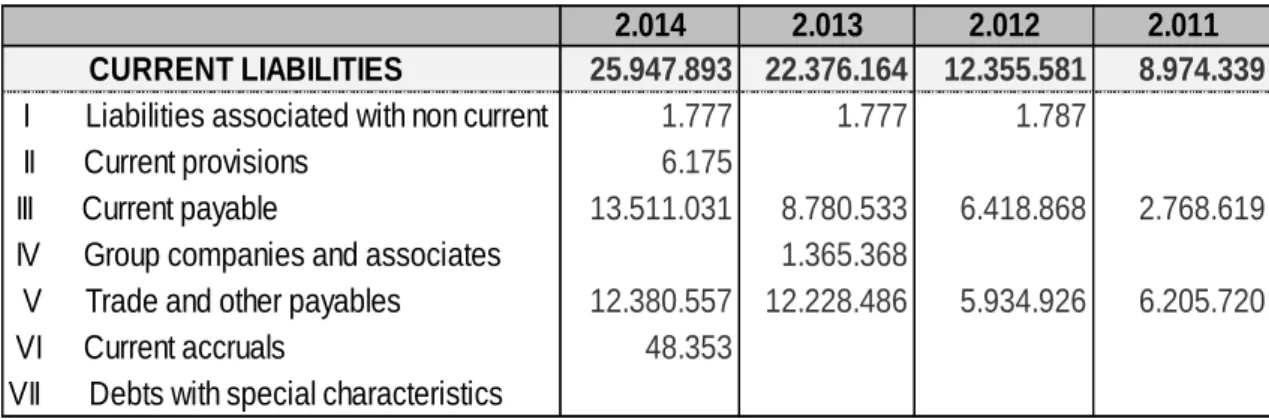
(18) ECONOMIC AND FINANCIAL ANALYSIS SECOUYA. Libe Criado Izaguirre. Figure 8: Current liabilities. I II III IV V VI VII. CURRENT LIABILITIES Liabilities associated with non current Current provisions Current payable Group companies and associates Trade and other payables Current accruals Debts with special characteristics. 2.014 2.013 25.947.893 22.376.164 1.777 1.777 6.175 13.511.031 8.780.533 1.365.368 12.380.557 12.228.486 48.353. 2.012 12.355.581 1.787. 2.011 8.974.339. 6.418.868. 2.768.619. 5.934.926. 6.205.720. In Figure 8, we find current liabilities, which are obligations that will be extinguished or expected to be extinguished this year. As we can see in this figure, the short-term debt has an annual increase due to the growth that the company has. Since this is a developing company that wants to position itself strongly in the sector. In commercial creditors, the group records the amounts outstanding from commercial operations as a result of its activities, which are increased by the growth of the company. A curious fact is that the main debt of the company is higher with credit institutions than for commercial debts, which will provide high financial costs. In order to assess all these data we have calculated several ratios to see what the data tells us in this company.. Working capital The working capital measures the ratio between the active current with current liabilities. This ratio indicates the ability of the company to generate sufficient liquid resources to meet its payment obligations. That is, current assets show the potential of the company to meet its obligations. Working capital = Non-current assets - Current liabilities Figure 9: Working capital. WORKING CAPITAL. 2014 599.267. 2013 -1.983.908. 2012 -1.977.271. 2011 1.290.882. But as we can see in Figure 9, Secuoya had a small crisis in 2012 and 2013 that it could have cost it to face his more immediate expenses. But later we see how in 2014 it is recovered. This crisis happens because of the growth that the company suffers.. 18.
(19) ECONOMIC AND FINANCIAL ANALYSIS SECOUYA. Libe Criado Izaguirre. And the need for this to ask credit institutions for financing to be able to face all the expenses necessary to realize this growth. Figure 10: Graphic Working capital. WORKING CAPITAL. 60,000,000 50,000,000 40,000,000. NET NO CURRENT. 30,000,000. CURRENT. 20,000,000 10,000,000 0 EQUITY AND LIABILITIES. These data explained visually can be seen in Figure 10. This figure shows us how current liabilities are less than current assets. Those are all those collections and debts that are short-term. Therefore we see how non-current liabilities finances part of these charges in the short term, thus facilitating the movement of money.. Liquidity Ratio The liquidity ratio, as well as the working capital, is an indicator of the ability of the company to meet its obligations in the short term. The difference between the two is that the liquidity ratio is a relative index. The liquidity ratio is calculated by dividing current assets from current liabilities. The interpretation of this will depend on whether it is greater or less than one. The values that would have to take should be greater than 1. The higher this ratio, the better the liquidity of the company and therefore creditors will have a greater guarantee for collection. Liquidity ratio = Non-current assets / current liabilities. 19.
(20) ECONOMIC AND FINANCIAL ANALYSIS SECOUYA. Libe Criado Izaguirre. Figure 11: Ratio liquidity. 2014 1,02. LIQUIDITY RATIO. 2013 0,91. 2012 0,84. 2011 1,14. Figure 12: Graph ratio liquidity. LIQUIDITY RATIO 1.20 1.15 1.10 1.05 1.00. LIQUIDITY RATIO. 0.95 0.90 0.85 0.80 2014. 2013. 2012. 2011. As we can see in Figures 11 and 12 during 2011 or 2014 the ratio is greater than one which tells us that it can meet its short-term debts although it is not a high value because it would be perfect to be above the one and a half. On the other hand in 2012 and 2013 the ratio is less than one. Which tells us that the firm does not have enough liquidity to deal with its current liabilities so it will most likely have to deal with their debts with the fixed assets.. Debt ratio The debt ratio measures the relationship between equity and debt of the company both long and short term. Therefore we have also wanted to observe the debt ratio by division of the long and the short term. But first we have to know, how we calculate the ratio. The ratio of short-term debt = Current Liabilities / Equity The ratio of long-term debt = Non-current liabilities / Equity Net total debt ratio = Total Liabilities / Equity. 20.
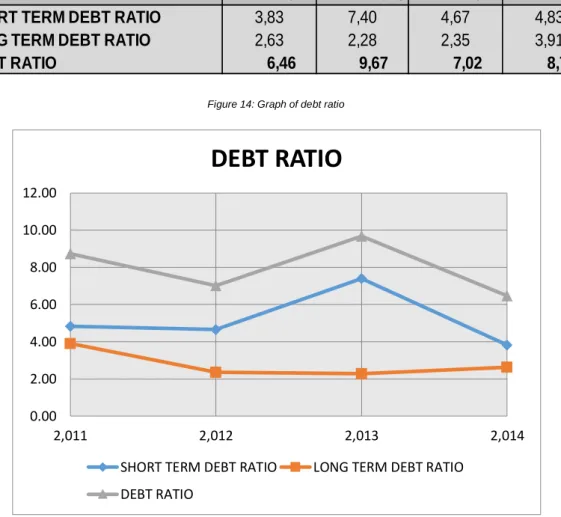
(21) ECONOMIC AND FINANCIAL ANALYSIS SECOUYA. Libe Criado Izaguirre. Figure 13: Debt ratio. 2014 3,83 2,63 6,46. SHORT TERM DEBT RATIO LONG TERM DEBT RATIO DEBT RATIO. 2013 7,40 2,28 9,67. 2012 4,67 2,35 7,02. 2011 4,83 3,91 8,74. Figure 14: Graph of debt ratio. DEBT RATIO 12.00 10.00 8.00 6.00 4.00. 2.00 0.00 2,011. 2,012 SHORT TERM DEBT RATIO. 2,013. 2,014. LONG TERM DEBT RATIO. DEBT RATIO. As shown in Figures 13 and 14 the main finance issue of the company is debt rather than the contribution of social as it has been years since 2013 as the debt was nearly 10 times the capital. We must also comment that there is an increase from 2012 to 2013 due to the debt as mentioned before deferring concessions, since they had a cost. From 2012 they have tried to reduce lo tong-term debt primarily gradually in subsequent years. The ideal data would be that the sum of the two debts was not greater than equity. Short term debts, being so high, indicate that there may be problems in the firm solvency, for the possibility not to address them. But long debts indicate that it has greater margin of time to deal with debts. Therefore, it indicates that the company can face its debts but with a great degree of indebtedness. The most visual way to analyze it would be for example as in 2014 they have a debt ratio of 6.46; this tells us how for each euro contributed by the partners the company borrows 6.46 euros, meaning a large dependence on debt. But as we said luckily the company tries to decrease it every year. 21.
(22) ECONOMIC AND FINANCIAL ANALYSIS SECOUYA. Libe Criado Izaguirre. Finally, it should be noticed than this debt, which is mostly long term debt, is important for the company. This is because this debt is linked to the investments necessary to provide the services of the contracts. In addition, the term of financing the debt corresponding to these assets is less than the minimum duration of the contracts to which it is associated because these assets will increase the cash flow.. Economic evolution In order to be able to find out everything about the economic evolution in the first instance we will talk about the profit and loss account. In this part we will discuss the operating income and expenses, which means, those obtained by the development of its own activity and financial expenses and income from investments made by the company.. 22.
(23) ECONOMIC AND FINANCIAL ANALYSIS SECOUYA. Libe Criado Izaguirre. Figure 15: Counting profit loss. 2014. 2013. 2012. 2011. PROFIT AND LOSS ACCOUNT CONTINUING OPERATIONS 1. Revenue 57.938.705 38.390.943 26.580.147 24.429.851 2. Changes in inventories of 416.332 -153.403 -25.422 974.639 finished 3. Workgoods carries out by the company 530.064 2.212.341 1.438.370 1.293.806 for 4. Supplies -15.928.118 -5.993.960 -2.140.236 -1.575.301 5. Others operating income 103.940 302.257 134.669 5.282 6. Personnel expenses -29.457.487 -22.419.365 -18.154.922 -16.284.501 7. Other operating expenses -8.720.362 -7.350.060 -4.855.175 -3.729.360 8. Amortisation and depreciation -5.399.295 -3.066.881 -2.276.899 -1.662.149 9. Non-financial and other capital 1.074.379 62.861 55.554 42.926 grants 10. Provision surpluse 11. Impaiment and gains on -159.279 4.227 -680 3.041 disposal 12. Negative diffence of business 18.026 255.007 combinations 13. Other results -413.264 -199.357 -272.239 -76.737 RESULTS FROM OPERATING 2.239.480 1.603.393 465.629 1.657.694 ACTIVITIES 14. Finance income 22.296 64.126 101.996 5.743 15. Finance expenses -2.395.833 -1.442.702 -978.416 -696.087 16. Change in fair value of financial -7.500 17. Exchange gains -26.296 -565 -325 18. Impaiment and gains on 8.941 1.008 -130.711 disposal of RESULTS FINANCIAL -2.399.833 -1.370.200 -875.737 -828.555 RESULTS BEFORE TAXES 20. Imcome tax expenses RESULTS FROM CONTINUING Discontinued operations RESULT FOR THE PERIOD. 569.444 58.180 627.624. 434.265 -16.104 418.161. -351.070 400.476 49.406. 829.139 -284.477 544.662. 627.624. 418.161. 49.406. 544.662. As shown in Figure 15, both revenues and operating expenses have been increasing over time due to the growth of the company. Among the highlights are personnel costs, which is an important expense because its large volume that has increased over time, this may be for the projects of new series or projection in which there is a lot of staff.. 23.
(24) ECONOMIC AND FINANCIAL ANALYSIS SECOUYA. Libe Criado Izaguirre. Another important expense is the supply, this has increased to a greater extent in 2014 due to all the growth of the company and the opening of new projects in which it consumes stocks or goods. But if there was a substantial decrease from 2011 to 2012 in the year's result, this was due to delays in the granting of production orders for several television fiction projects that were under development by the 2ble Filo and New Atlantis. Which it means a greater increase of the expenses than of the income. Subsequently it is increasing substantially due to the growth it is obtaining. In other words, it is a company in development and growing We can also observe how in some years the pre-tax profits are greater than the profits after taxes. This is because in calculating deferred taxes we can realize that the one that has to pay us is hacienda. This is due to the fact that as a consequence of the temporary differences between the treatment of the estate according to the accounting guidelines and the tax treatment according to the tax laws. Finally we observe how the benefits that the company obtains are not what could be expected by its level of sales, this is by its great amount of financial expenses. Since the company has a large amount of money coming from credit institutions that produce interest, which will eat the profit. To know the evolution of our company, we have calculated several ratios which will explain the profitability of the company.. Average collection period Customer With the average customer collection period we can find for each contract sold or sold to a chain program, how long it takes to charge for each contract. average collection period = 365 / (Turnover / average balance debtors) Figure 16: average collection period to clients. AVERAGE PERIOD OF COLLECTION. 2014 107,61. 2013 106,67. 2012 97,18. 2011 80,85. Thus in Figure 16, we can say that customer loyalty has caused these over the years take longer to pay. In 2014 reach customers take 107 days to pay.. 24.
(25) ECONOMIC AND FINANCIAL ANALYSIS SECOUYA. Libe Criado Izaguirre. Return on assets The return on assets or also called profitability measures the performance that the company is able to obtain by managing its assets and rights. This is independent of the financial structure and cost. This is because it becomes independent to take the data assets financed and the way to take the profit before tax we refer to an economic surplus that depends on the activity of the company. Therefore we add to the benefit the financial expense to take a more realistic ratio. The formulas for calculating them are: Return on Assets = Profit before taxes + financial assets / Total expenses Margin = Profit before taxes + interest / expenses Turnover Turnover = Revenues / Total assets Margin checking rotation ROA = Figure 17: Return on Assets. RETURN ON ASSETS MARGIN ROTATION PROOF ROA. 2014 5,87% 5,12% 1,15 5,87%. 2013 5,81% 4,89% 1,19 5,81%. 2012 2,95% 2,36% 1,25 2,95%. 2011 8,43% 6,24% 1,35 8,43%. In Figure 17, we can see a positive economic return in which we observe that the company for every euro invested gets 5 cents. This shows that it assets generate benefits that can be considered acceptable. In order to visualize it better we will decompose the ROA in Margin and Rotation. The margin is the profit before tax from sales. The margin is the ratio of profit per unit sold. In this case the company wins per unit sold, between 2014 and 2013, about 5 units. To increase this measure should or increase prices or reduce costs. The good news is that since 2014 this measure is rising so that in the future seems to become greater. Rotation is the sales between the asset. This shows how many times the asset has been sold and replaced. It also reflects the ability of assets to generate profits. We can see that there is a stagnation of this measure between 2013 and 2014 since the increase is insignificant. That is to say that sales increase as the asset increases.. 25.
(26) ECONOMIC AND FINANCIAL ANALYSIS SECOUYA. Libe Criado Izaguirre. With all the observed data we can say that the ratio is positive but could be higher were it not for the high financial expense due to its long-term debt. It is all these expenses that make the company is not so profitable but they hope to reduce them little by little. If these expenses did not have the ratio would increase, which means that for each asset that has the company this would get more benefit than the investment.. Financial profit ROE or financial profitability relates the profit earned by the company with the necessary resources to get this benefit. That is, as the company uses its funds to generate profits. The financial profitability is a relevant factor for the shareholders, because it represents what the invested by the shareholders generates profits and the higher profit company has the most money will be distributed through dividends the company. But to know how financial profitability really works, it is best to break it down into three factors: the leverage margin, the degree of leverage, and the effective cost of debt, all of this taking into account the tax effect. Financial profitability = Profit for the period / Equity effective cost of debt = Interest expense / Total liabilities economic margin = ROA - effective cost of debt Financial leverage = x economic margin (total liabilities / equity) average tax rate = tax benefit / profit before tax Tax effect Tax rate = 1 means Checking ROE = (ROA + Gearing) x Tax effect Figure 18: Financial profitability. FINANCIAL PROFIT EFFECTIVE COST OF DEBT ECONOMIC MARGIN FINANCIAL LEVERAGE AVERAGE TAX RATE TAX EFFECT PROOS ROE. 2014 9,27% 5,48% 0,39% 2,54% -10,22% 110,22% 9,27%. 2013 13,82% 4,93% 0,88% 8,54% 3,71% 96,29% 13,82%. 2012 1,87% 5,26% -2,31% -16,21% 114,07% -14,07% 1,87%. 2011 29,32% 4,29% 4,14% 36,20% 34,31% 65,69% 29,32%. 26.
(27) ECONOMIC AND FINANCIAL ANALYSIS SECOUYA. Libe Criado Izaguirre. In Figure 18 the first factor to take into account in the financial profitability is the financial leverage. It is often said that debts is bad for the company but this is not true, since the financial expense is fiscally deductible. In short, leverage is to use debt to finance an operation. In the most recent data from 2014 and 2013 we observed how the economic profitability is greater to the financial leverage. This indicates that the financial return is higher than the interest rate that is paid for the funds obtained in the loans, to improve these values it would be advisable to reduce debt or renegotiate the cost of debt. It would be advisable since leverage from 2013 to 2014 that is worse deterioration it is due to the increase in financial expenses.. ROA and ROE comparison In 2011 and 2012 the ROA is higher than ROE, this indicates that the average cost of debt is higher than the economic profitability. That is, too much debt for the return we get. But this changes in 2013 and 2014, since ROE is greater than the ROA. So in recent years the average cost of debt is lower than the economic return, that is, financing of part of the asset with debt has enabled the growth of financial profitability.. 27.
(28) ECONOMIC AND FINANCIAL ANALYSIS SECOUYA. Libe Criado Izaguirre. V. Comparison with the sector In order to be able to observe where Secuoya is located in the sector we want to make a comparison of its results with the average of the results of the companies of the sector. But the main thing is to identify the sector. In this case we have identified it as cinematographic activities, video and television programs, sound recording and music edition (J59). In this comparative analysis we will consider several sections; operating costs, profit and profitability; working capital; financial income and expenses; structure of the asset and liability structure. In order to get this data we went to the central balance sheets by sector from the Bank of Spain. Figure 19: Comparison in the sector. Ratio name Operating costs, profit and returns Personal expenses / Net turnover Economic result gross/ Net turnover Economic result gross / Total net debt Net economic result / Net turnover Net economic result / Total assets Result after taxes/ Equity (ROE) Financial expenses and income Financial expenses / Net turnover Financial results / Net turnover Asset structure Property, plant and equipment / Total assets Current assets / Total assets Liability structure Equity / Total equity and liability Debts with credit institutions/ Total E and L Long term debts / Total E and L. Nº Companies. Median. SECUOYA 2014. 6 6 6 6 6 6. 11,22 1,11 2,55 0,28 0,74 14,84. 50,84% 3,87% 5,12% 0,98% 1,13% 9,27%. 6 6. 1,18 10,08. 4,14% 4,14%. 6 6. 3,08 52,61. 20,79% 52,57%. 6 6 6. 36,37 0,12 10,46. 13,40% 56,50% 29,75%. Above the median Below the median As we can see in Figure 19, in the central balance it calculates the median, which is the central number of a group of numbers ordered by size.. 28.
(29) ECONOMIC AND FINANCIAL ANALYSIS SECOUYA. Libe Criado Izaguirre. Another interesting fact is that most ratios the number of companies participating in these data are 6 companies, moreover the data is taken from a number of companies with more business than fifty million euros. So there is not a large number of Spanish companies in this sector that have a greater number of business than fifty million euro. All corresponding to Spain. It should also be noted that these data are from 2014 and therefore we will compare them with the Secuoya data for 2014. In order to visually show the data in the figure we represent with the pink that the data of Secuoya are below the median and in purple that is above the median. Among the ratios collected in the central bank balance sheets Spain are:. Operating costs, profits and returns . Personal expenses / Net turnover In this ratio, the impact of personnel costs on turnover is shown in Figure 19, where the median of staff expenditure in the sector companies is 11.22% while Secuoya spends 50% in personal. That's a big difference. This is because the company makes its own productions of series or films, but it would be advisable to lower this percentage since it is high for the income it has. It may also be that companies in the industry hire other companies to provide sufficient staff for the series.. . Economic result gross/ Net turnover The gross operating margin ratio which is defined as the ratio of the gross operating profit to the turnover and is the basic or primary measure of the profitability of the operation from the company's point of view. Secuoya has an advantage in this position since the median in this ratio is of 1.11% while our company has a 3.87%. This means that on the turnover figure we obtain higher operating results. This is because it has less operating costs.. . Economic result gross / Total net debt In this ratio we take into account the profitability that we take to the debt that we acquire. As we have seen previously Secuoya has high levels of debt due to its investments but this is due to the constant growth it is having. The median of this ratio is 2.55%. But our company gets a figure of 5.12%. This is because of the great debt of the company. Maybe the other companies in the sector do not have debts because they are already consolidated in the sector and already have the necessary material to carry out their activity.. 29.
(30) ECONOMIC AND FINANCIAL ANALYSIS SECOUYA. . Libe Criado Izaguirre. Net economic result / Net turnover Figure 20: Net economic result / Net turnover. Source: Bank of Spain. As we see in Figure 20, Sequoia is above the median. This ratio is important because it shows the profitability that the companies obtain for their sales since it shows the final result of the company on the net amount of business. This percentage is usually low because these companies move a lot of money for the normal business of the company and therefore has many expenses both in investments in assets and financial expenses for the debts of these investments. In this case Secuoya triples this data compared to the median of companies in the sector. This indicates to us that it brings greater profitability to its sales than companies of its same sector. . Net economic result / Total assets Figure 21: Net economic result / Total assets. Source: Bank of Spain. In order to know the profitability we get from the management of your assets and rights, that is, from our assets; we use this ratio, which represents ROA but with financial expenses. As we see in Figure 21, Secuoya brings greater profitability to its assets. This is because the company does not stop investing in technological improvements and communication tools always related to the projects initiated as are the series for later sale. In addition, it is immobilized and can subsequently be used in other projects.. 30.
(31) ECONOMIC AND FINANCIAL ANALYSIS SECOUYA. . Libe Criado Izaguirre. Result after taxes/ Equity Figure 22: Result after taxes/ Equity. Source: Bank of Spain. As we see in figure 22, this ratio is considered as the financial profitability, that is, ROE. The Roe as we have seen above relates the profit obtained by the company with the resources necessary to obtain profit. In the sector, the median ROE is 14.84%, while Secuoya is 9.27%. This indicates to us that the majority of the companies in the sector obtain a greater profitability or benefit of the invested thing. In other words, the shareholders of Secuoya could obtain a higher return on investment.. Financial income and expenses . Financial expenses / Net turnover This indicates what ratios percentage of our sales goes to financial expenses, namely normally the interests of debts or loans we have with credit institutions. Thus it can see how our company nearly tripling median companies. This is because most company investments are made with debts to credit institutions and growth needs to be greater investment in their assets.. . Financial results / Net turnover The result of sequoia in this ratio is equal to the previous ratio. This is because almost all their expenses and financial income are the debt interest expenses. But we can see how companies in the sector have more types of expenses or financial income because this ratio is higher.. Asset structure . Property, plant and equipment / Total assets This ratio represents that percentage of our asset is tangible. Sequoia their ratio is 20.79% while the sector median is 3.08%. This difference may be due to several factors such as the company buys all the material for the series or movies with the intention of then being able to reuse it, it may also be that the sector companies renting the material or instead of playing their series buy the copyright of the series who want to sell. 31.
(32) ECONOMIC AND FINANCIAL ANALYSIS SECOUYA. . Libe Criado Izaguirre. Current assets/ Total assets This ratio represents the asset that can be obtained cash quickly on the total this asset. In this we observe that the company has a percentage equal to the median. Therefore it seems that the company consists of a current asset equal to that other companies of the sector.. Liability structure . Equity / Total equity and liabilities Figure 23: Equity / Total equity and liabilities. Source: Bank of Spain. They represent equity contributions from the partners. Thus we see that percentage of its liabilities and shareholders' equity equals equity. As shown in Figure 23, this ratio we see other companies prefer to finance a greater extent than sequoia in members' shares rather than debt. Secuoya instead uses another strategy, they finance more with debt. . Debt with credit institutions / Total equity and liabilities This ratio is the continuation of the earlier time in which we see what has been said, the sector companies do not use debt to finance both Secuoya instead uses more than 50% of liabilities in debt financed.. . Long term debts / Total equity and liabilities As we observe in this ratio Secuoya triples the data of the sector with almost 30 percent of total net worth and liabilities. This is due to the growth you are experiencing. Since to grow you need investment that in these sectors is not cheap. But most of this debt will disappear or be converted into short-term debt since you will not have to make any more investments because you already have the assets.. 32.
(33) ECONOMIC AND FINANCIAL ANALYSIS SECOUYA. Libe Criado Izaguirre. VI. Conclusions Throughout this document, we have been talking about the company sequoia deepening a little in its history and its position in the communication sector trying to increase their action, thanks to its growth. Everything they do to get consolidated in the sector with new projects. On the other hand I have put a lot of emphasis on making an economic and financial analysis of the company in which we could draw several conclusions. Initially it started with an economic analysis which has revealed the great effort made by the company to get everything you need to develop the activity, reaching a point in the past, not now, where they could have difficulties to be able to meet its short-term payments as show liquidity ratios and working capital. Moreover, the debt ratio we have been able to observe how Secuoya had to make very large investments to get assets for their productions, which have had to finance with debt with credit institutions, mostly longterm. Subsequently there has been a financial analysis of the company in which we reveal that over time has got a trust with their customers and for them these take longer to charge, it may also be because they are already regular customers of the company. Then we analyzed the return on assets (ROA), which measures the performance that takes the company to the assets and rights that you have. This value could be higher but over the years this ratio it is more likely to grow by the level of growth of the company. To conclude this analysis, the calculation of financial profitability where we consider it high but because the company has more debt is made that own funds to carry out their activities but this is taken into account due to the high financial costs reduce the ultimate benefit. Finally there has been a comparative analysis with the industry to know how the company could improve its performance. On the one hand, we observe a high level in personnel costs this may be temporary hires or producing their own series in which competitors do not need to hire third parties and reach a whatever of independent professional services and they are not visually see in their accounts as personnel expenses. Also we observed that in the sector sequoia has a higher level on the percentage of debt that represents the benefits, what it means that, the company has more debt than other companies, This is because the company is growing and has all the necessary assets to carry out the activity and therefore is going to buy according to their needs but in the future the debt of these assets will disappear and the assets remain in the company so this ratio down and stabilized with the sector median. 33.
(34) ECONOMIC AND FINANCIAL ANALYSIS SECOUYA. Libe Criado Izaguirre. Furthermore, we observed that Secoya gets better outcome than the sector median performance of their assets but in turn lower yield shareholders take the money invested by the sector. This is because the company invests in assets necessary to get the benefit but in turn also collects debts for these goods. These debts will decrease over time since they already have the necessary assets to carry out the activity. The final conclusion we can get from this work is that Secuoya is a growing company that has had to grow into debt. But it is expected that in the future the weaknesses that have to take greater profitability in the sector disappear so they can position themselfs as one of the first larger companies with greater profitability in the sector.. 34.
(35) ECONOMIC AND FINANCIAL ANALYSIS SECOUYA. Libe Criado Izaguirre. VII. Bibliography Bank of Spain, 2014. Ratios sectoriales de las sociedades no financieras. [Online] Available at: <http://app.bde.es/rss_www/Ratios> [Visited May 30, 2017] Garrido Miralles Pascual, Iñiguez Sánchez Raúl, 2010: Análisis de estados contables Elaboración e interpretación de la información financiera. Madrid. Secuoya. communication. group.. Business. areas.. [Online]. Available. at:. <http://www.gruposecuoya.es/areas-de-negocio/> [Visited April 6, 2017]. Secuoya Group, 2011. Documento informativo de incorporación al mercado alternativo bursátil, segmento para empresas en expansión. [Online] Available at: <http://gruposecuoya.es/wpcontent/uploads/2013/08/u_SECUOYA_documento_inf ormativo.pdf> [Visited May 10, 2017]. Secuoya communication group SA, 2011. Informe grupo ejercicio 2011. [Online] Available. at:. <https://www.bolsasymercados.es/mab/documentos/InfFinanciera/. 2012/04/ 31703_InfFinan_20120427.pdf> [Updated 2012] Secuoya communication group SA, 2012. Informe grupo ejercicio 2012. [Online] Available. at:. <https://www.bolsasymercados.es/mab/documentos/InfFinanciera/. 2013 /04/31703_InfFinan_20130430.pdf> [Updated 2013] Secuoya communication group SA, 2013. Informe grupo ejercicio 2013. [Online] Available. at:. <https://www.bolsasymercados.es/mab/documentos/InfFinanciera/. 2014 /04 / 31703_InfFinan_20140430.pdf> [Updated 2014] Secuoya communication group SA, 2014. Informe grupo ejercicio 2014. [Online] Available. at:<https://www.bolsasymercados.es/mab/documentos/InfFinanciera/. 2015/04/ 31703_InfFinan_20150430.pdf> [Updated 2015]. 35.
(36)
Figure


+7


Documento similar
In this paper an ECA rule simulator is presented, which uses a Petri net model, named Conditional Colored Petri Net (CCPN), to depict ECA rules as a Petri net
In this paper an ECA rule simulator is presented, which uses a Petri net model, named Conditional Colored Petri Net (CCPN), to depict ECA rules as a Petri net structure, and with
Global agricultural green and blue water Global agricultural green and blue water consumptive uses and virtual water trade consumptive uses and virtual water trade.. in the
Therefore, the definition of convergence according to the method of Phillips and Sul (2009) is based on the new theory of economic growth, where it is considered that the
A poc a paf el cel es.. Tots els colors de l'Horta se destrien quan ix el t·;)l i ·el mar ¡s'ompli de veles, quan pe'1s camins eixuts i per les sendes' els homes van alegr·e·s a
Figure 4.16 shows the training and validation progression for a vanilla U-Net model and for two Attention Gated U-Net models, trained with Dice and Hybrid Loss functions and with
For example, in (Ju´lvez, Bemporad, Recalde, & Silva 2004) hybrid control techniques based on Mixed Logic Dynamical systems (Bemporad & Morari, 1999) are applied to
BR NET WORLD TELECON LTDA - ME BR Net X Provedor de Internet Ltda - ME BR Net-Uai Internet Provider LTDA ME BR NET.COM TELECOMUNICAÇÕES BR NET.COM TELECOMUNICACOES EIRELI BR
